Extract the empirical age distribution of contacts from a survey
Source:R/contact-age-distribution.R
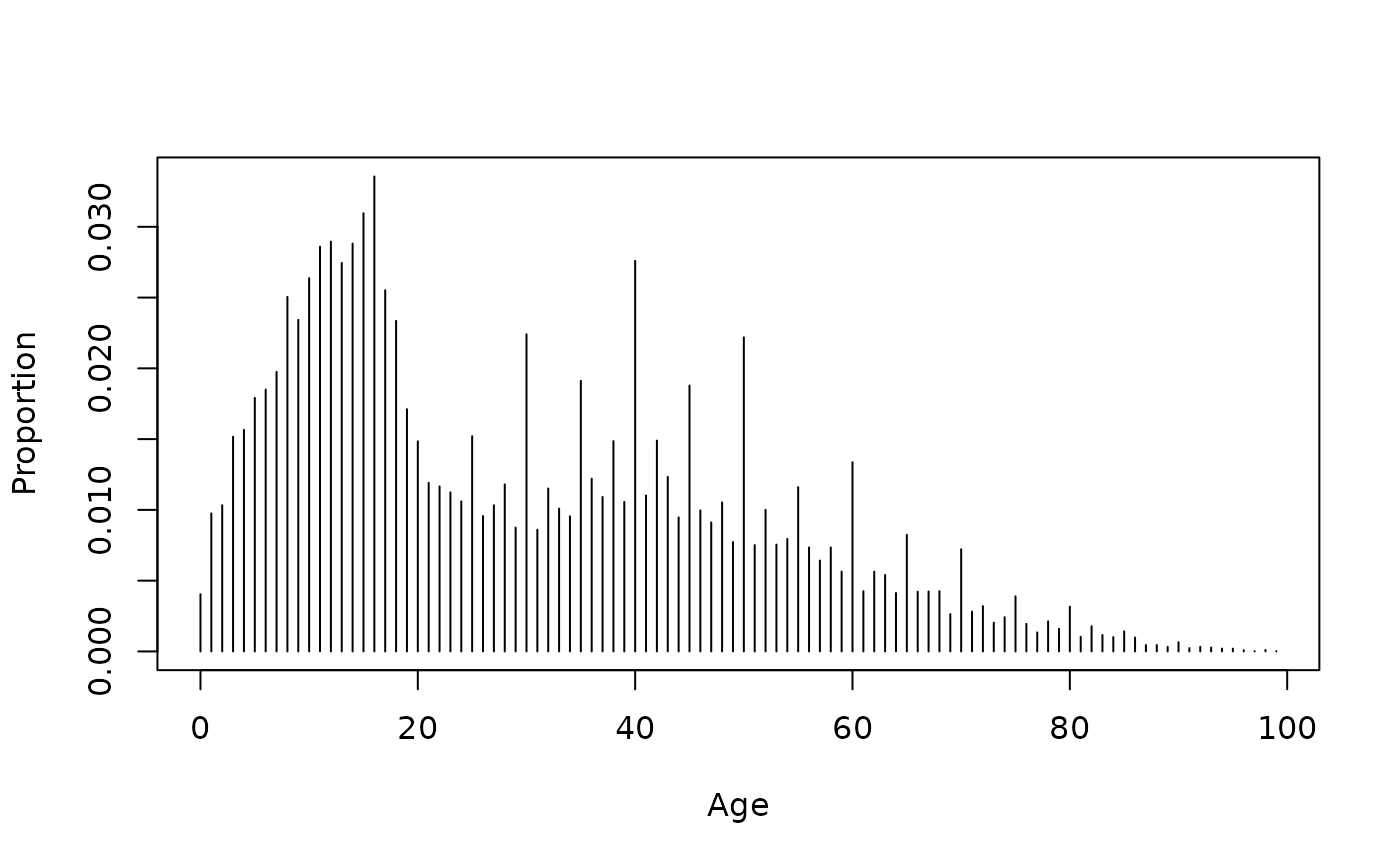
contact_age_distribution.RdReturns a data.frame of (age, proportion) pairs representing how
contact ages are distributed in the survey. This can be passed to
assign_age_groups() as estimated_contact_age to impute ages
from ranges using this distribution rather than uniform sampling.
Arguments
- survey
a
survey()object