Skip to contents

[Questioning] 
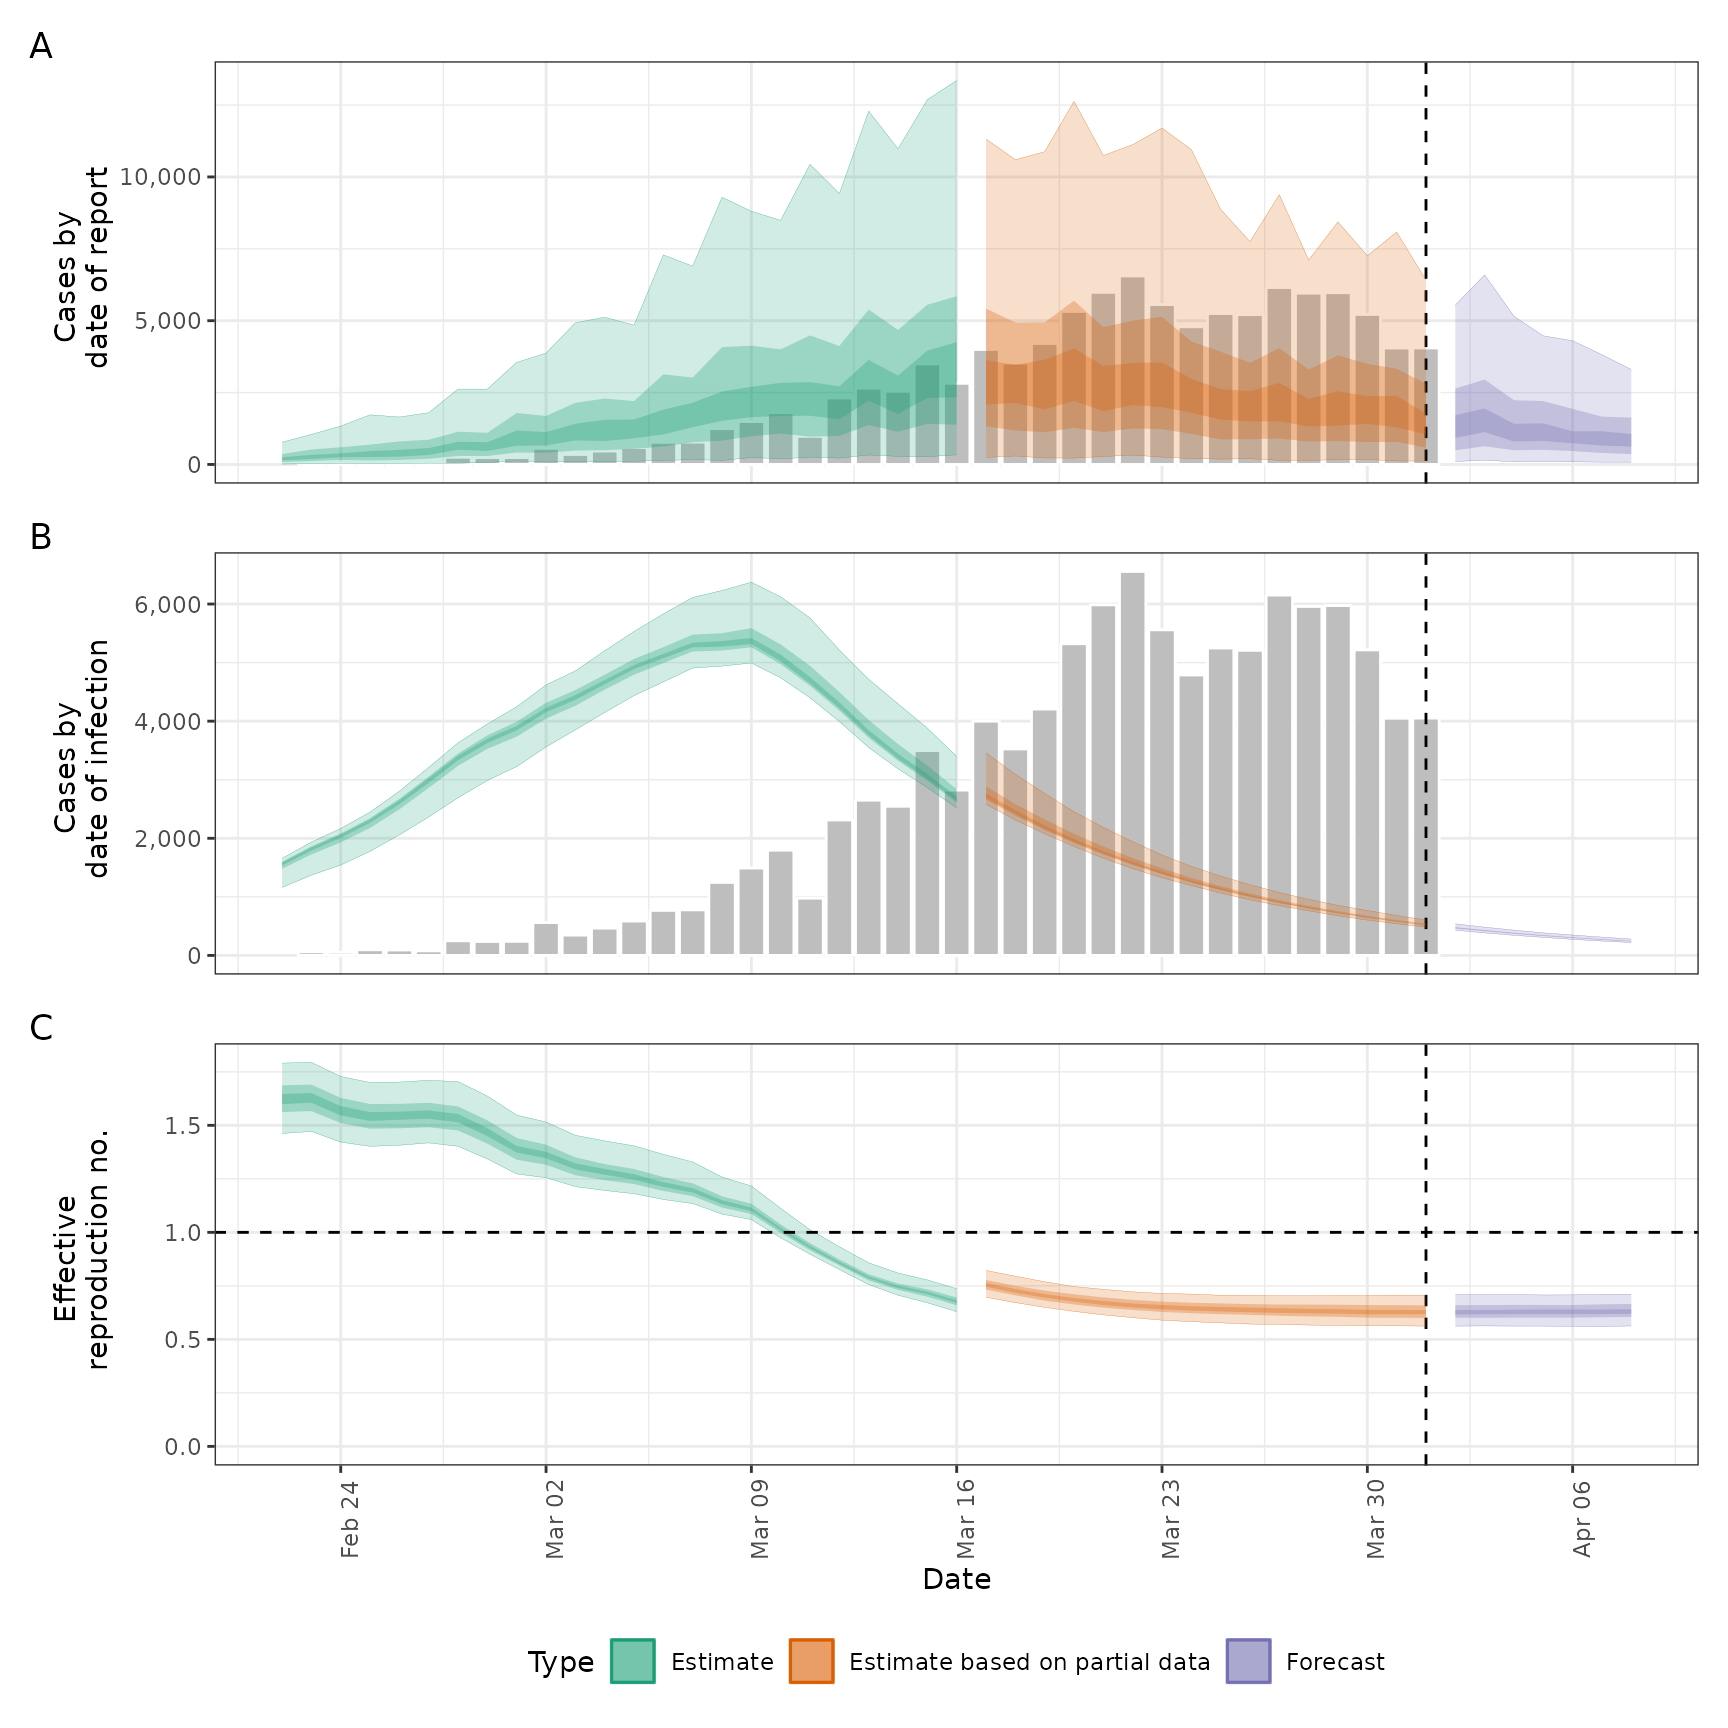
Returns key summary plots for estimates. May be depreciated in later releases as current S3 methods are enhanced.

Usage

report_plots(summarised_estimates, reported, target_folder = NULL, ...)

Arguments

summarised_estimates

A data.table of summarised estimates containing the following variables: variable, median, bottom, and top.

It should also contain the following estimates: R, infections, reported_cases_rt, and r (rate of growth).

reported

A data.table of reported cases with the following variables: date, confirm.

target_folder

Character string specifying where to save results (will create if not present).

...

Additional arguments passed to plot_estimates().

Value

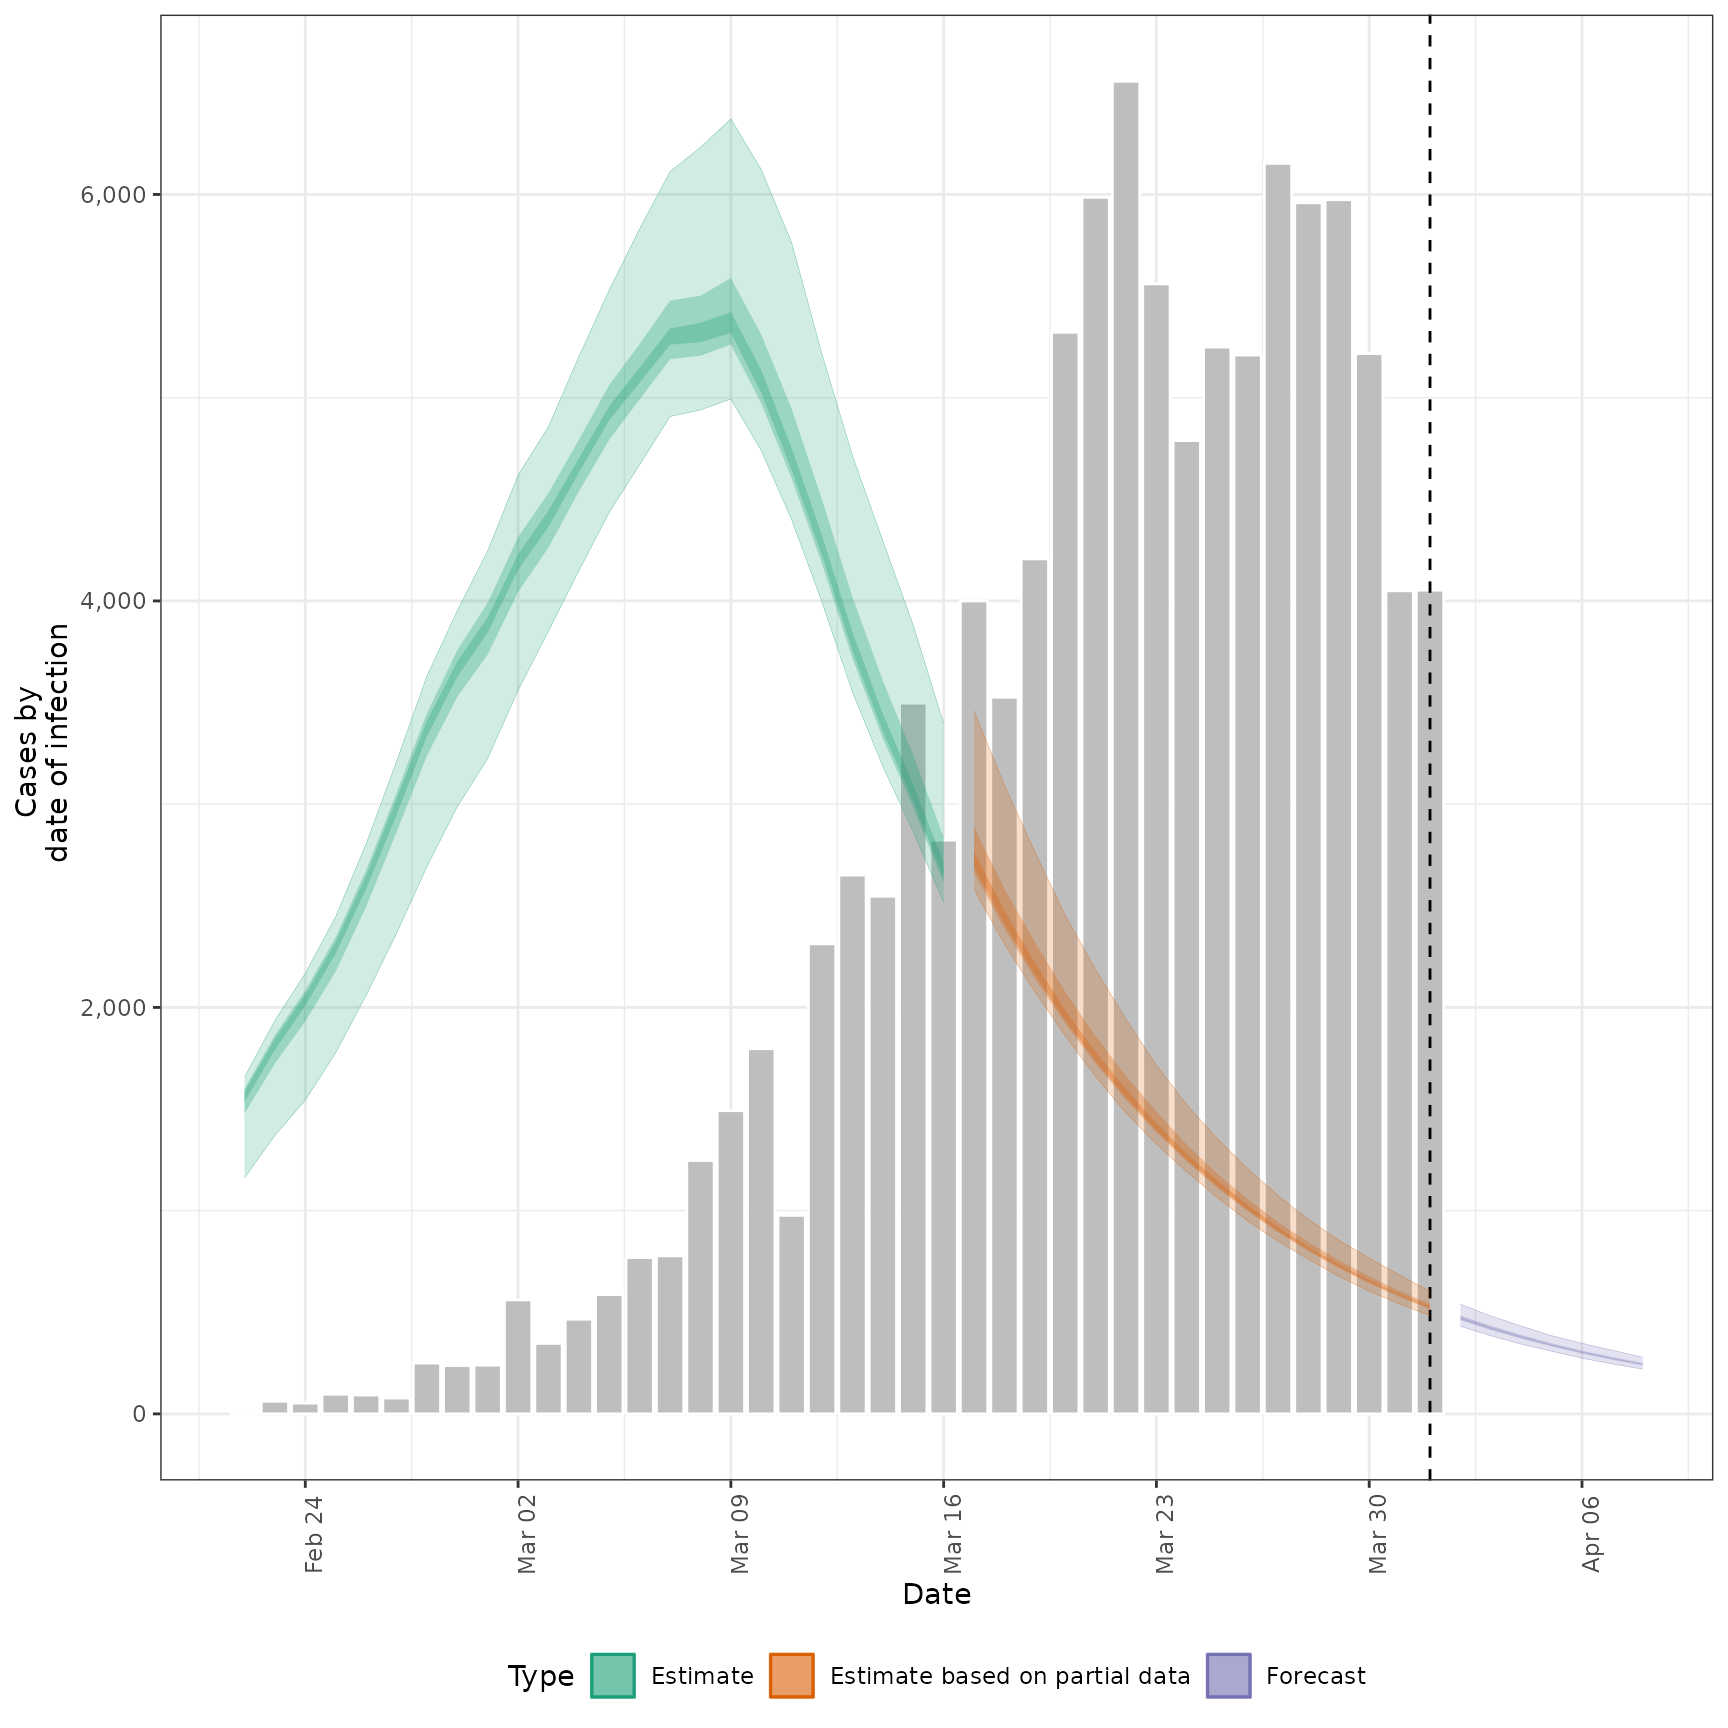
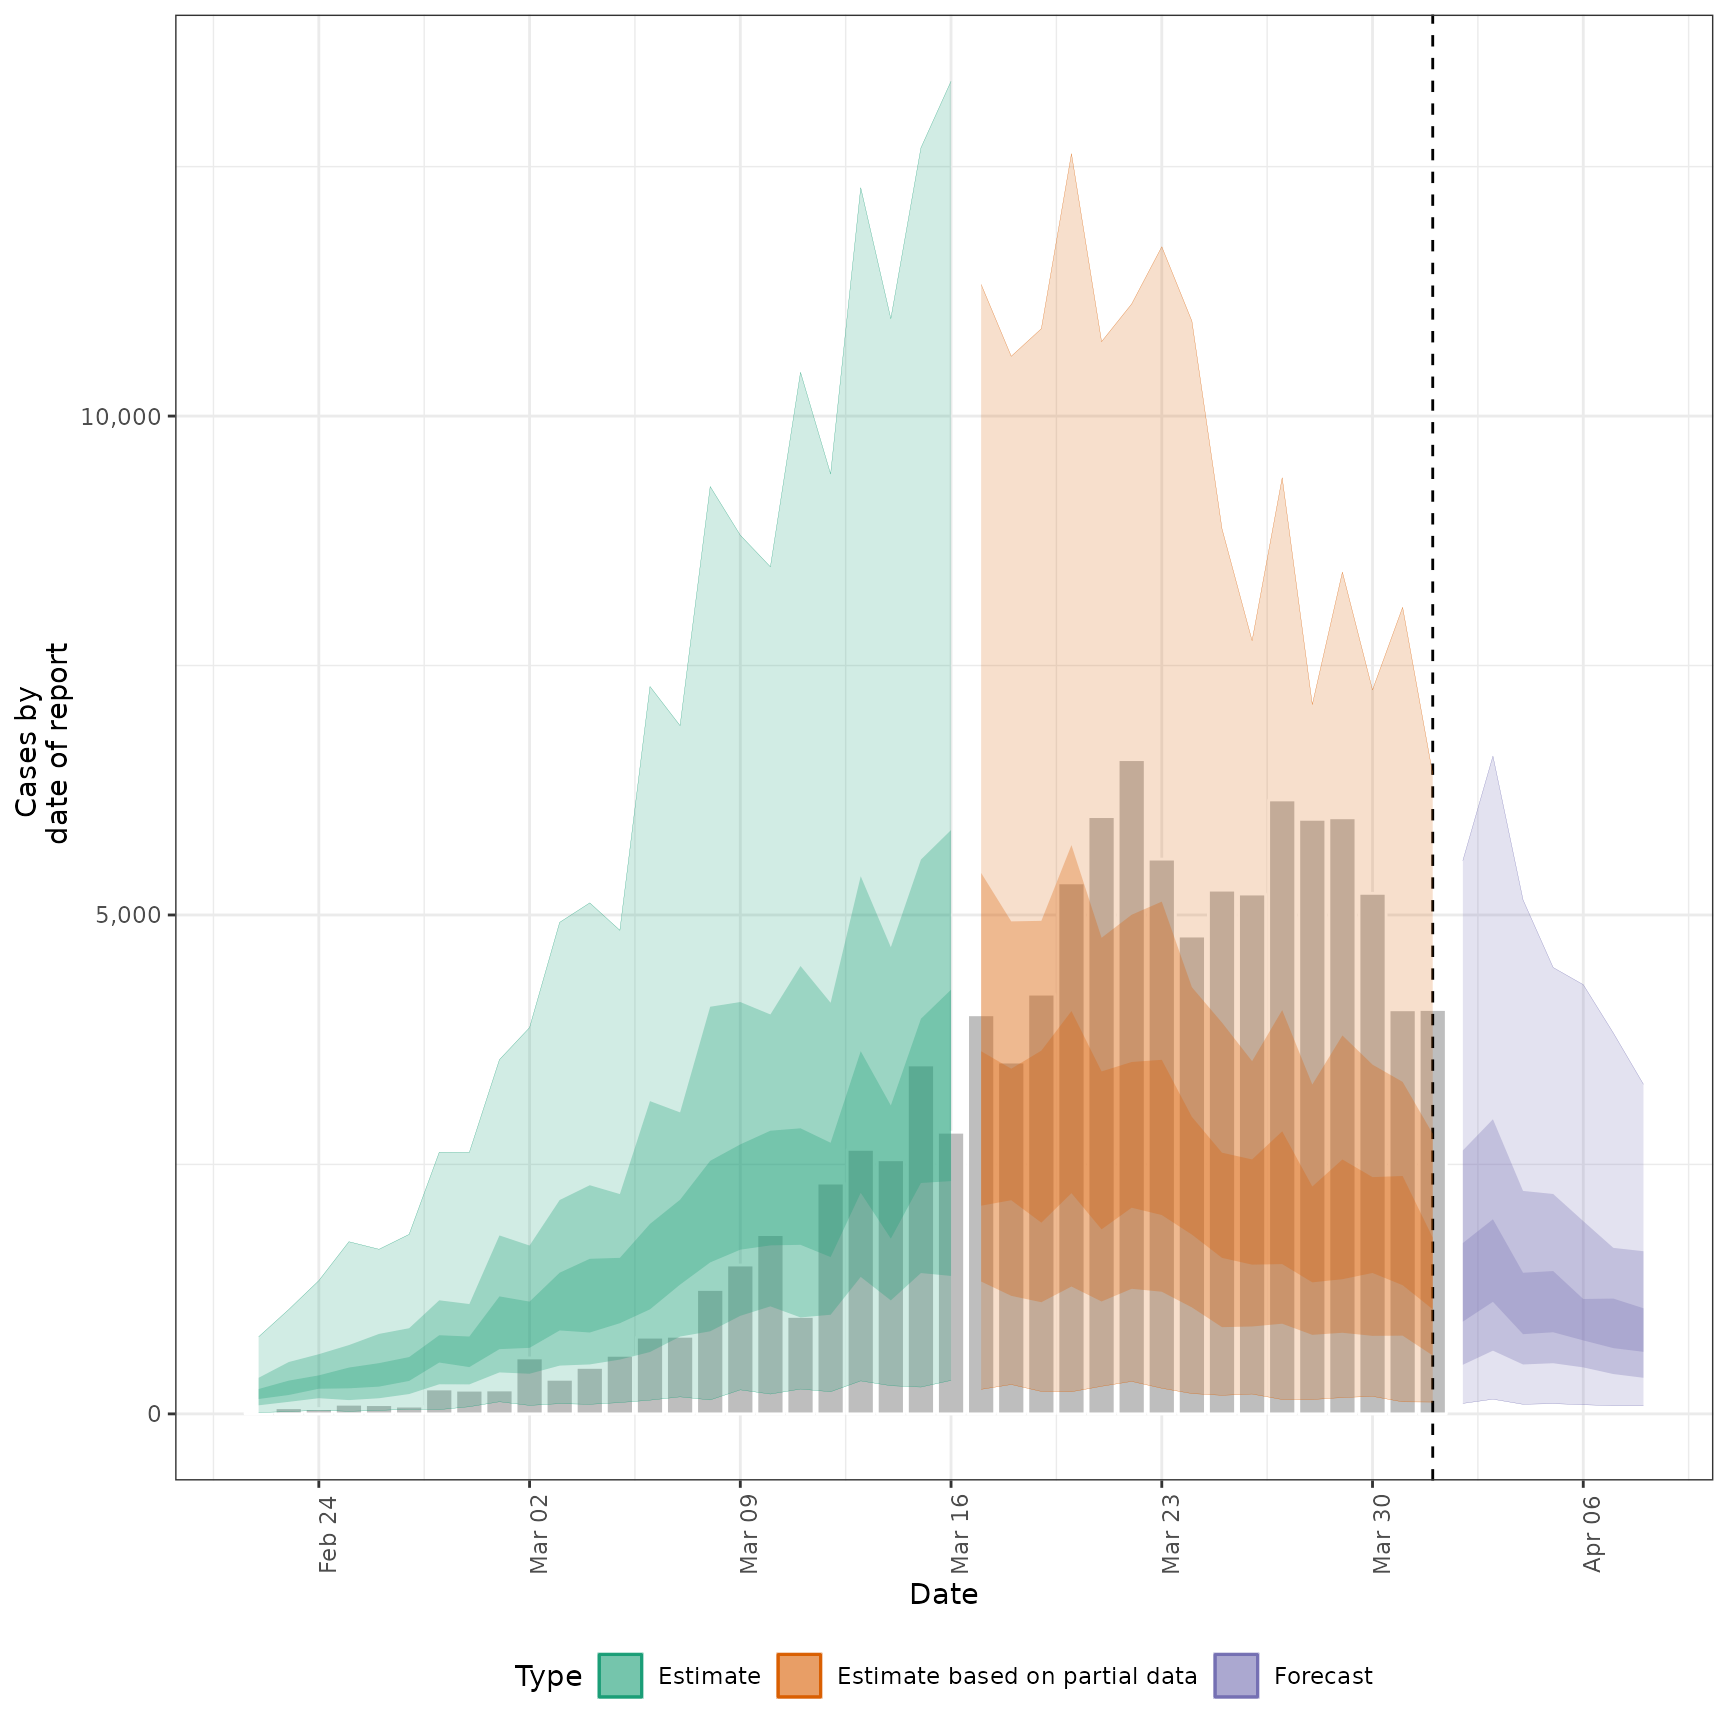
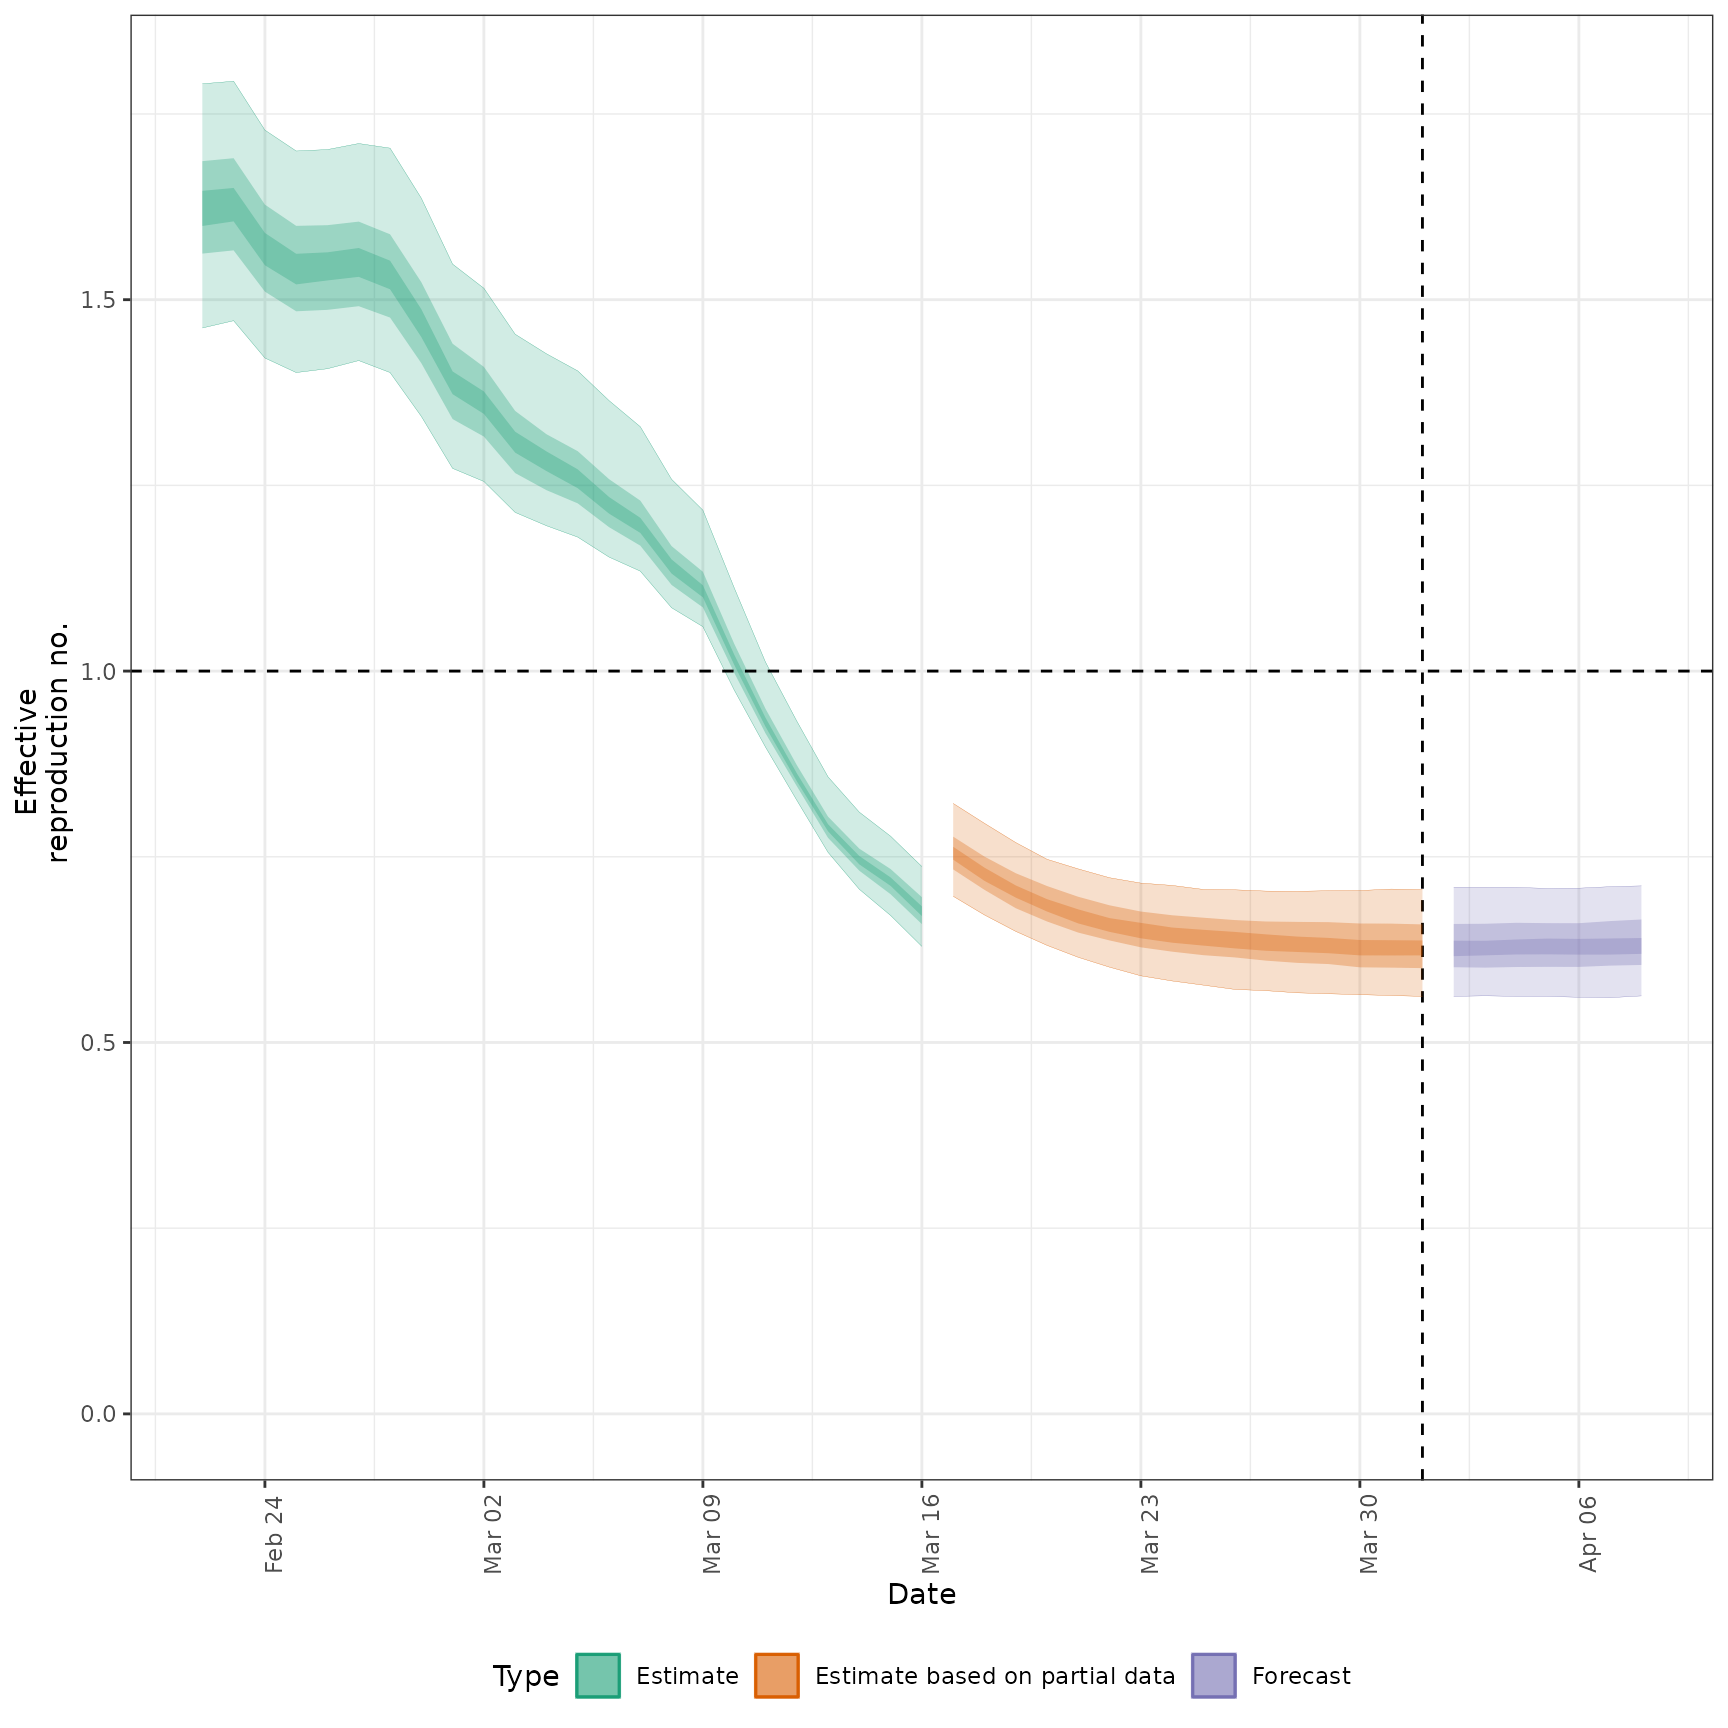
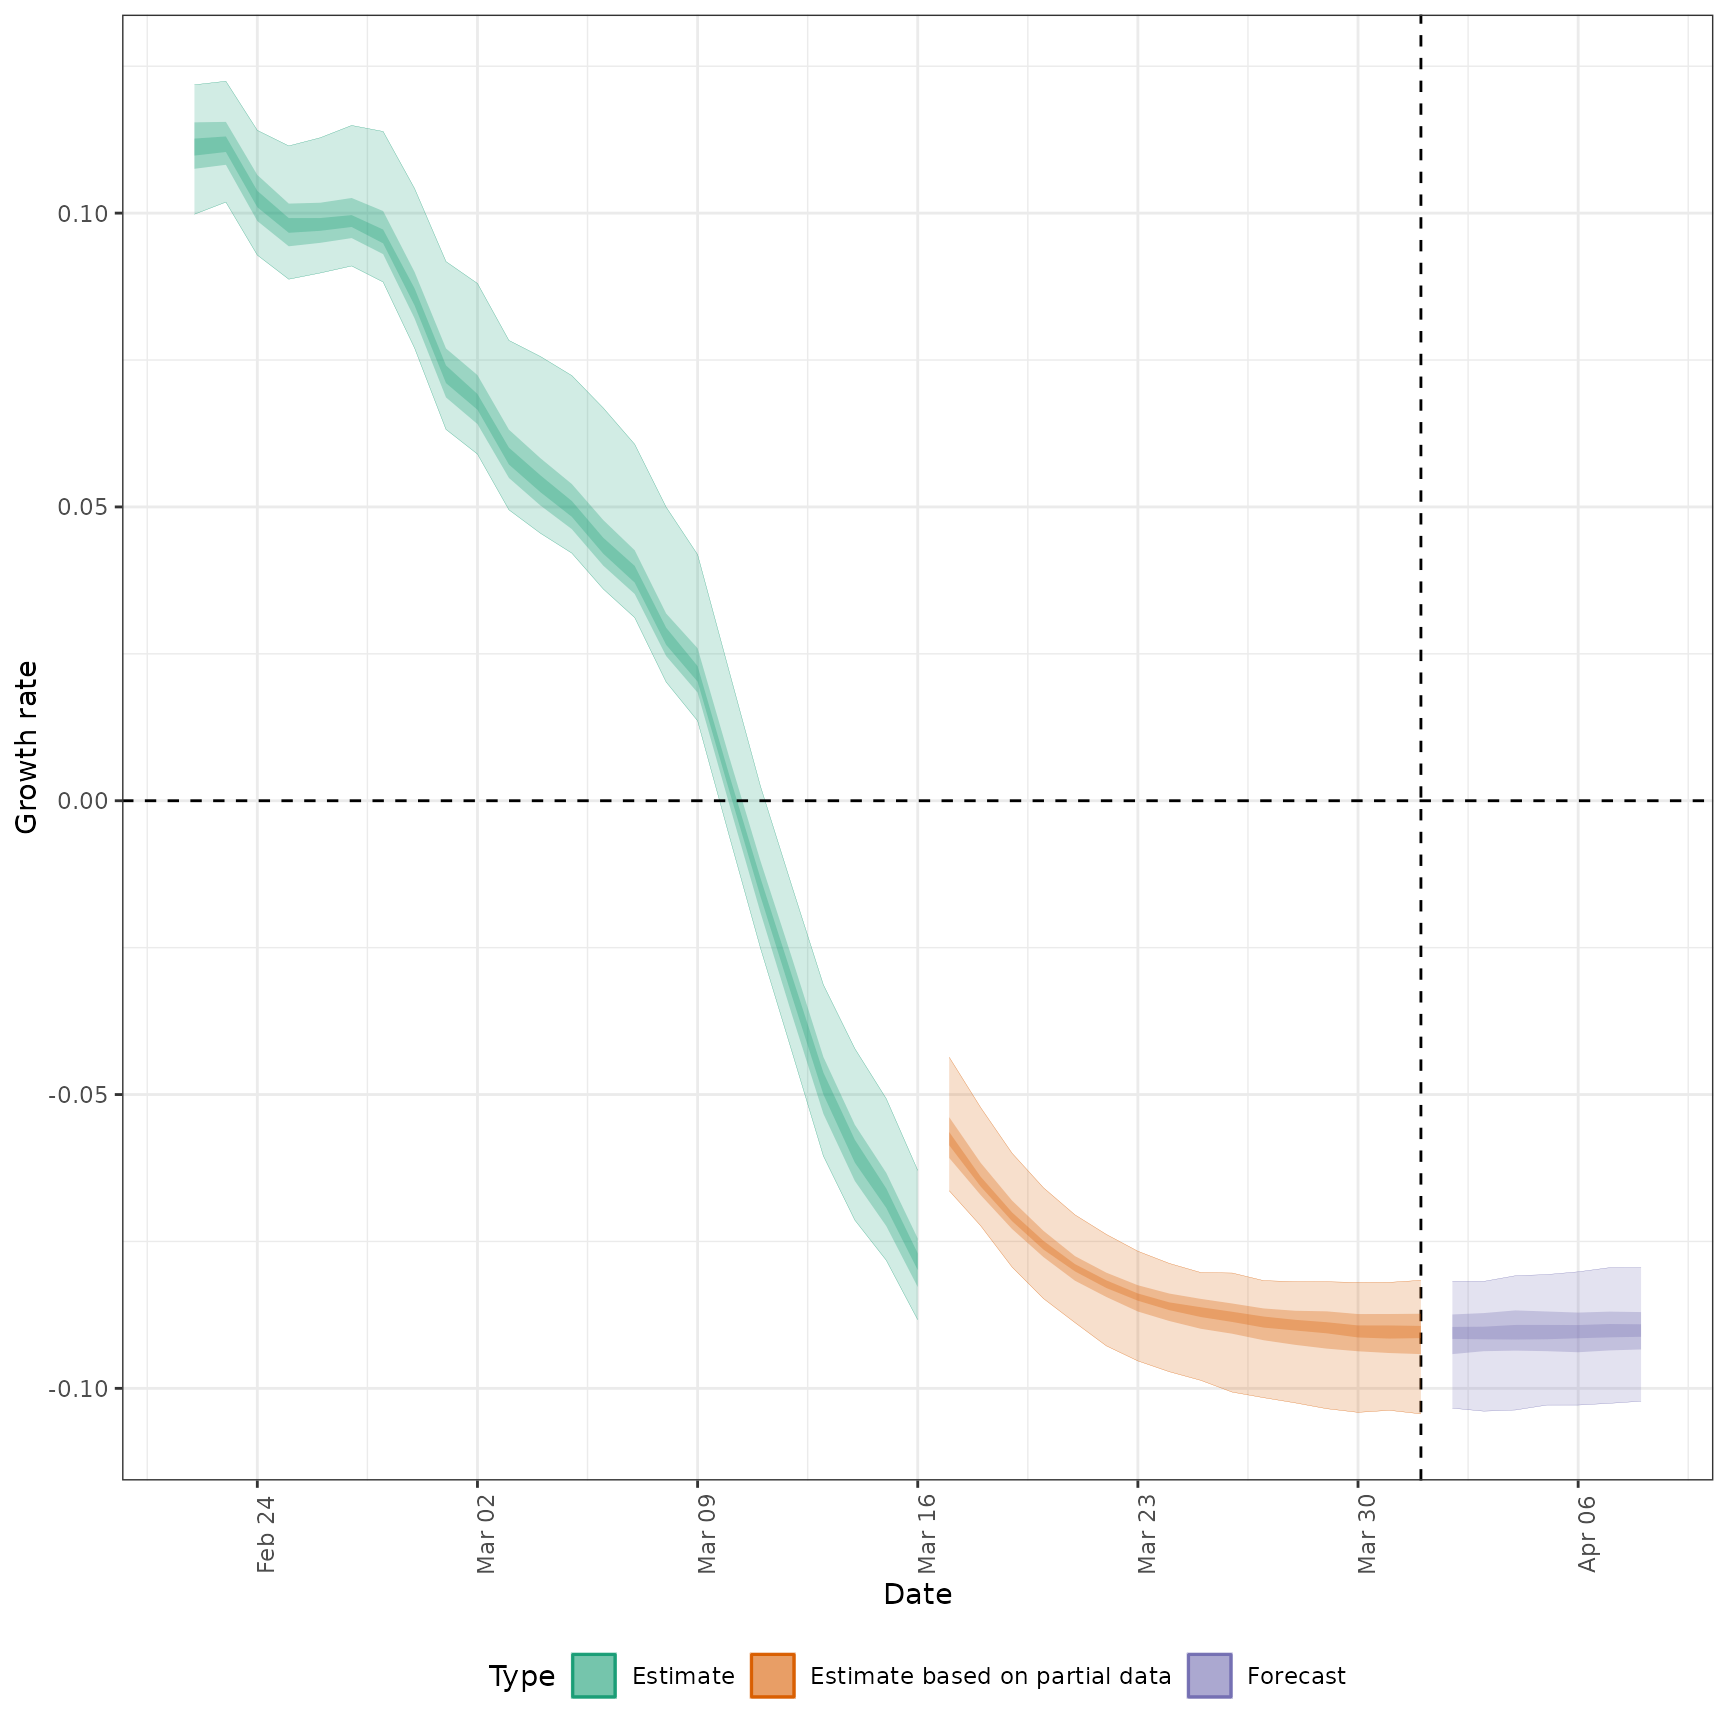
A named list of ggplot2 objects, list(infections, reports, R, growth_rate, summary), which correspond to a summary combination (last item) and for the leading items.

See also

plot_estimates() of summarised_estimates[variable == "infections"], summarised_estimates[variable == "reported_cases"], summarised_estimates[variable == "R"], and summarised_estimates[variable == "growth_rate"], respectively.

Examples

# \donttest{
# define example cases
cases <- example_confirmed[1:40]

# set up example delays
generation_time <- get_generation_time(
 disease = "SARS-CoV-2", source = "ganyani"
)
incubation_period <- get_incubation_period(
 disease = "SARS-CoV-2", source = "lauer"
)
reporting_delay <- bootstrapped_dist_fit(
 rlnorm(100, log(6), 1), max_value = 30
)
#> Warning: `samples` must be at least 1000. Now setting it to 1000 internally.

# run model
out <- estimate_infections(cases,
  stan = stan_opts(samples = 500),
  generation_time = generation_time_opts(generation_time),
  delays = delay_opts(incubation_period + reporting_delay),
  rt = NULL
)
#> Warning: The following variables have undefined values:  gt_rev_pmf[1],The following variables have undefined values:  gt_rev_pmf[2],The following variables have undefined values:  gt_rev_pmf[3],The following variables have undefined values:  gt_rev_pmf[4],The following variables have undefined values:  gt_rev_pmf[5],The following variables have undefined values:  gt_rev_pmf[6],The following variables have undefined values:  gt_rev_pmf[7],The following variables have undefined values:  gt_rev_pmf[8],The following variables have undefined values:  gt_rev_pmf[9],The following variables have undefined values:  gt_rev_pmf[10],The following variables have undefined values:  gt_rev_pmf[11],The following variables have undefined values:  gt_rev_pmf[12],The following variables have undefined values:  gt_rev_pmf[13],The following variables have undefined values:  gt_rev_pmf[14],The following variables have undefined values:  gt_rev_pmf[15]. Many subsequent functions will not work correctly.
#> Warning: Bulk Effective Samples Size (ESS) is too low, indicating posterior means and medians may be unreliable.
#> Running the chains for more iterations may help. See
#> https://mc-stan.org/misc/warnings.html#bulk-ess
#> Warning: Tail Effective Samples Size (ESS) is too low, indicating posterior variances and tail quantiles may be unreliable.
#> Running the chains for more iterations may help. See
#> https://mc-stan.org/misc/warnings.html#tail-ess

# plot infections
plots <- report_plots(
  summarised_estimates = out$summarised,
  reported = cases
)
plots
#> $infections

#> 
#> $reports

#> 
#> $R

#> 
#> $growth_rate

#> 
#> $summary

#> 
# }