| File | One row is | Rows | Use it for |
|---|---|---|---|
| facility_events.csv | one thing one report says about one facility | 1,895 | anything that should respect what was known when |
| facilities.csv | one facility, with dates derived from its events | 604 | a register of sites; a join key |
| facility_opening.csv | one facility, with the interval its opening falls in | 604 | opening dates, with their censoring |
| capacity_indicators.csv | one figure: an indicator, a place, a date, a source | 2,280 | system bed capacity and occupancy over time |
Data and methods
What the tables hold, how far they can be trusted, and how to use them in a model
This page is for anyone using the data in an analysis. The overview is the short version. The column definitions are in dictionary.md.
The tables
Every row in the first and last tables carries the sentence or table row it came from, in evidence_quote, and the report it came from. Read the quote before relying on a row.
Loading, in R:
library(data.table)
base <- "https://raw.githubusercontent.com/epiforecasts/bvd-capacity/main/data/"
events <- fread(paste0(base, "facility_events.csv"))
opening <- fread(paste0(base, "facility_opening.csv"))
capacity <- fread(paste0(base, "capacity_indicators.csv"))

# The national bed series a model should use: DRC only, one figure a key
beds <- capacity[country == "Democratic Republic of the Congo" &
    indicator == "beds_capacity" & level == "national" & preferred]
Pin a commit rather than main for anything you publish: ids change as naming decisions land.
Reports read
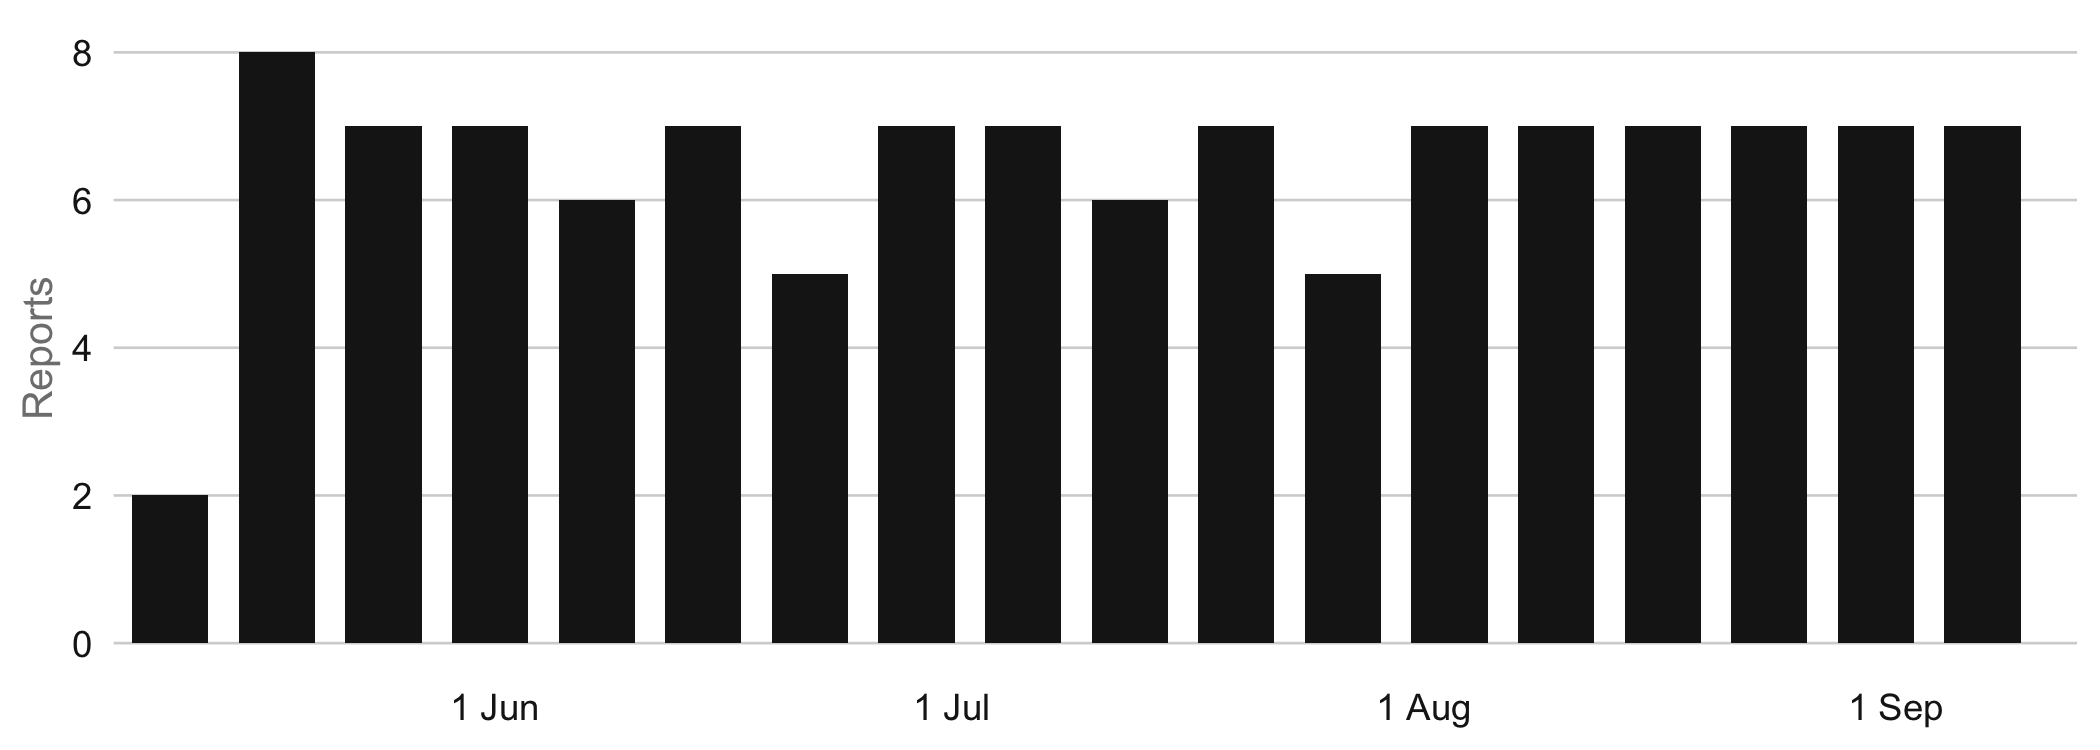
116 reports, SitReps 001 to 122, from 14 May to 13 September. Missing numbers: 003, 029, 043, 045, 063, 075, 076. 006_v2 is a reissue kept as its own report.
From sentences to facilities
| Events | What the report gave |
|---|---|
| 1,604 | named, resolved to a facility id |
| 178 | a site described but not named |
| 113 | a name that could be several sites |
A language model (gemini-3.1-pro, low thinking, one call a report) reads each report and returns events in a fixed vocabulary, each with a quote. A quote that is not a character-for-character span of the report is dropped; 2 events are dropped this way and listed in checks/rejected_events.csv. Names are then keyed and matched to a hand-maintained vocabulary of spellings.
Code cannot tell a misspelling from a second centre at the same hospital, so where two names might be one site they stay apart and are flagged. A person settles each question and the answer is recorded with who decided and why.
| Decision | Decided by | Questions |
|---|---|---|
| looked at, left open | kathsherratt | 3 |
| kept apart, deliberately | kathsherratt | 5 |
| merged into one facility | kathsherratt | 14 |
| merged into one facility | claude-code | 5 |
claude-code decisions were made by the assistant that built the pipeline from GRID3 names and spelling evidence, and nobody who knows the sites has checked them. 9 questions have evidence sheets in checks/decisions/ and are unanswered. Until they are, facility counts are an upper bound: the error runs towards counting one site twice, never towards merging two.
Opening dates
The reports almost never give an opening date. An opening is inferred from two kinds of report: one showing a site being built or planned (it had not opened by then) and one showing it open or holding patients (it had opened by then).
| Kind of site | bounded | left censored | right censored | uninformative |
|---|---|---|---|---|
| Hospital isolation | 1 | 80 | 1 | 1 |
| Isolation centre (CI) | 0 | 8 | 9 | 4 |
| Transit centre (CT) | 0 | 33 | 2 | 1 |
| Treatment centre (CTE) | 13 | 49 | 7 | 1 |
bounded is a site seen building and later seen open, so both ends of its opening are known. left censored is first seen already open: the opening is at or before that date and nothing earlier is known. right censored was seen building and never seen open. For most sites the only honest statement is “open by this date”.
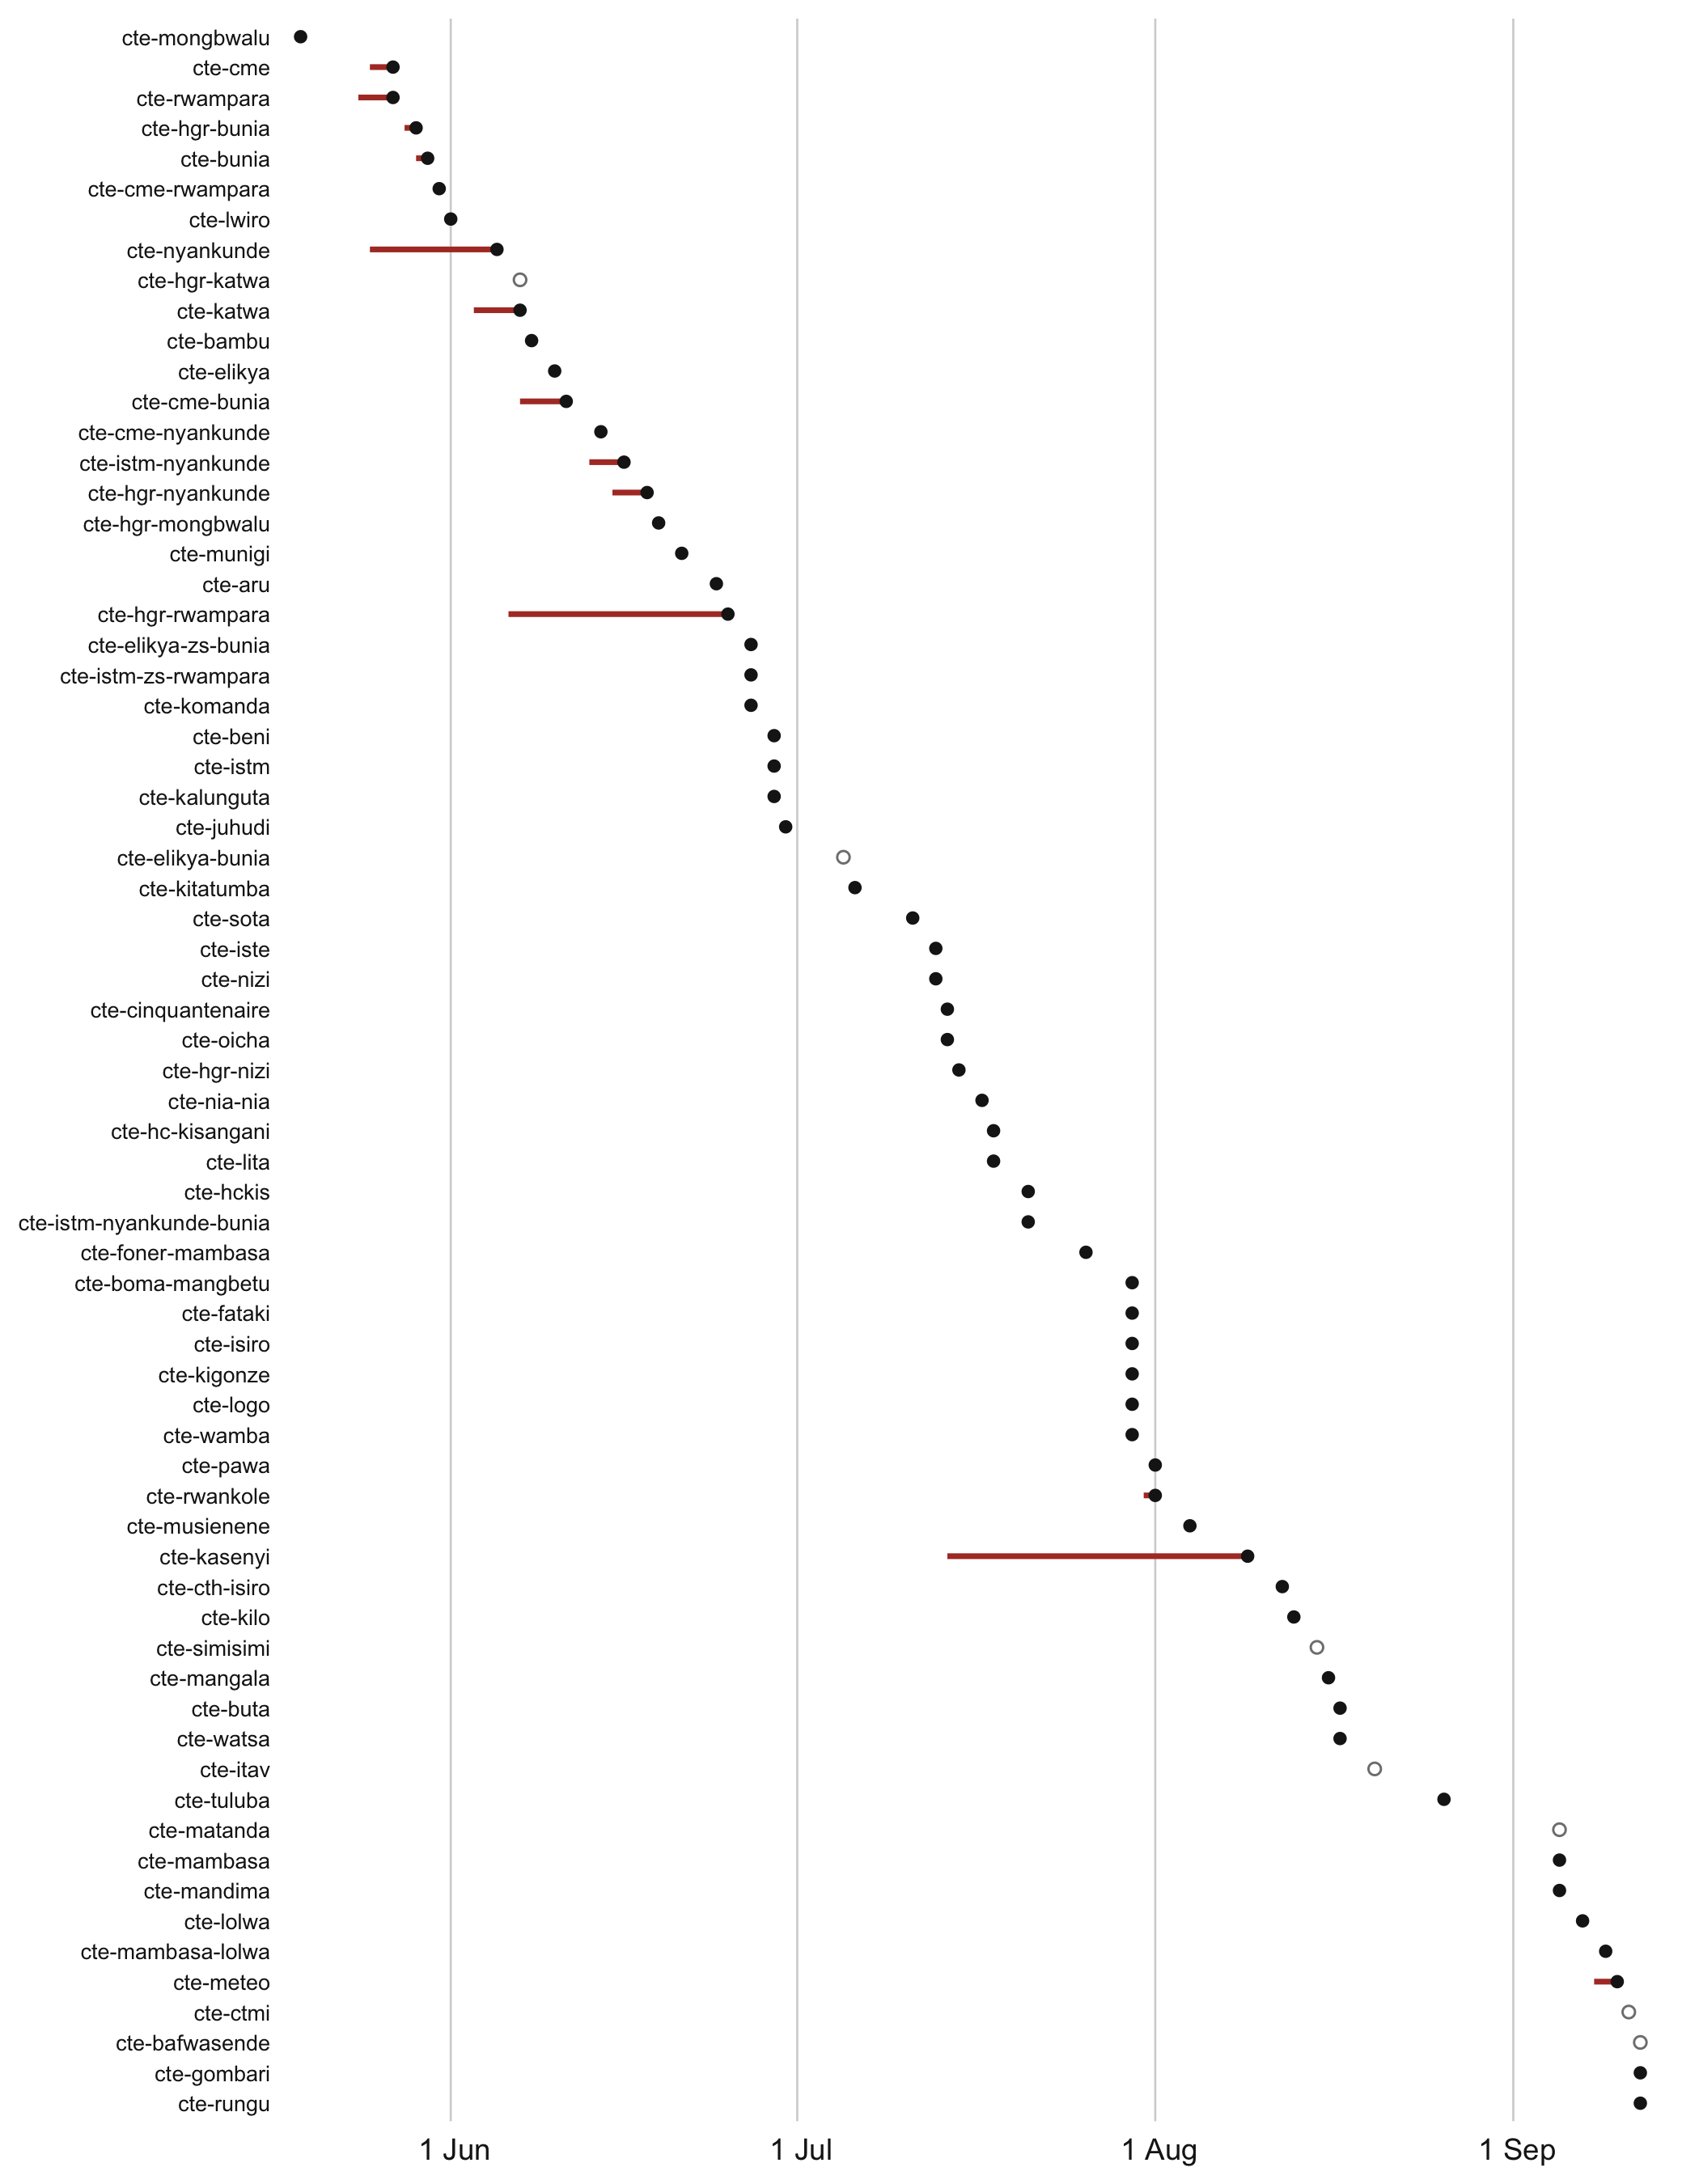
A date in these tables is the date a report said something, not the date it happened. For a model of when capacity came online, treat opened_by as an upper bound on the opening and model the delay from opening to first mention.
The capacity series
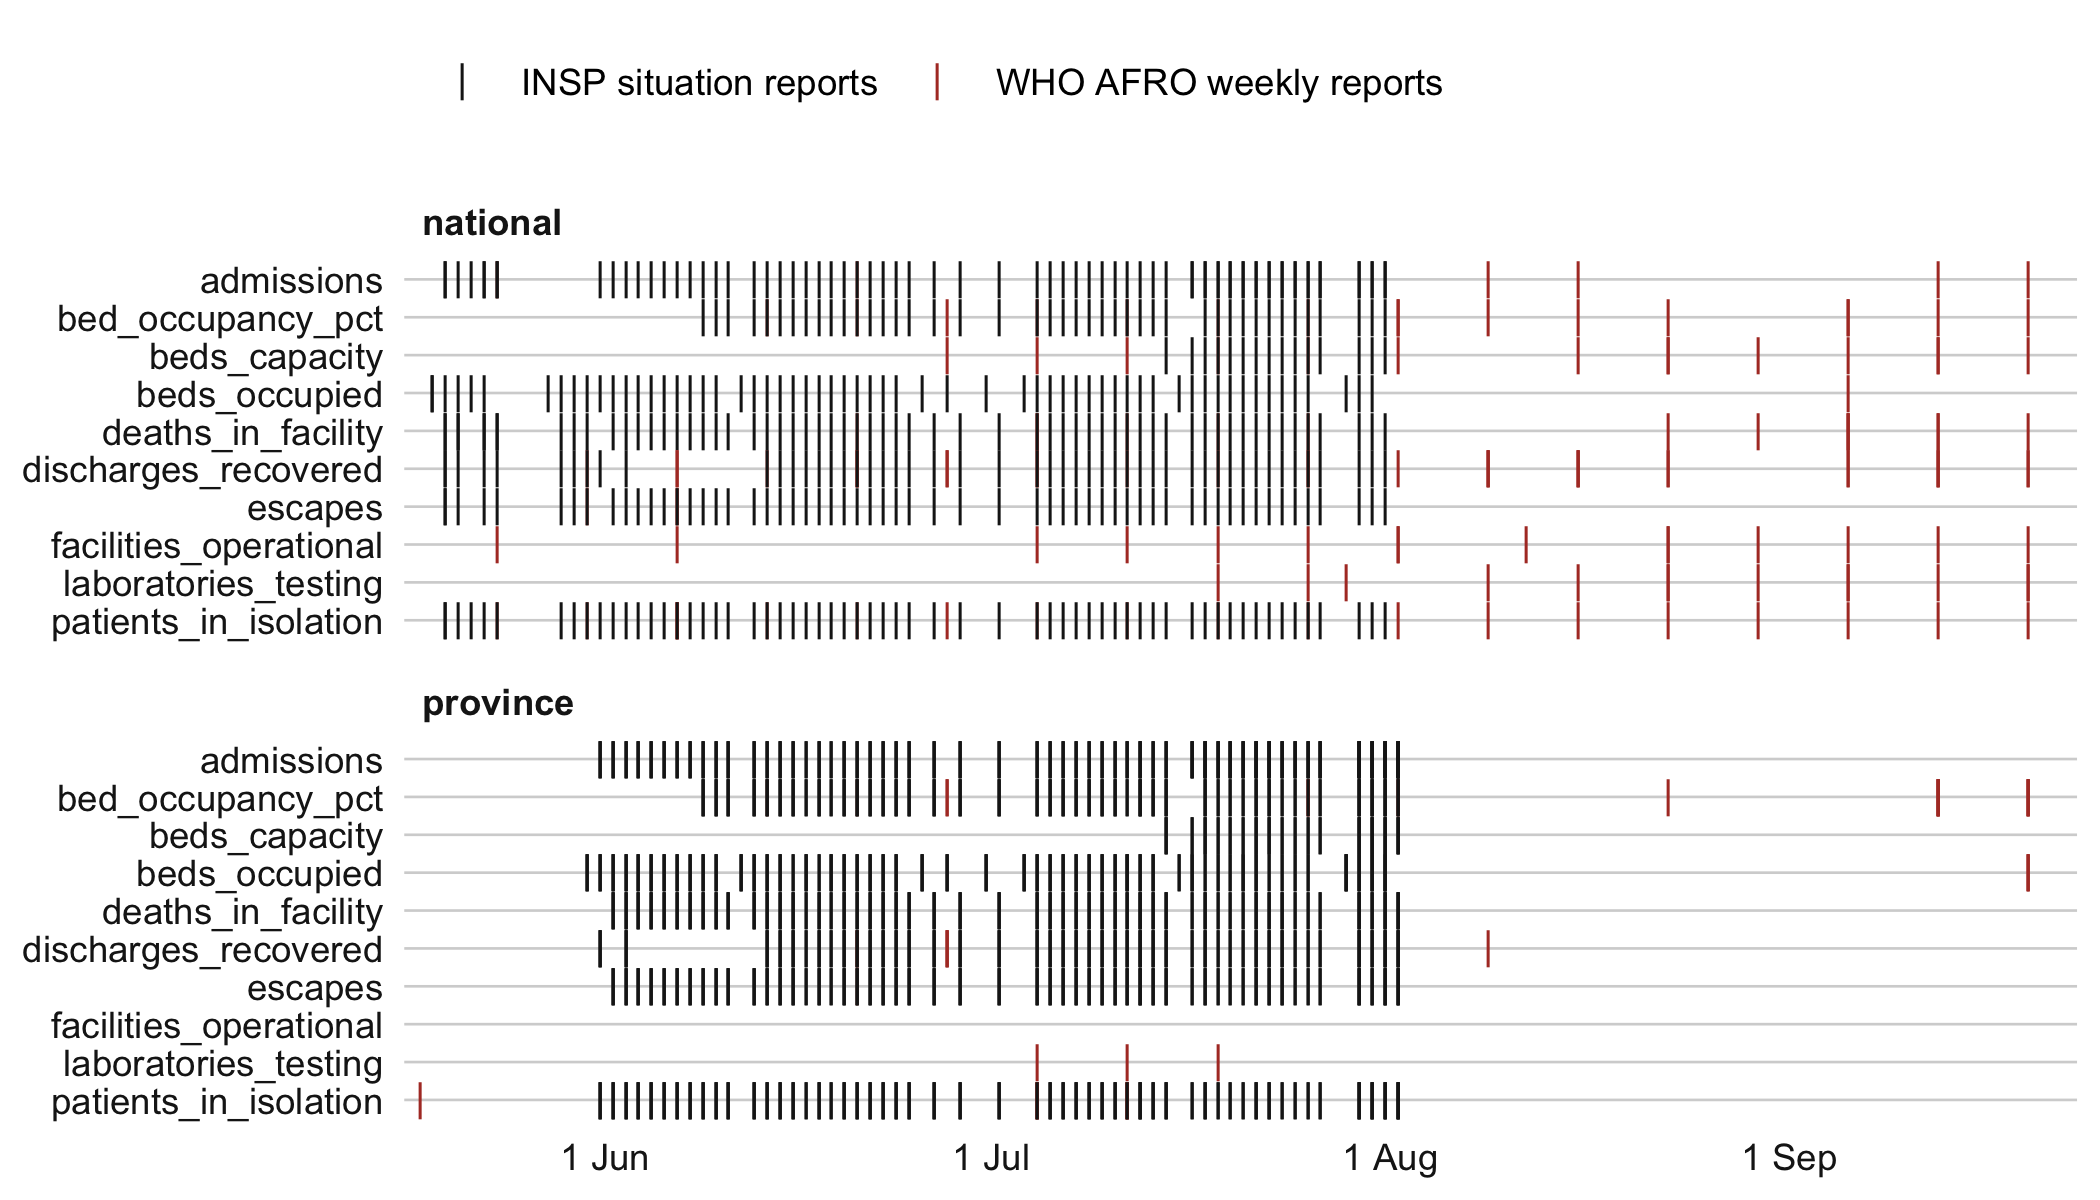
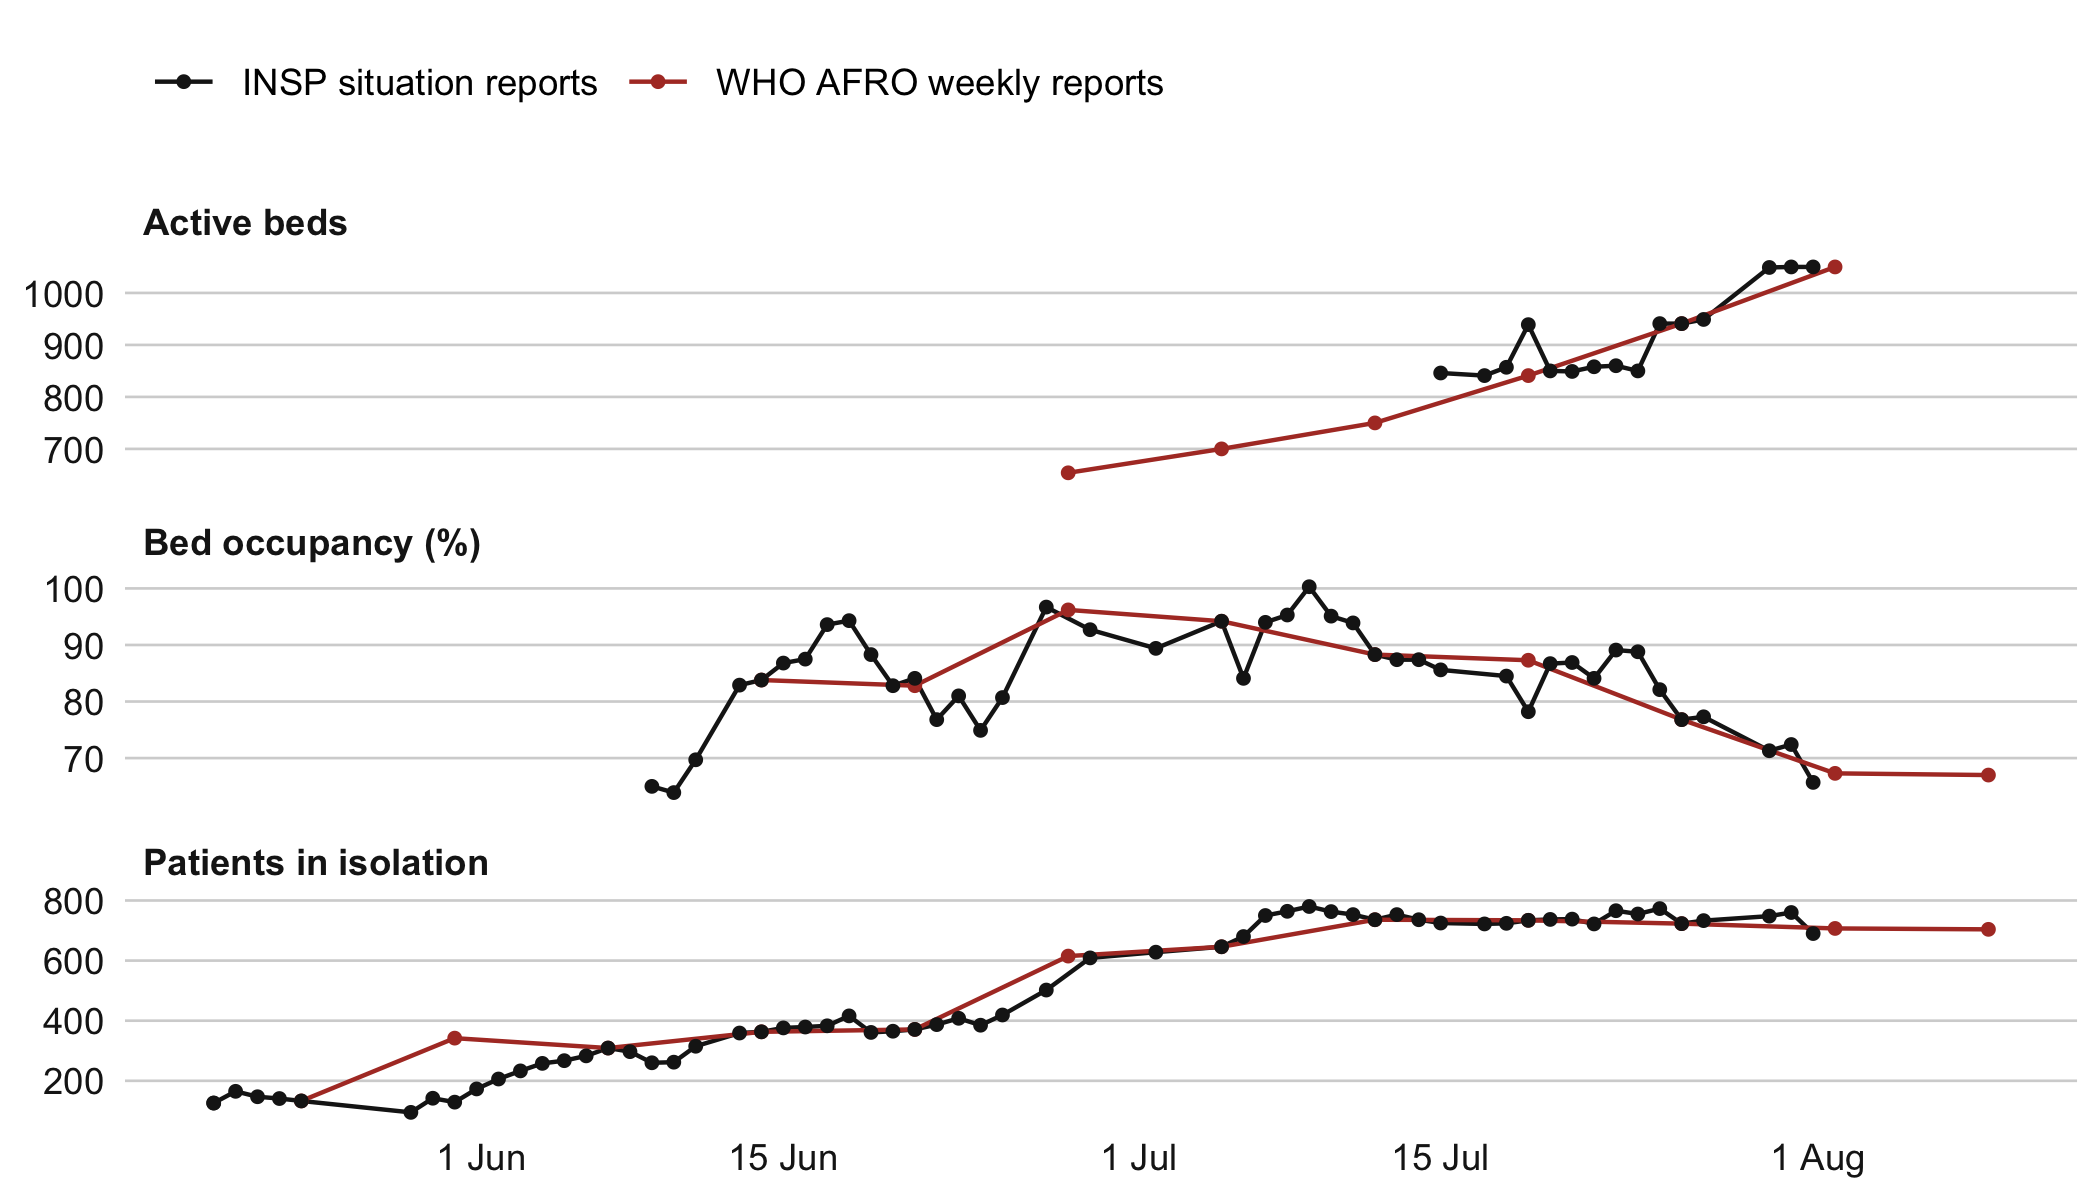
capacity_indicators.csv has a fixed vocabulary of ten indicators. The INSP situation reports carry bed tables until early August; WHO AFRO’s weekly reports carry national and province figures from late June. Where they overlap the two can be checked against each other.
When a report gives two figures
A report sometimes gives two different figures for the same indicator, place and date. Every figure stays in the table. The column preferred marks the one a series should use, chosen by these rules in order, decided by Kath Sherratt on 26 September 2026 and recorded in registry/capacity_decisions.csv:
- “Increased from A to B”: B is current; A belongs to the week before.
- Where the report states a numerator and denominator, the occupancy consistent with them is preferred over a printed percentage that contradicts them. Where no beds-occupied figure is printed, patients in isolation stands in as the numerator.
- Otherwise the headline figure box beats a narrative sentence.
| Indicator | Settled by | Figures |
|---|---|---|
| bed_occupancy_pct | 2: numerator and denominator | 4 |
| beds_capacity | 1: from A to B | 2 |
| beds_capacity | 3: headline box | 2 |
| deaths_in_facility | 1: from A to B | 2 |
| discharges_recovered | 3: headline box | 2 |
| escapes | not settled | 2 |
| facilities_operational | read by hand | 2 |
| facilities_operational | 1: from A to B | 2 |
| laboratories_testing | 1: from A to B | 6 |
| patients_in_isolation | read by hand | 3 |
A key with no preferred figure is one the rules could not settle; it is listed in checks/capacity_conflicts.csv and left out of any series.
INSP against WHO AFRO
| Indicator | Pairs | Median INSP / AFRO | Middle 80 % |
|---|---|---|---|
| admissions | 2 | 0.98 | 0.96 to 1.00 |
| bed_occupancy_pct | 41 | 1.00 | 0.90 to 1.12 |
| beds_capacity | 15 | 1.00 | 0.95 to 1.08 |
| discharges_recovered | 7 | 0.67 | 0.22 to 1.13 |
| patients_in_isolation | 59 | 1.00 | 0.68 to 1.08 |
Each INSP daily figure is paired with any WHO AFRO figure for the same indicator within three days, so part of the spread is a day’s change rather than disagreement. Stock figures (beds, occupancy, patients in isolation) agree to within a few per cent at the median. Discharges do not: WHO AFRO’s cumulative recoveries and INSP’s daily Sorties Guéris are not the same count, and should not be joined.
The close agreement is not independent confirmation. WHO AFRO’s DRC figures are most likely compiled from the same national data INSP publishes, so the two sources agree because they share an origin. What the overlap does show is that the series can be spliced: INSP to early August, WHO AFRO after, with no step at the join.
INSP against BVDOutbreakSize
| Quantity | Cells | Agree | Second read only |
|---|---|---|---|
| admissions | 150 | 150 | 0 |
| bed_occupancy_pct | 124 | 124 | 9 |
| beds_capacity | 44 | 44 | 0 |
| deaths_in_facility | 147 | 147 | 147 |
| discharges_recovered | 120 | 120 | 120 |
| patients_in_isolation | 152 | 152 | 0 |
BVDOutbreakSize reads the same INSP province tables twice, a scan and a blind read, for its treatment model. R/33_compare_bos.R joins those reads to this repository’s on SitRep and province, SitReps 018 to 080. Unlike WHO AFRO, these are separate reads of one printed table, so agreement here is a check on the reading, not on the source. “Second read only” counts cells where BVDOutbreakSize has only its blind read, for which this repository is the second. Escapes and patients in a bed have no counterpart there. The comparison records the BVDOutbreakSize commit it ran against, 126d07fb.
Before using this in a model
- Filter on
country. The WHO AFRO rows include Uganda, and 10 rows have no country. - Use
preferred. Without it a national series double-counts dates where a report printed two figures. - Occupancy above 100 % is printed by WHO AFRO for Nord-Kivu in several weeks. It is kept as printed; the reports do not say what it counts.
- Absence is not zero. A figure a report did not print is missing, never 0.
- Facility counts are an upper bound until the open naming questions are settled.
- Facility bed counts are sparse: 25 facilities have one, because the INSP facility bed table stops after SitRep
- 291 events describe a site without a usable name. They are in
facility_events.csvwith an emptyfacility_idand absent from every per-facility table.
Sources and citation
Institut National de Santé Publique, DRC (2026), situation reports on the 17th Ebola virus disease epidemic, https://insp.cd/ebola-17eme-epidemie/, via the corpus in bvd-sitreps. WHO Regional Office for Africa weekly situation reports, CC BY-NC-SA 3.0 IGO. GRID3 COD Health Facilities v8.0, CC BY 4.0, doi:10.7916/f1ft-y872.
Cite the report a figure came from. If you relied on the facility identities or opening intervals, also cite bvd-capacity.