Overview of LTLA- and UTLA-Trust COVID-19 mappings
Sophie Meakin
Source:vignettes/mapping_summary.Rmd
mapping_summary.RmdSummary
The covid19.nhs.data package contains four many-to-many (overlapping) mappings between local authority districts (upper- and lower-tier) and NHS Acute Trusts in England. Each mapping contains the following variables:
-
geo_code: A 9-digit identifier for local authorities (UTLA or LTLA) in England. -
trust_code: A 3-digit organisation code for NHS Trusts. -
p_geo: The proportion of all admissions from a given local authority (LTLA or UTLA) that were admitted to a given Trust, estimated from one of two datasets (see below). -
p_trust: The proportion of all admissions to a given Trust that were admitted from a given local authority (LTLA or UTLA), estimated from one of two datasets (see below).
These mappings are probabilistic estimates based on Secondary Uses Service (SUS) healthcare data for England (January - September 2020, inclusive), and linked COVID-19 cases and admissions (June 2020 - May 2021, inclusive). Please see the vignette “Creating the public mappings” for details of how the mappings are made.
These mappings can be used to estimate COVID-19 hospital admissions at the local authority level, or to estimate “relevant” community COVID-19 cases for an NHS Trust. These are estimates only and may not accurately reflect the truth; see limitations below.
Usage
Get started
Install the package from GitHub:
devtools::install_github("epiforecasts/covid19.nhs.data")and load the library:
Access the mappings
Access the mappings with load_mapping(), specifying the geographical scale (“ltla” or “utla”) and the data source (“sus” or “link”):
load_mapping(scale = "ltla", source = "link") %>%
  head() %>%
  kable() %>%
kable_styling()| geo_code | trust_code | n | p_geo | p_trust |
|---|---|---|---|---|
| E06000001 | R0A | 15 | 0.0275229 | 0.0015084 |
| E06000001 | RVW | 392 | 0.7192661 | 0.3576642 |
| E06000001 | RXF | 138 | 0.2532110 | 0.0158548 |
| E06000002 | RTR | 322 | 0.6694387 | 0.4593438 |
| E06000002 | RVW | 42 | 0.0873181 | 0.0383212 |
| E06000002 | RXF | 117 | 0.2432432 | 0.0134421 |
Add Trust names and local authority names to the raw mapping with get_names():
load_mapping(scale = "ltla", source = "link") %>%
  get_names(geo_names = ltla_names) %>%
  head() %>%
  kable() %>%
kable_styling()| trust_code | trust_name | geo_code | geo_name | p_trust | p_geo |
|---|---|---|---|---|---|
| R0A | Manchester University NHS Foundation Trust | E06000001 | Hartlepool | 0.0015084 | 0.0275229 |
| RVW | North Tees And Hartlepool NHS Foundation Trust | E06000001 | Hartlepool | 0.3576642 | 0.7192661 |
| RXF | Mid Yorkshire Hospitals NHS Trust | E06000001 | Hartlepool | 0.0158548 | 0.2532110 |
| RTR | South Tees Hospitals NHS Foundation Trust | E06000002 | Middlesbrough | 0.4593438 | 0.6694387 |
| RVW | North Tees And Hartlepool NHS Foundation Trust | E06000002 | Middlesbrough | 0.0383212 | 0.0873181 |
| RXF | Mid Yorkshire Hospitals NHS Trust | E06000002 | Middlesbrough | 0.0134421 | 0.2432432 |
Summarise the mapping with summarise_mapping(). For an NHS Trust (specified by the argument trust), this will return a table and a visualisation, both describing p_trust:
mapping <- load_mapping(scale = "ltla", source = "link")
summary <- summarise_mapping(trust = "RYR",
                             mapping = mapping,
                             shapefile = england_ltla_shape,
                             geo_names = ltla_names)

summary$summary_table %>%
  kable() %>%
kable_styling()| trust_code | trust_name | geo_code | geo_name | p_trust |
|---|---|---|---|---|
| RYR | Western Sussex Hospitals NHS Foundation Trust | E07000224 | Arun | 0.3718887 |
| RYR | Western Sussex Hospitals NHS Foundation Trust | E07000229 | Worthing | 0.2020498 |
| RYR | Western Sussex Hospitals NHS Foundation Trust | E07000225 | Chichester | 0.1991215 |
| RYR | Western Sussex Hospitals NHS Foundation Trust | E07000223 | Adur | 0.1185944 |
| RYR | Western Sussex Hospitals NHS Foundation Trust | E07000227 | Horsham | 0.0805271 |
| RYR | Western Sussex Hospitals NHS Foundation Trust | E06000043 | Brighton and Hove | 0.0278184 |
summary$summary_plot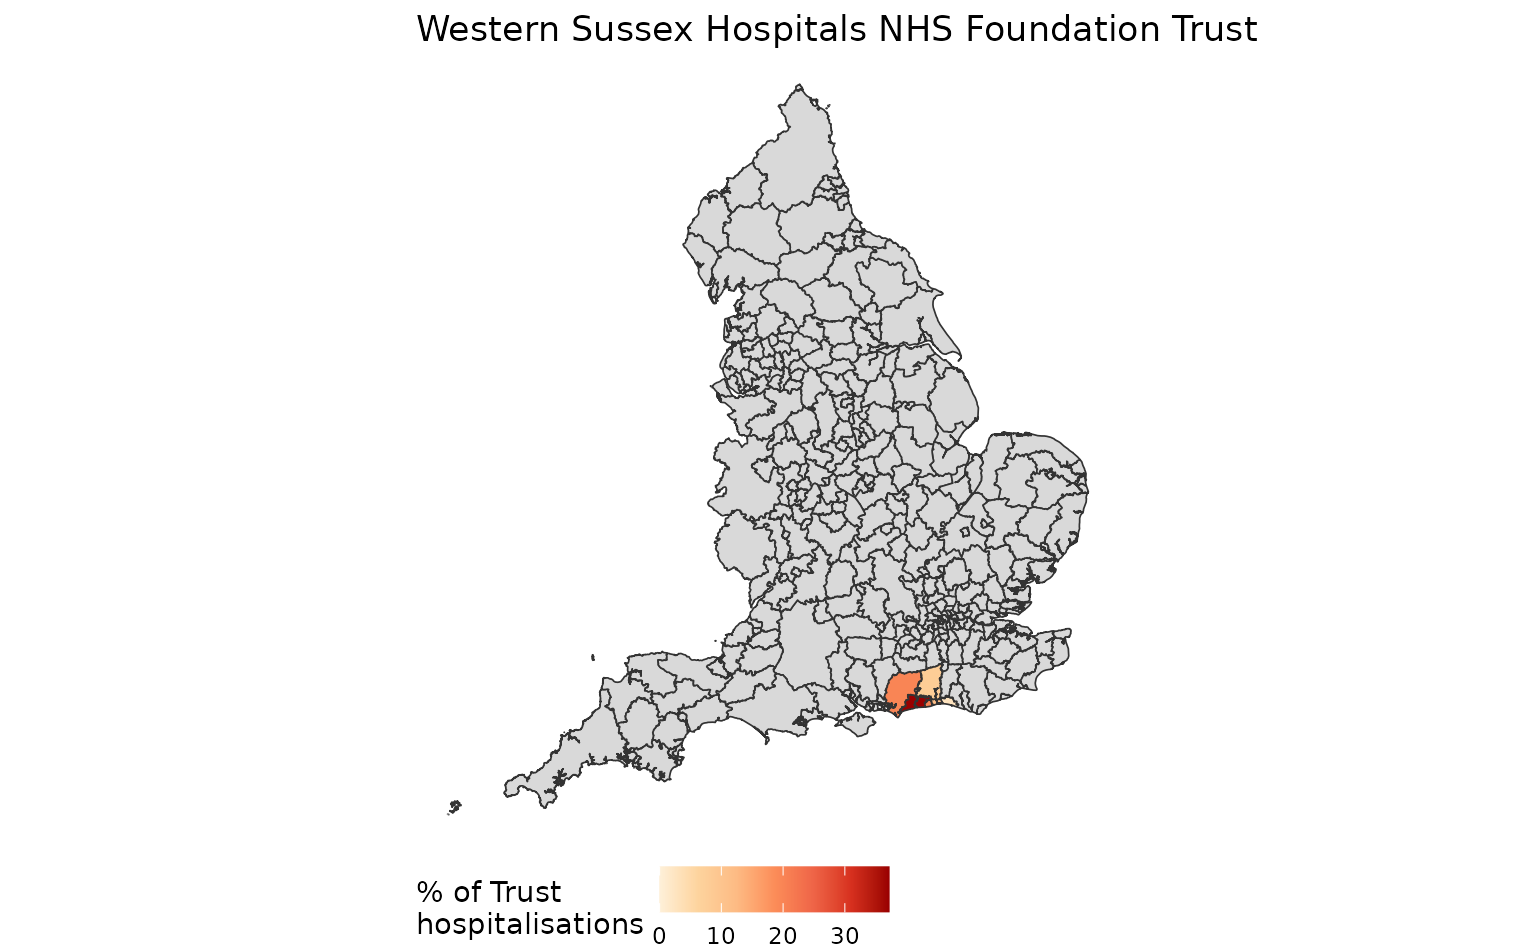
For a local authority (specified by the argument geography), this will return a table describing p_trust:
summary <- summarise_mapping(geography = "E09000012",
                             mapping = mapping,
                             shapefile = england_ltla_shape,
                             geo_names = ltla_names)

summary$summary_table %>%
  kable() %>%
kable_styling()| geo_code | geo_name | trust_code | trust_name | p_geo |
|---|---|---|---|---|
| E09000012 | Hackney | RQX | Homerton University Hospital NHS Foundation Trust | 0.4957699 |
| E09000012 | Hackney | R1H | Barts Health NHS Trust | 0.2233503 |
| E09000012 | Hackney | RAJ | Mid And South Essex NHS Foundation Trust | 0.1336717 |
| E09000012 | Hackney | RWE | University Hospitals Of Leicester NHS Trust | 0.0490694 |
| E09000012 | Hackney | RKE | Whittington Health NHS Trust | 0.0439932 |
| E09000012 | Hackney | RXF | Mid Yorkshire Hospitals NHS Trust | 0.0355330 |
| E09000012 | Hackney | RRV | University College London Hospitals NHS Foundation Trust | 0.0186125 |