Summary dashboard
A one-page overview of the headline results for readers with limited time. Every number, table and figure on this page is produced by the same model fit as the full Analysis and refreshes whenever the data updates. See the Analysis page for the methods, assumptions and supporting detail behind each result, and the Sensitivity page for the forecast validation, the outbreak size implied by each data stream, the comparisons with McCabe et al. and Chamla et al., and the delay and tree-prior sensitivity analyses.
Data as of: 2026-07-08
Headline estimates
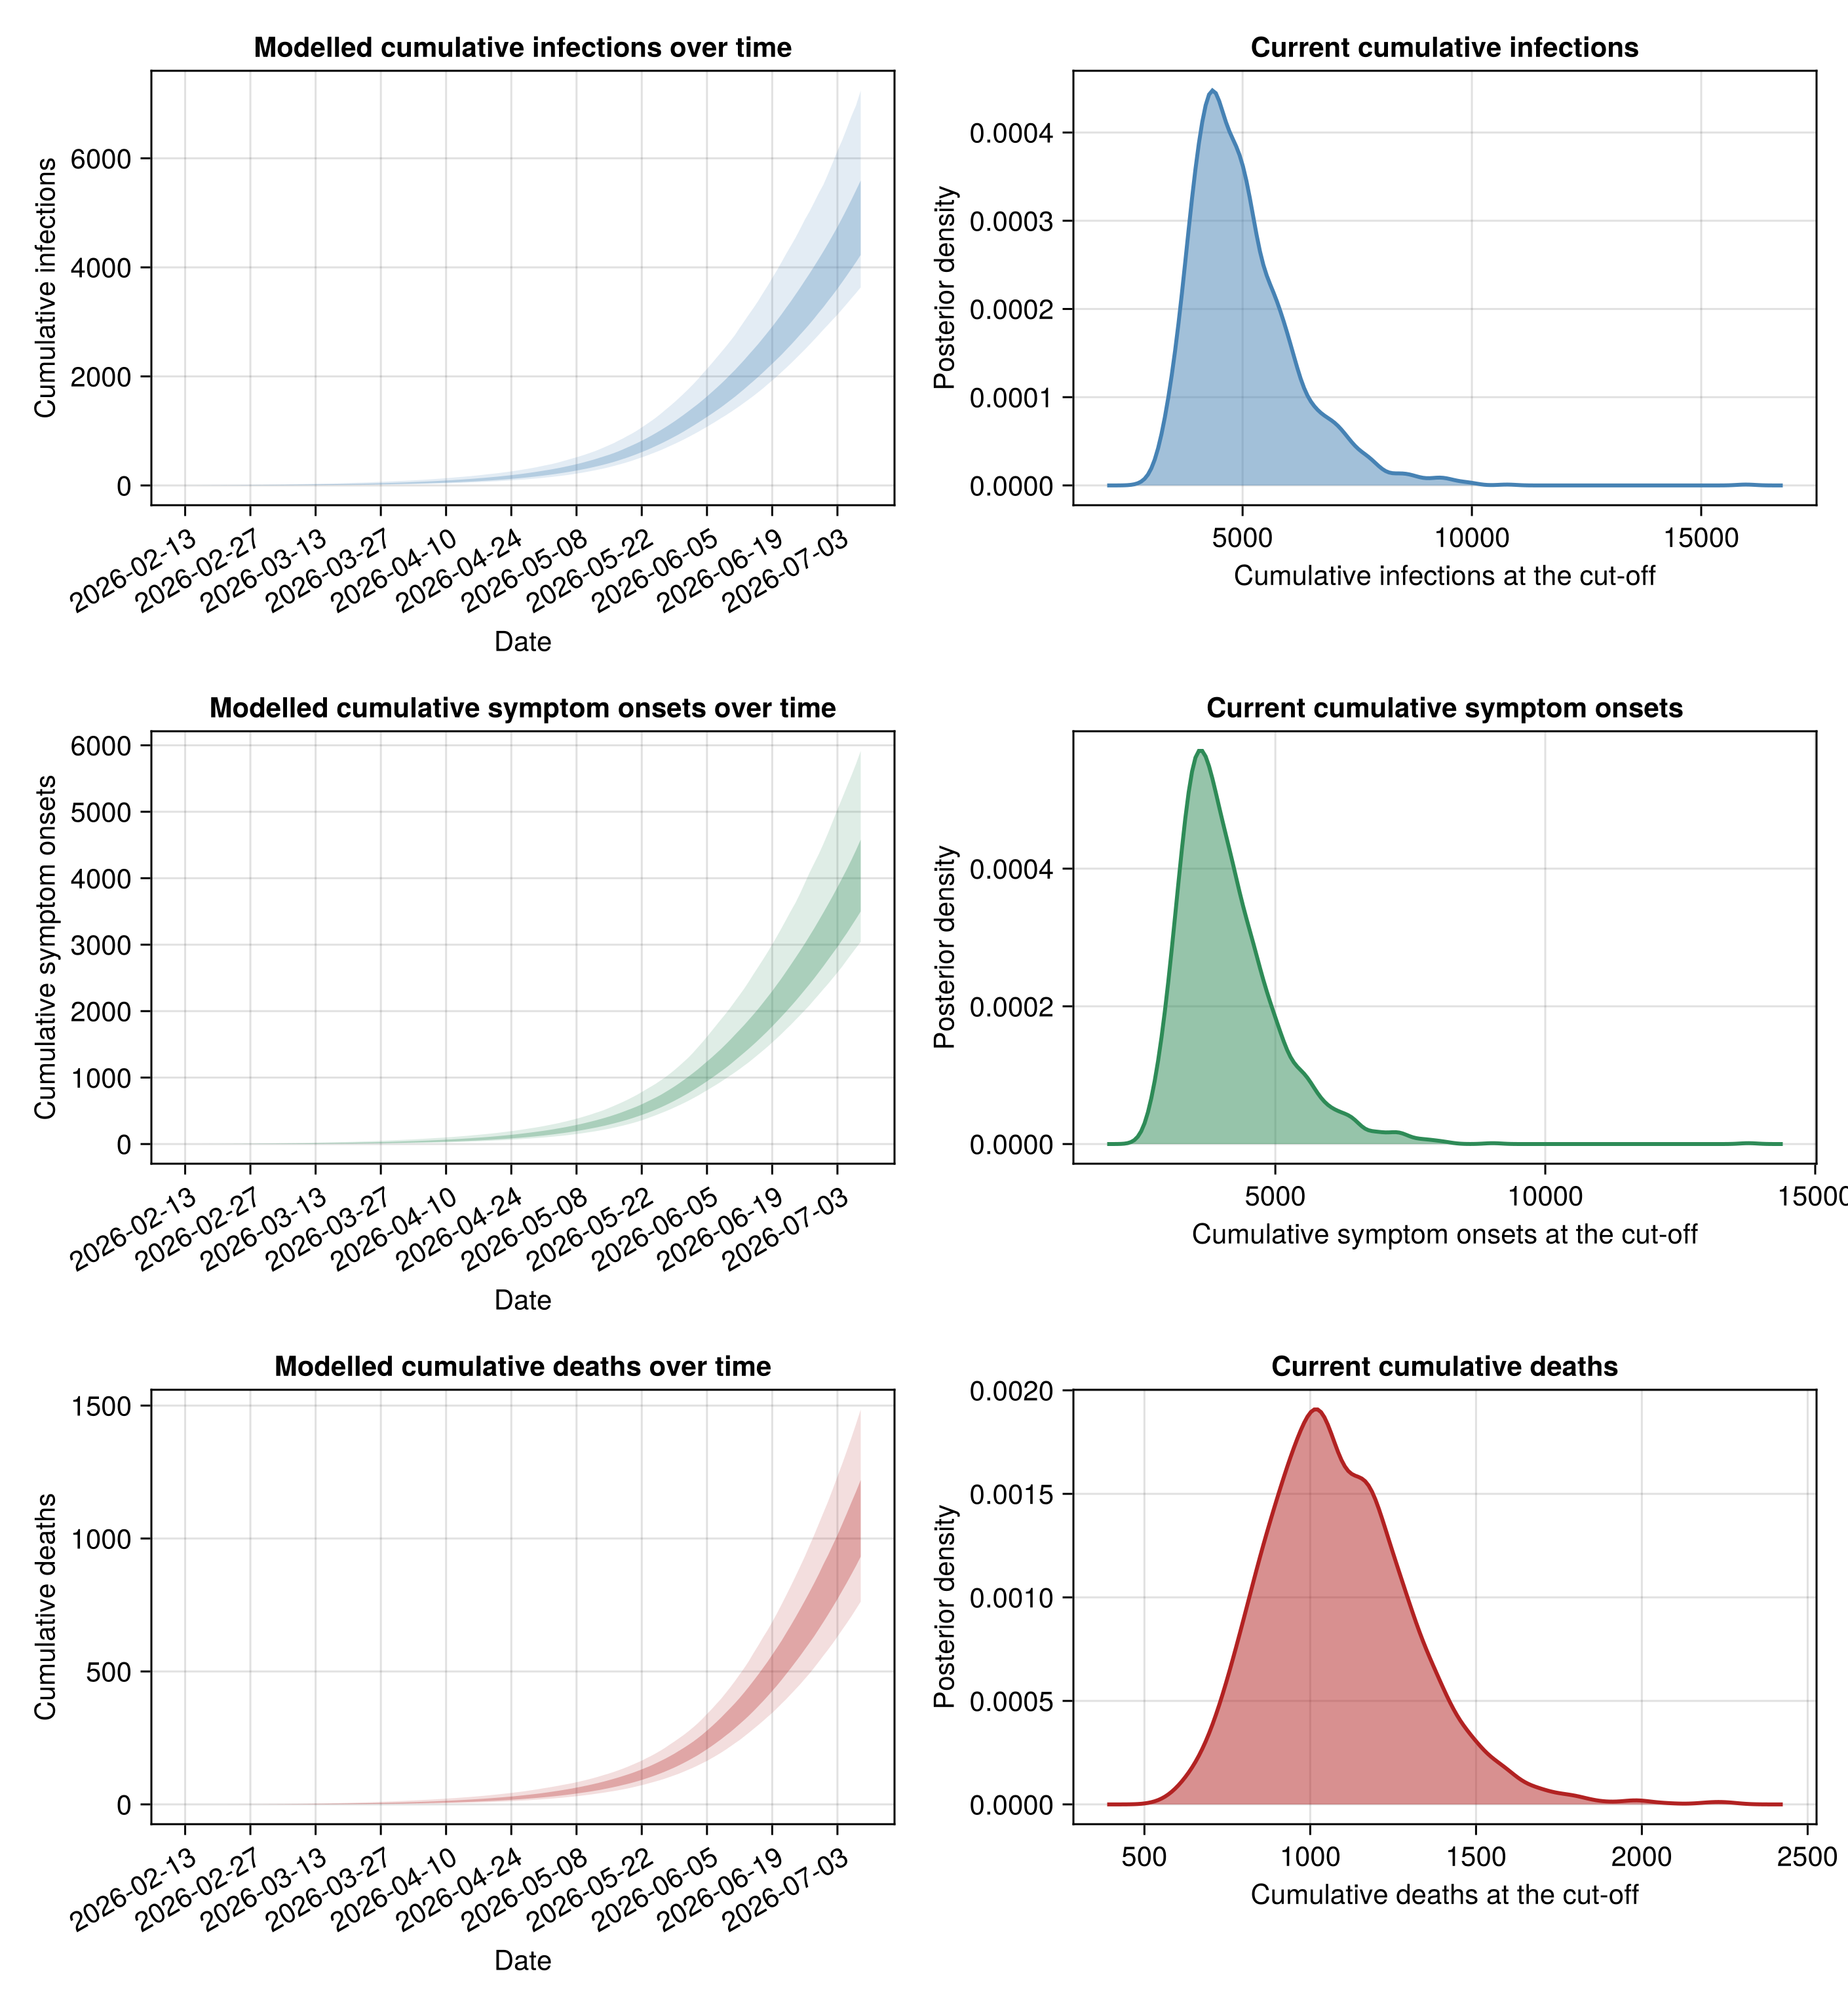
Cumulative infections: the outbreak is estimated to have caused 30% 4423–5186, 60% 4104–5828, 90% 3633–7244 infections to date, reported and unreported.
Against the 1792 laboratory-confirmed cases by the cut-off that is roughly 2.0–4.0× as many infections, so confirmed cases are estimated to capture only a small share of the outbreak.
Outbreak start and age: the outbreak is estimated to have begun on a start date of 30% 2026-03-14–2026-03-20, 60% 2026-03-09–2026-03-23, 90% 2026-02-27–2026-03-27, an elapsed age to the cut-off of 30% 110–116, 60% 107–121, 90% 103–131 days.
Growth rate and doubling time: the initial growth rate is estimated to have been 30% 0.054–0.063, 60% 0.049–0.069, 90% 0.041–0.08 per day, an initial doubling time of 30% 11.0–12.8, 60% 10.0–14.2, 90% 8.6–17.0 days. The latest growth rate is estimated to be 30% 0.02–0.03, 60% 0.013–0.034, 90% -0.003–0.049 per day, a latest doubling time of 30% 22.2–30.7, 60% 18.3–42.5, 90% -36.7–120.4 days.
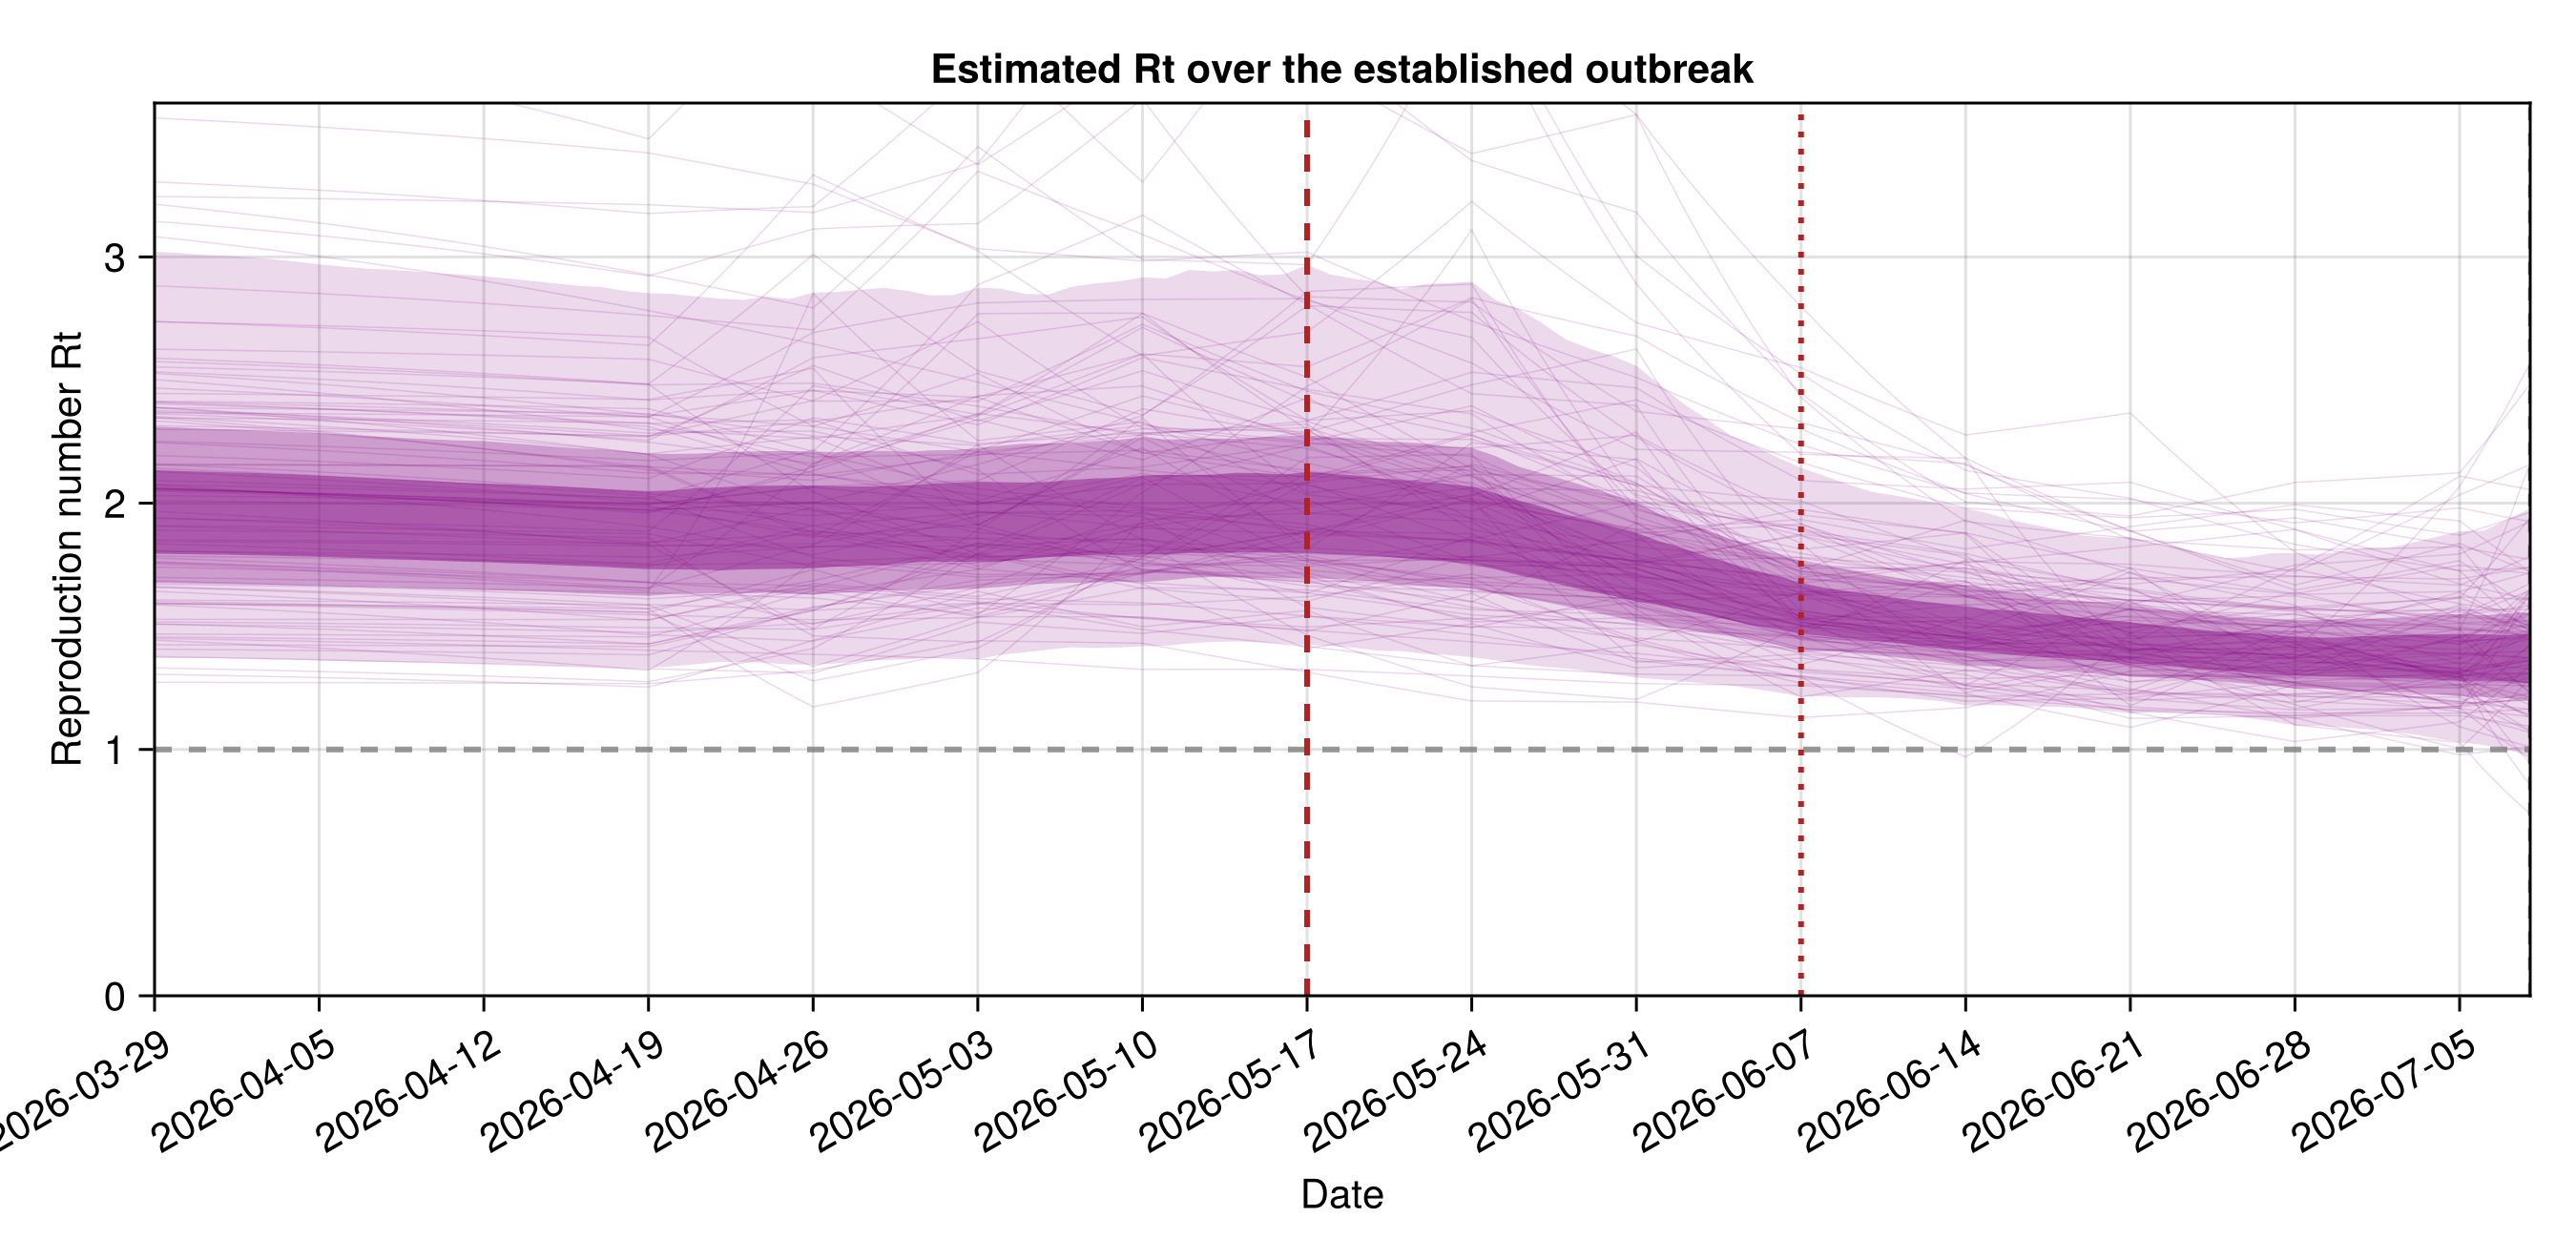
Reproduction number: the initial reproduction number is estimated to have been 30% 1.84–2.2, 60% 1.66–2.5, 90% 1.39–3.16 and the latest to be 30% 1.27–1.47, 60% 1.16–1.62, 90% 0.97–1.98.
Case-fatality ratio: the case-fatality ratio is estimated to be 30% 0.42–0.47, 60% 0.39–0.51, 90% 0.33–0.57.
Shift from priors: how far the data has moved each estimate from its prior, in prior interquartile ranges, where a value of one means the posterior median sits one prior interquartile range from the prior median, zero means unchanged, and the sign gives the direction. The fit moves the cumulative infection count by -0.13, the outbreak age by -0.71 and the doubling time by 0.65; the largest move is in the outbreak age.
Outbreak size and timing
| Quantity | Lower 90% | Lower 60% | Lower 30% | Upper 30% | Upper 60% | Upper 90% |
|---|---|---|---|---|---|---|
| Cumulative infections | 3633 | 4104 | 4423 | 5186 | 5828 | 7244 |
| Outbreak age (days) | 103 | 107 | 110 | 116 | 121 | 131 |
Growth and severity
| Quantity | Lower 90% | Lower 60% | Lower 30% | Upper 30% | Upper 60% | Upper 90% |
|---|---|---|---|---|---|---|
| Initial reproduction number | 1.39 | 1.66 | 1.84 | 2.2 | 2.5 | 3.16 |
| Latest reproduction number | 0.97 | 1.16 | 1.27 | 1.47 | 1.62 | 1.98 |
| Latest growth rate (per day) | 0 | 0.01 | 0.02 | 0.03 | 0.03 | 0.05 |
| Latest doubling time (days) | -36.66 | 18.28 | 22.18 | 30.65 | 42.51 | 120.43 |
| Case-fatality ratio | 0.33 | 0.39 | 0.42 | 0.47 | 0.51 | 0.57 |
All intervals are equal-tailed 30%, 60% and 90% credible intervals from the joint posterior.
Estimated reproduction number
The time-varying reproduction number R(t), the average number of further infections caused by each infection. A value above one means the outbreak is growing.
Infections over time
Modelled cumulative infections, symptom onsets and deaths. These are the underlying outbreak, upstream of the testing and reporting that produce the observed counts, so they are larger than the reported cases.
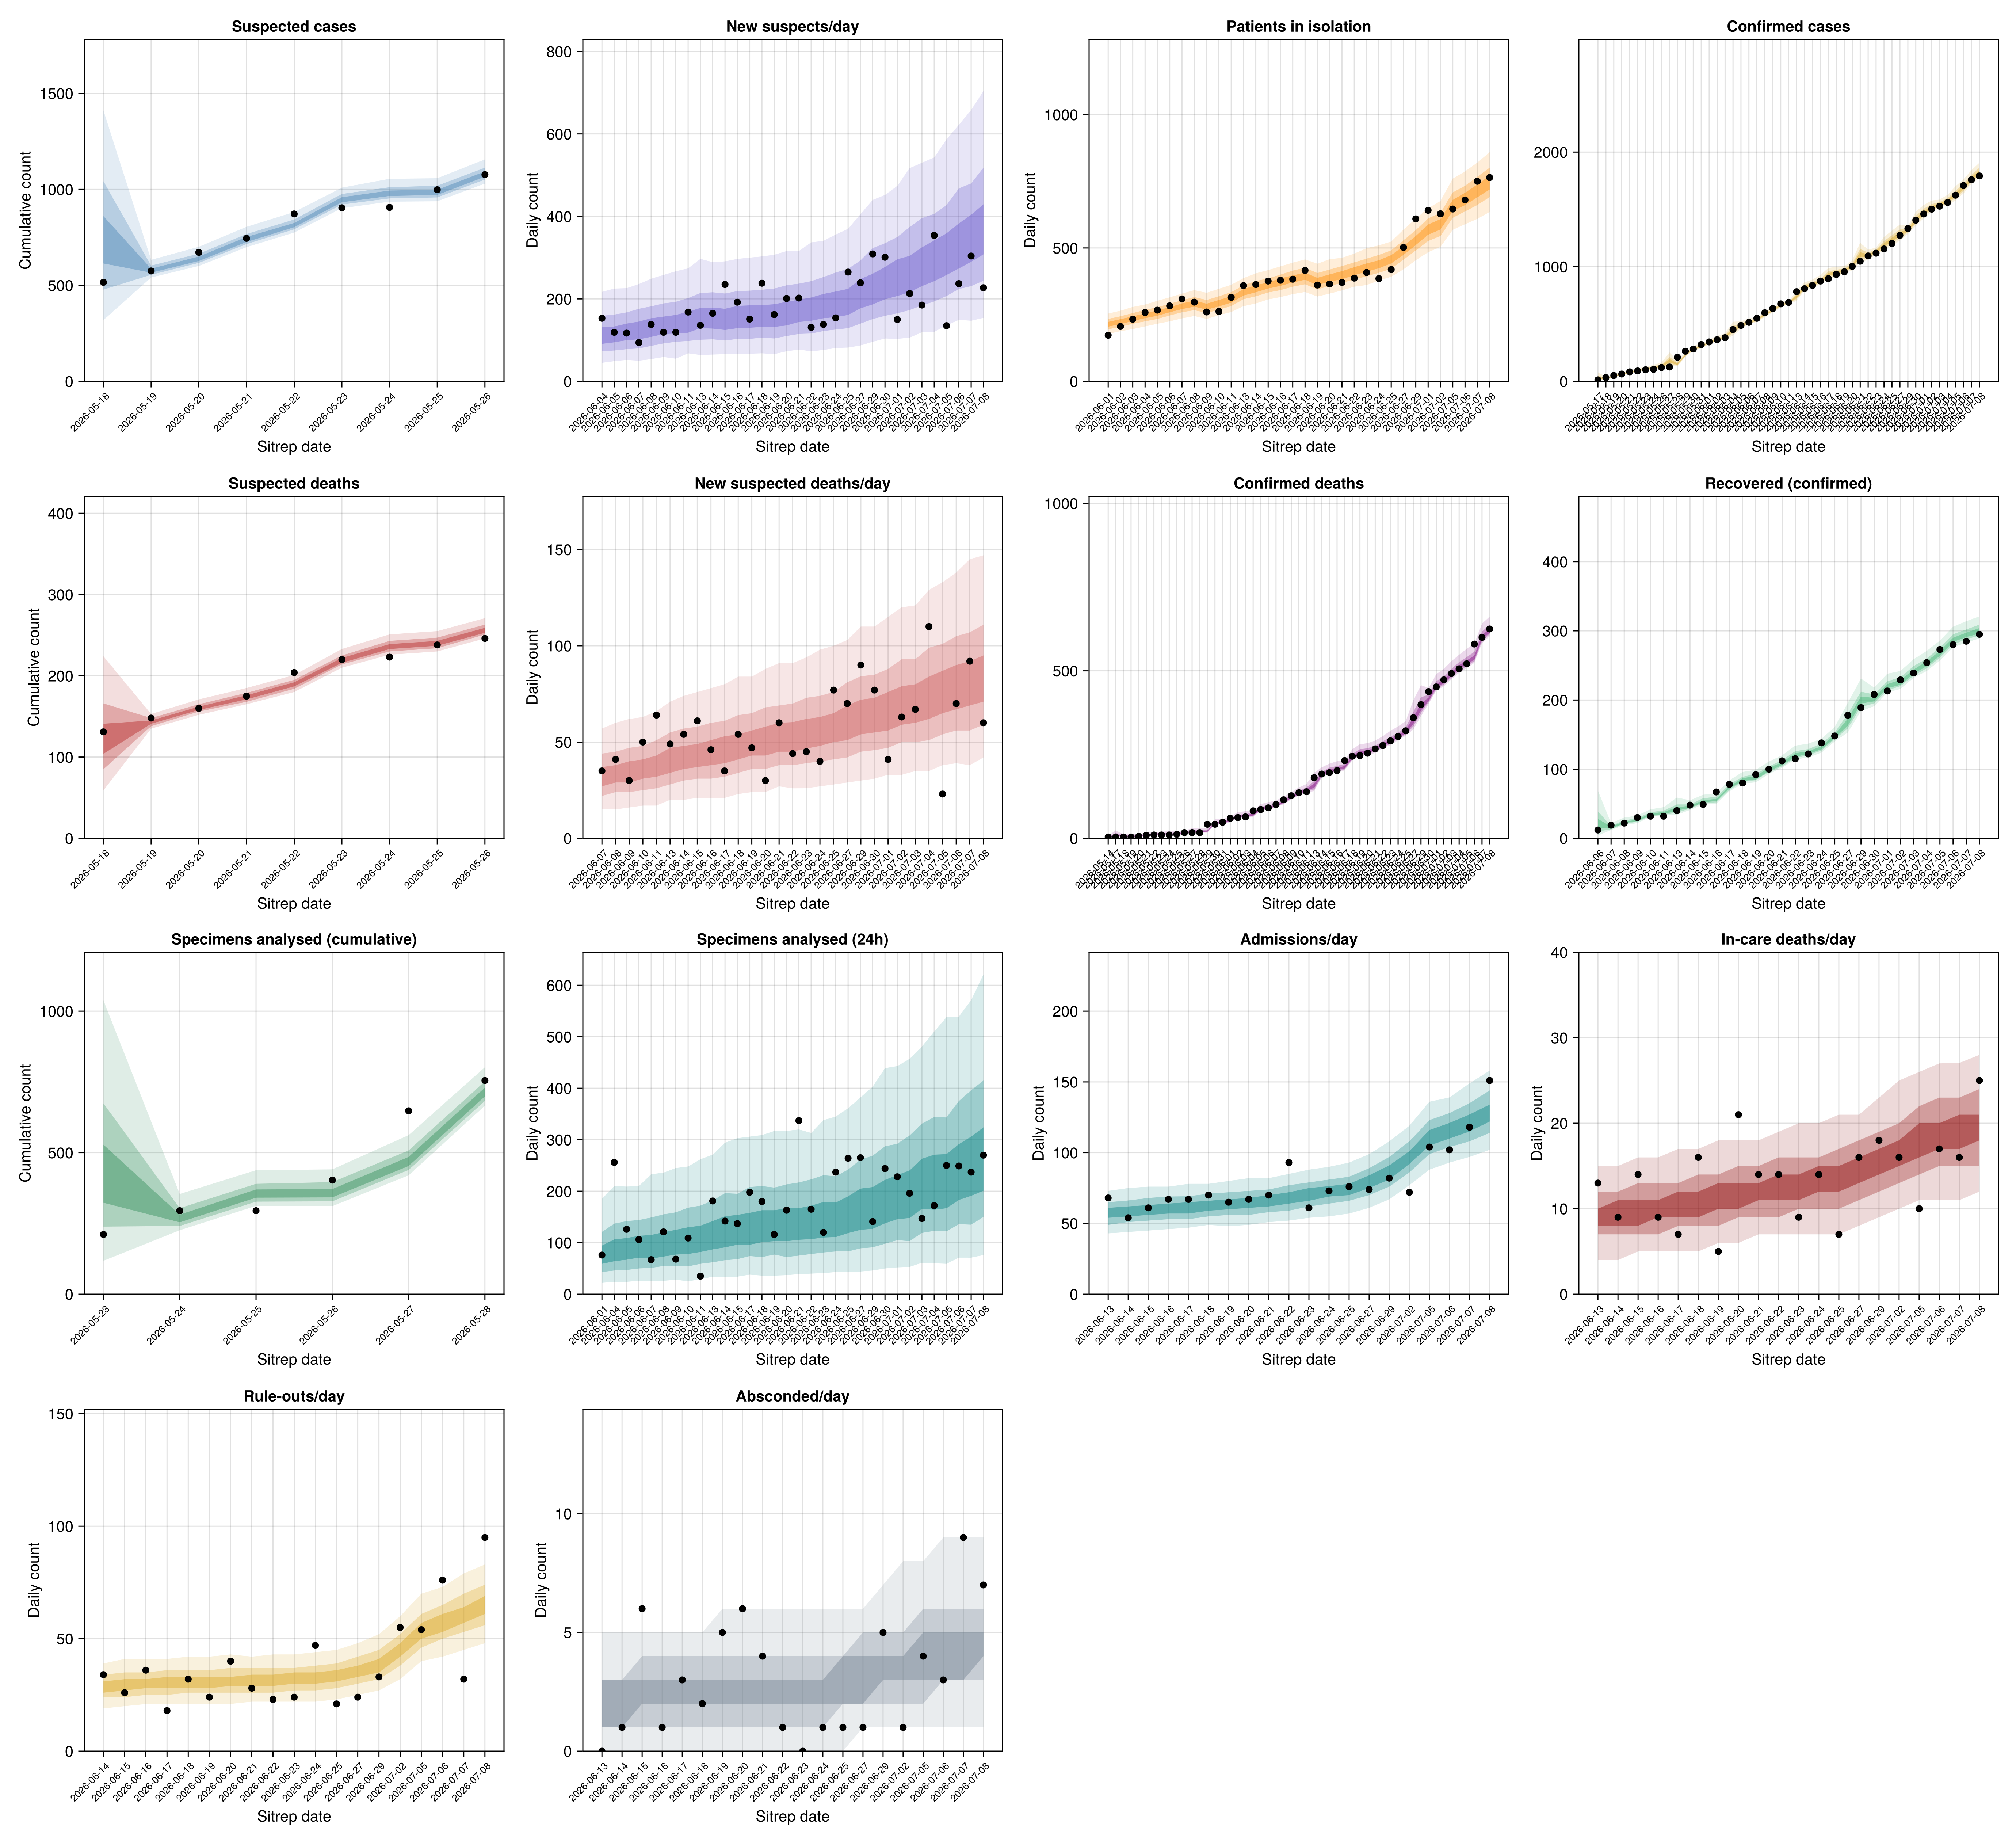
Reported cases: model versus observed
Modelled reported cases against the observed reported cases over time, a check that the fit reproduces what was seen on the ground.
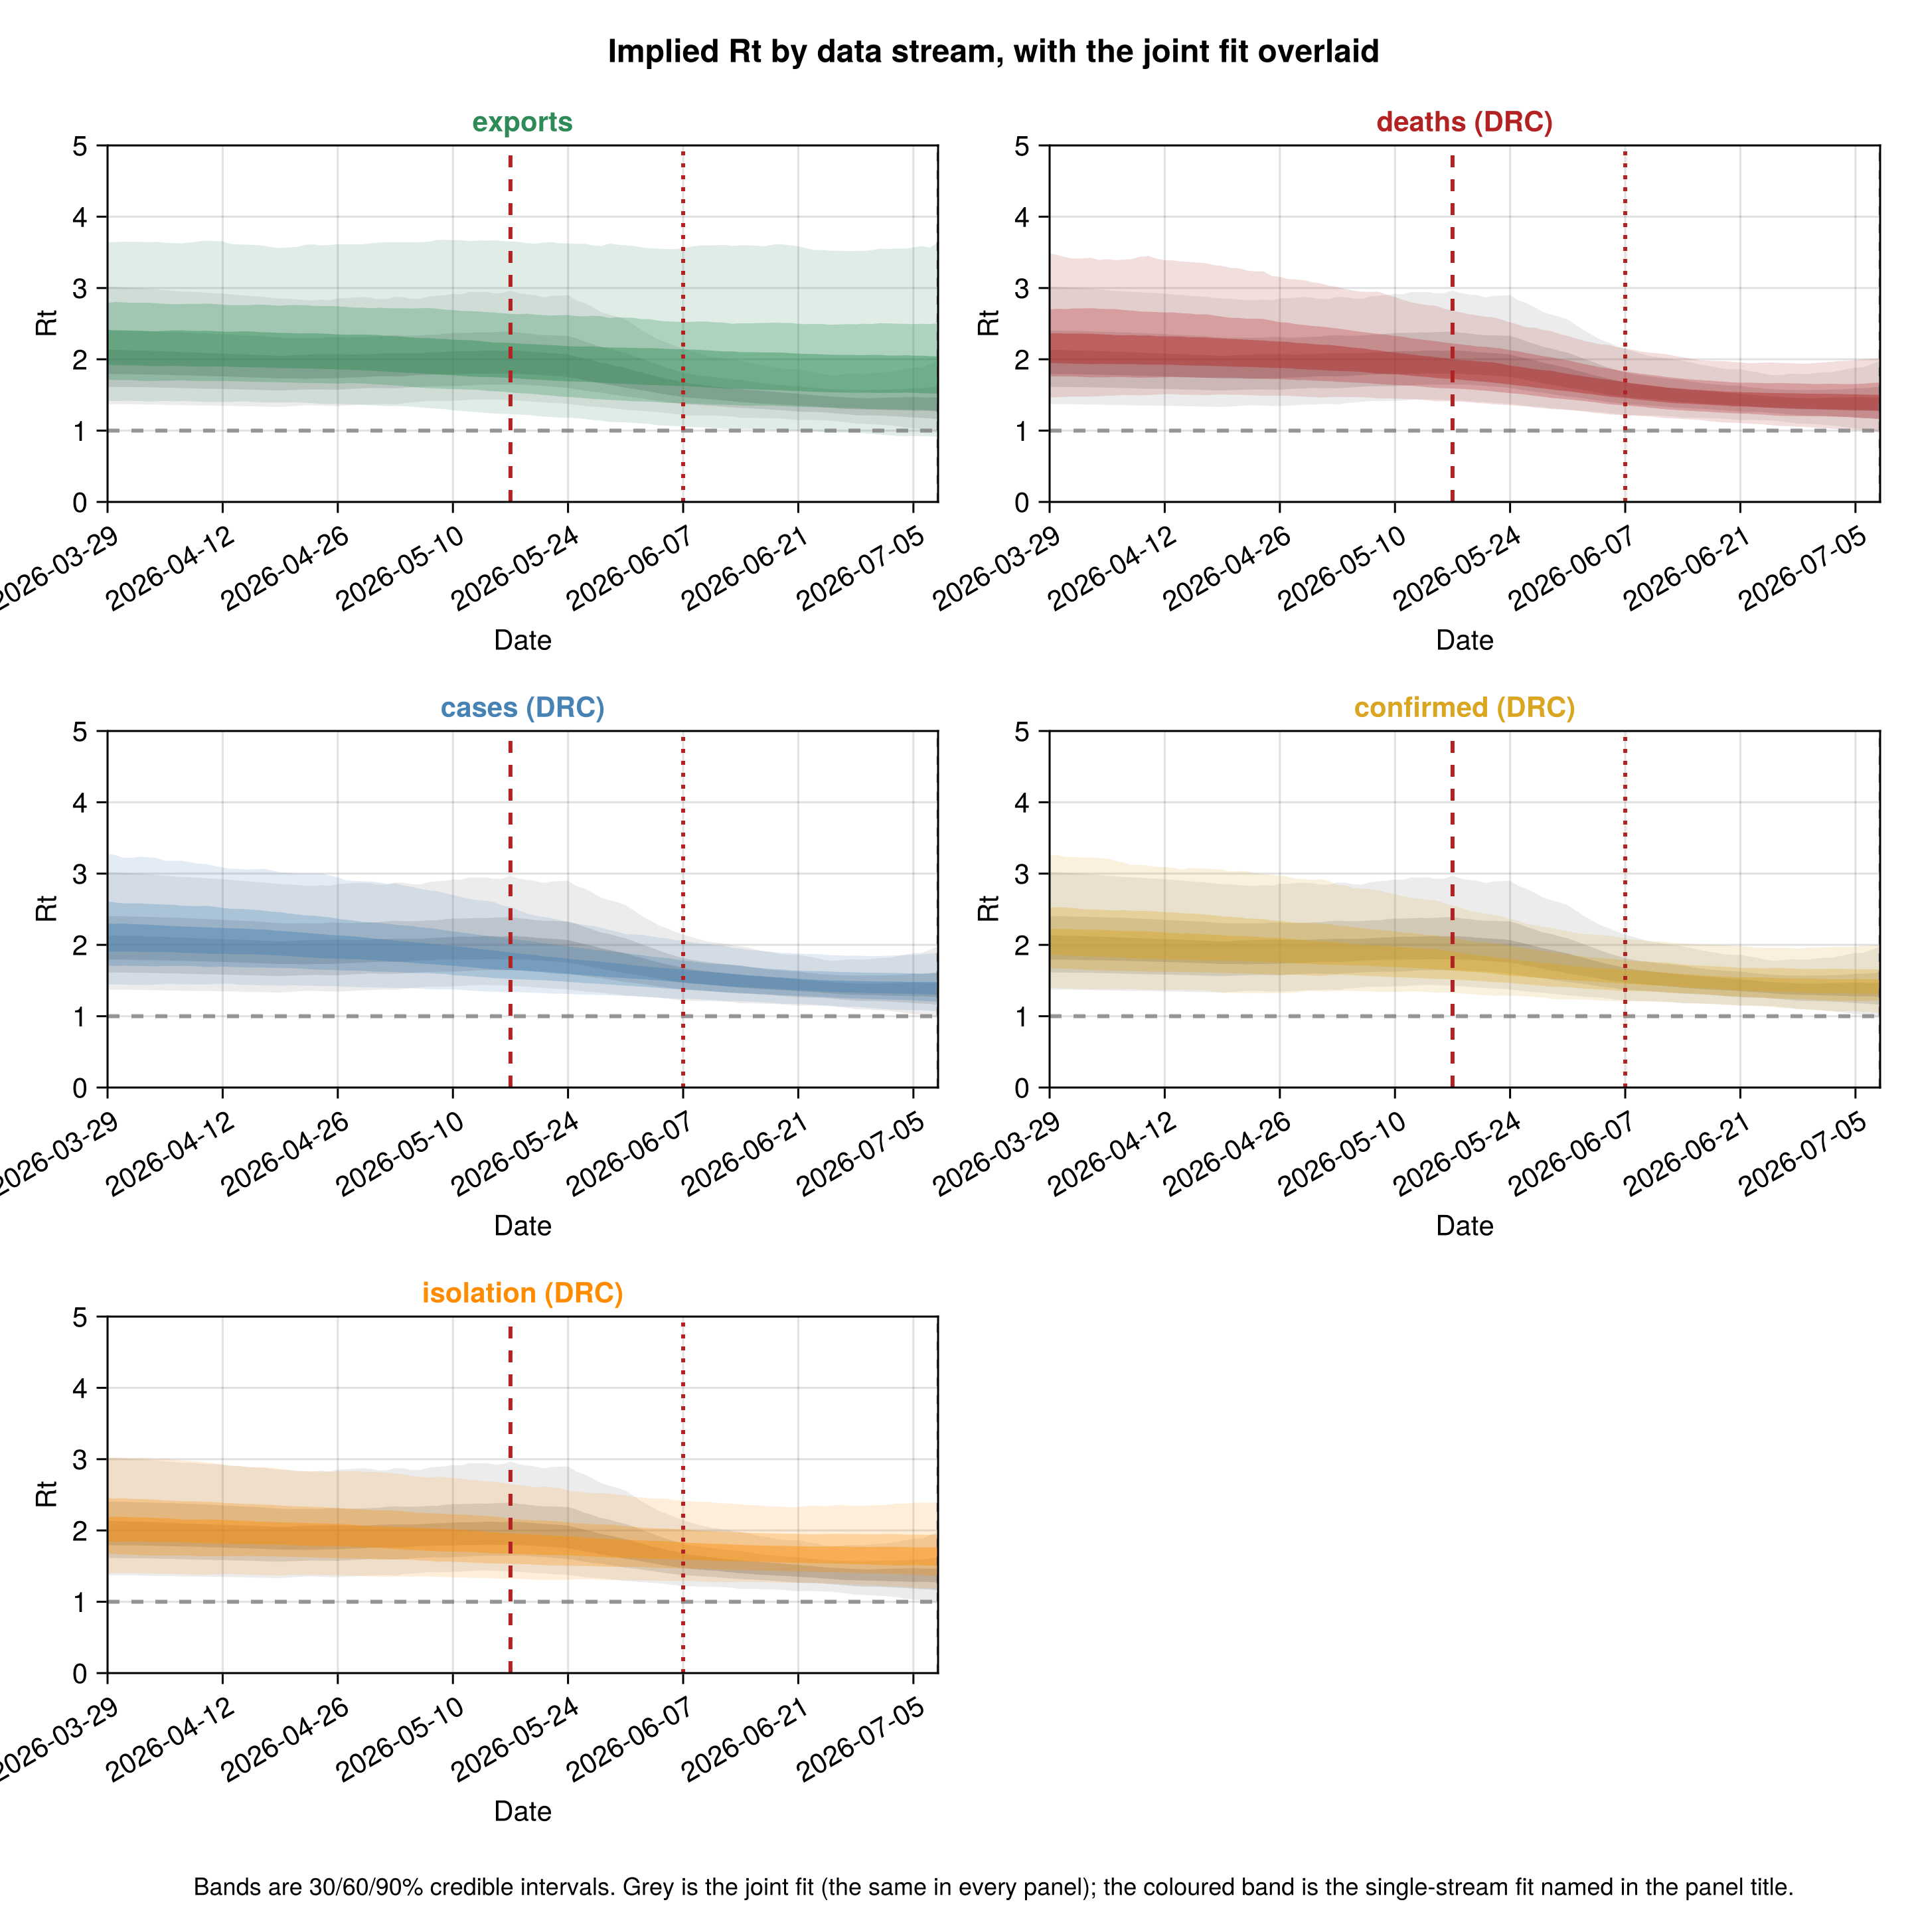
Reproduction number by data stream
The reproduction number each data stream implies on its own, fitted to that stream alone. Agreement between the streams supports the joint estimate; disagreement shows where they pull in different directions.
For the full results, methods and code see the Analysis page and the epiforecasts/BVDOutbreakSize repository.