Plot posterior predictions
Usage
plot_posterior(
  posterior,
  obs = NULL,
  forecast_dates = NULL,
  central = FALSE,
  all_obs = FALSE,
  voc_label = "variant of concern"
)
Arguments
- posterior
A dataframe of posterior output as produced by
fv_tidy_posterior(). For forecast dates to be extracted data withvalue_type == "cases"must be present.- obs
A data frame of observed data as produced by
latest_obs().- forecast_dates
A data.frame in the format produced by
extract_forecast_dates()(with at least a date variable and a Data unavailable variable)). Specifies when date availability should be add to plots. May contain faceting variables.- central
Logical, defaults to FALSE. Should the mean and median central estimates be plot as dashed and solid lines respectively. Requires
meanandmedianvariables to be present in the input.- all_obs
Logical, defaults to
FALSE. Should all observations be plot or just those in the date range of the estimates being plot.- voc_label
Character string giving the name to assign to the variant of concern. Defaults to "variant of concern".
See also
Plotting functions
add_forecast_dates(),
plot.fv_forecast(),
plot.fv_posterior(),
plot_cases(),
plot_default(),
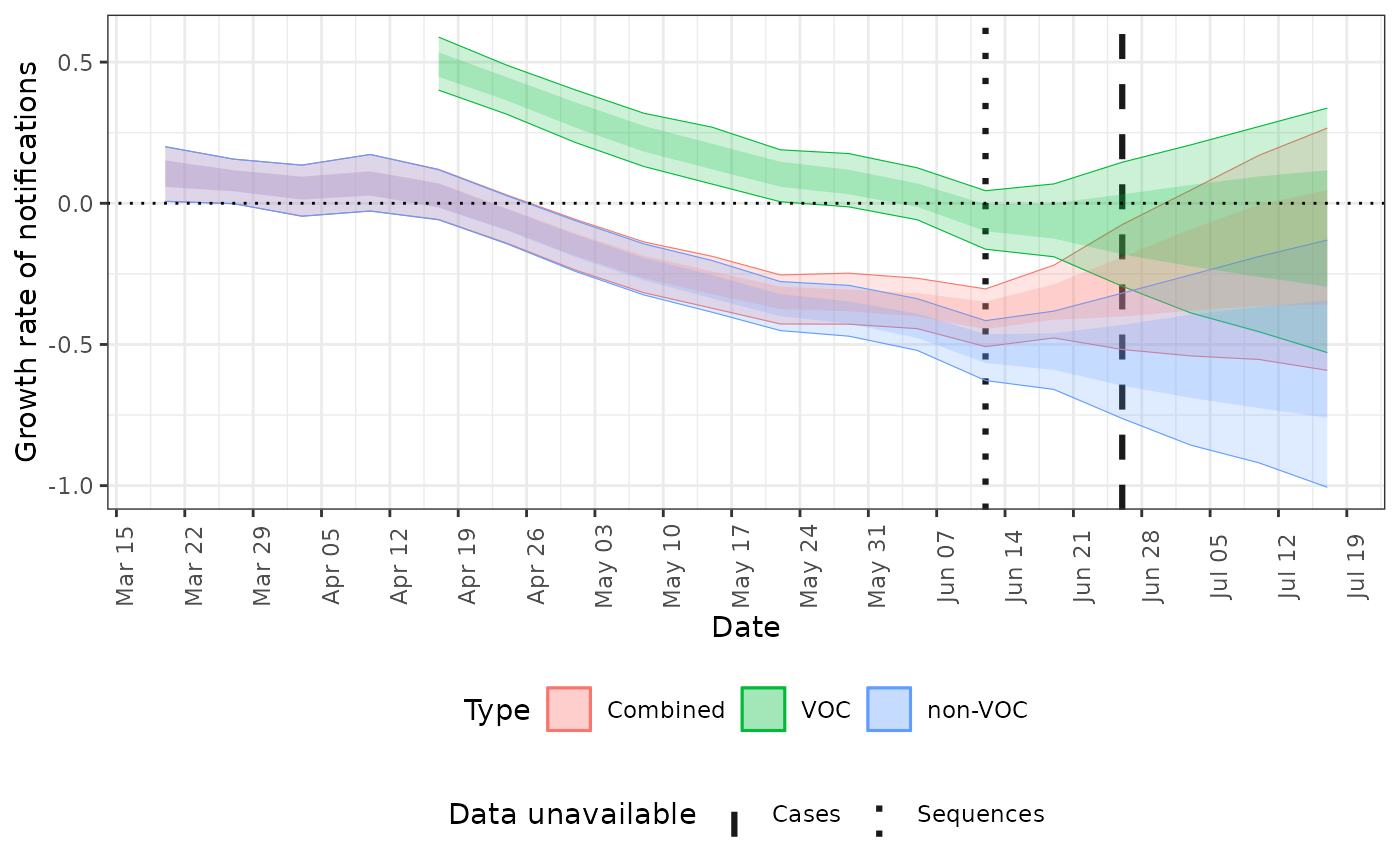
plot_growth(),
plot_pairs(),
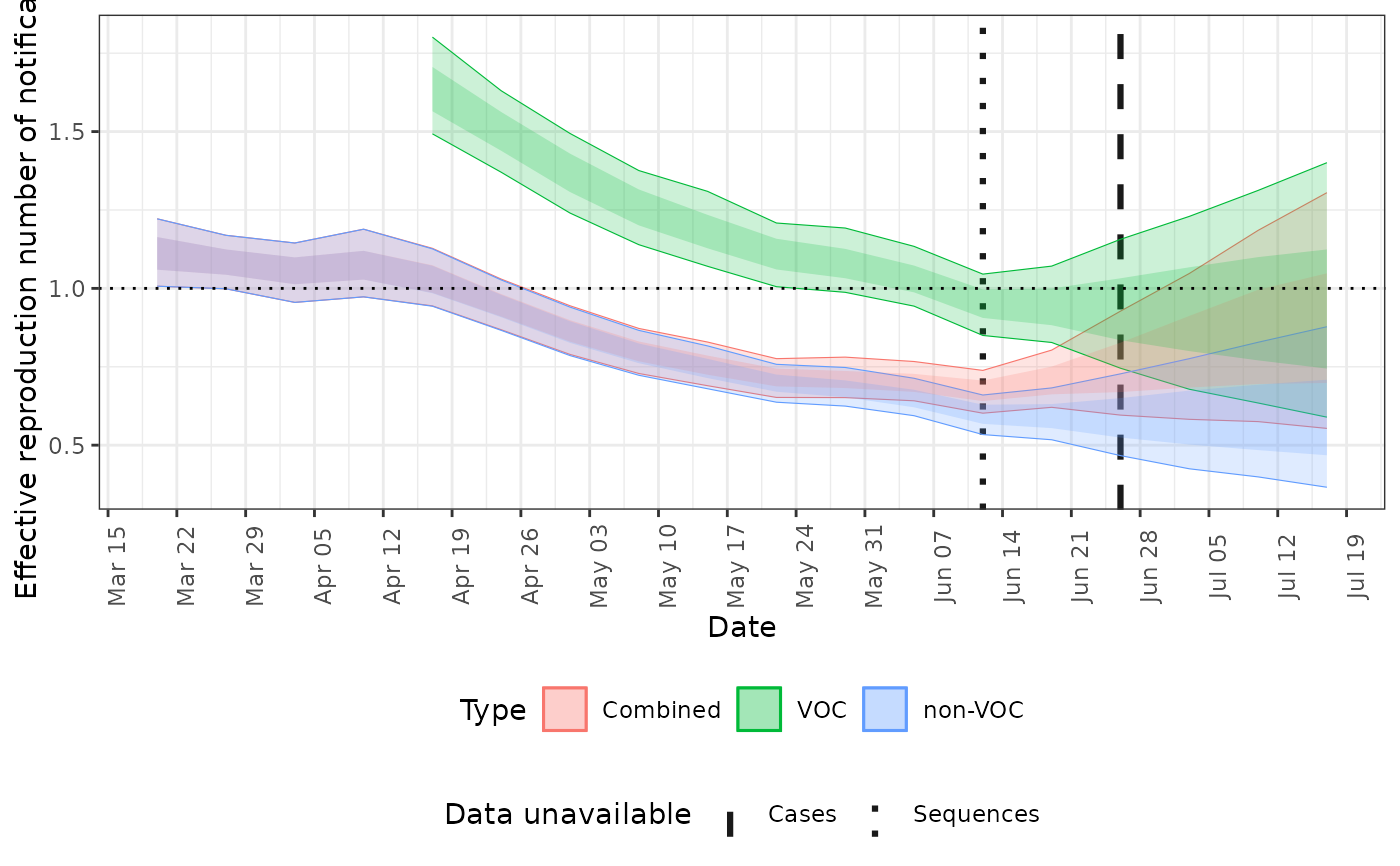
plot_rt(),
plot_theme(),
plot_voc_advantage(),
plot_voc_frac(),
save_plots()
Examples
posterior <- fv_example(strains = 2, type = "posterior")
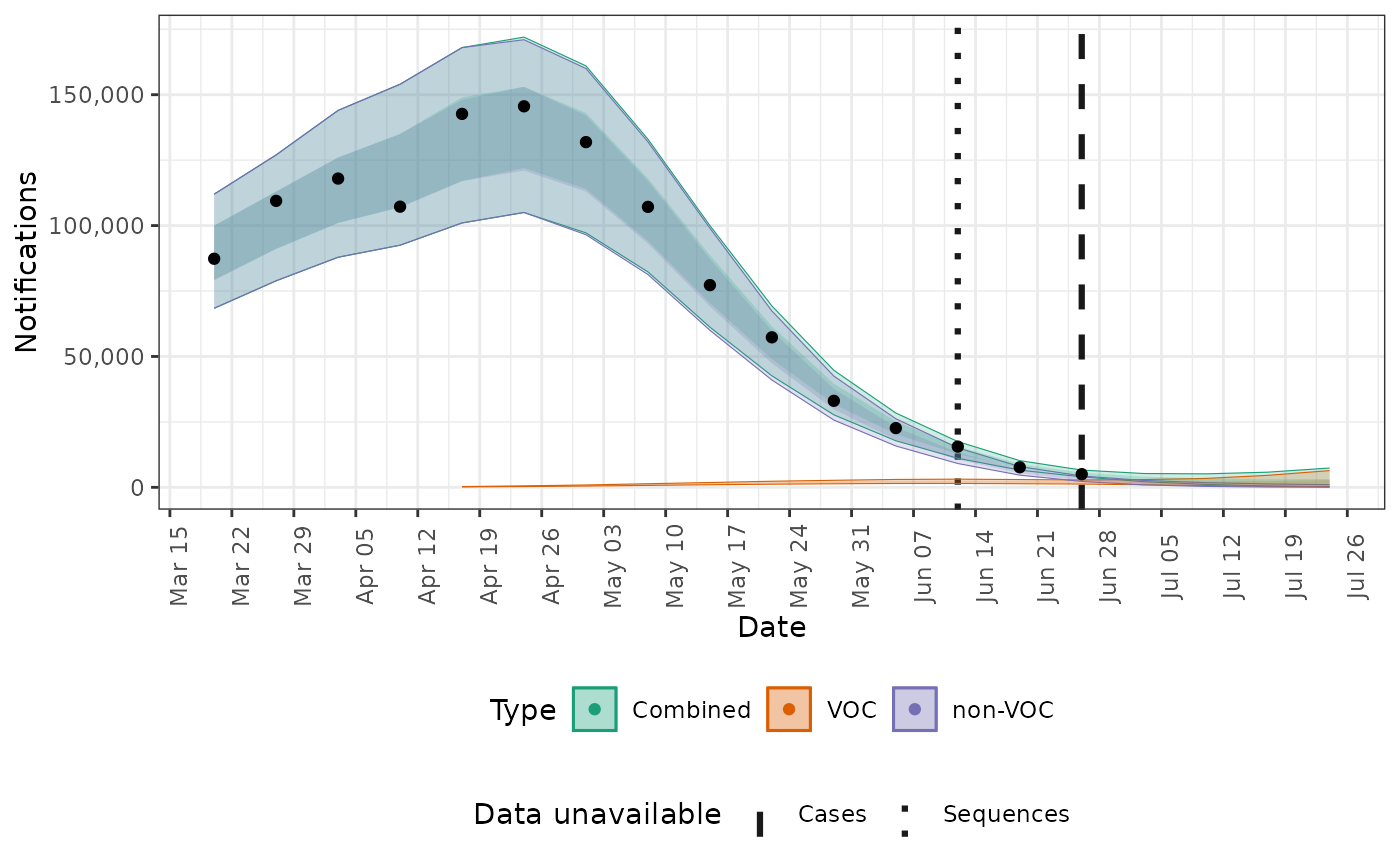
plot_posterior(posterior)
#> $cases
 #>
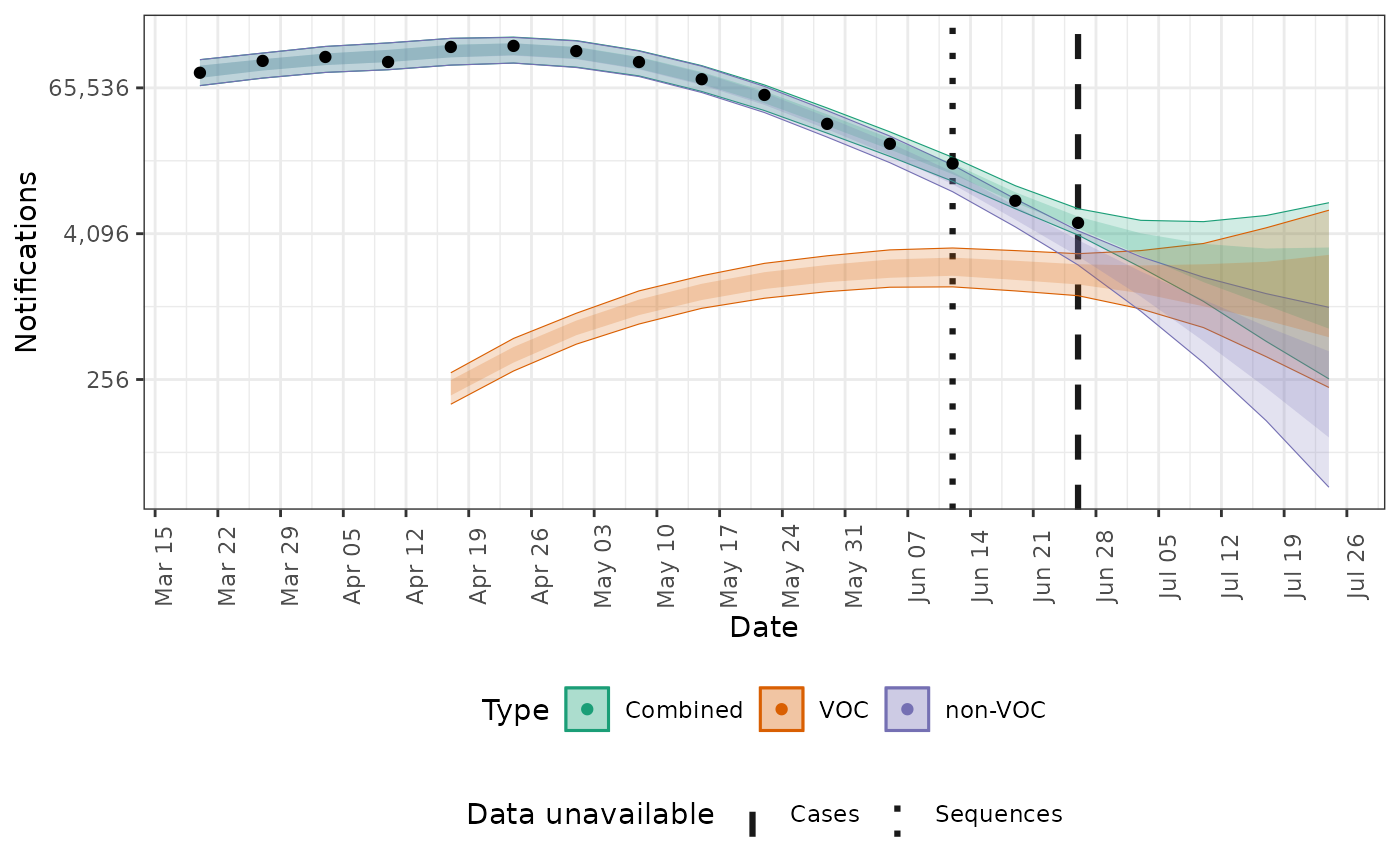
#> $log_cases
#>
#> $log_cases
 #>
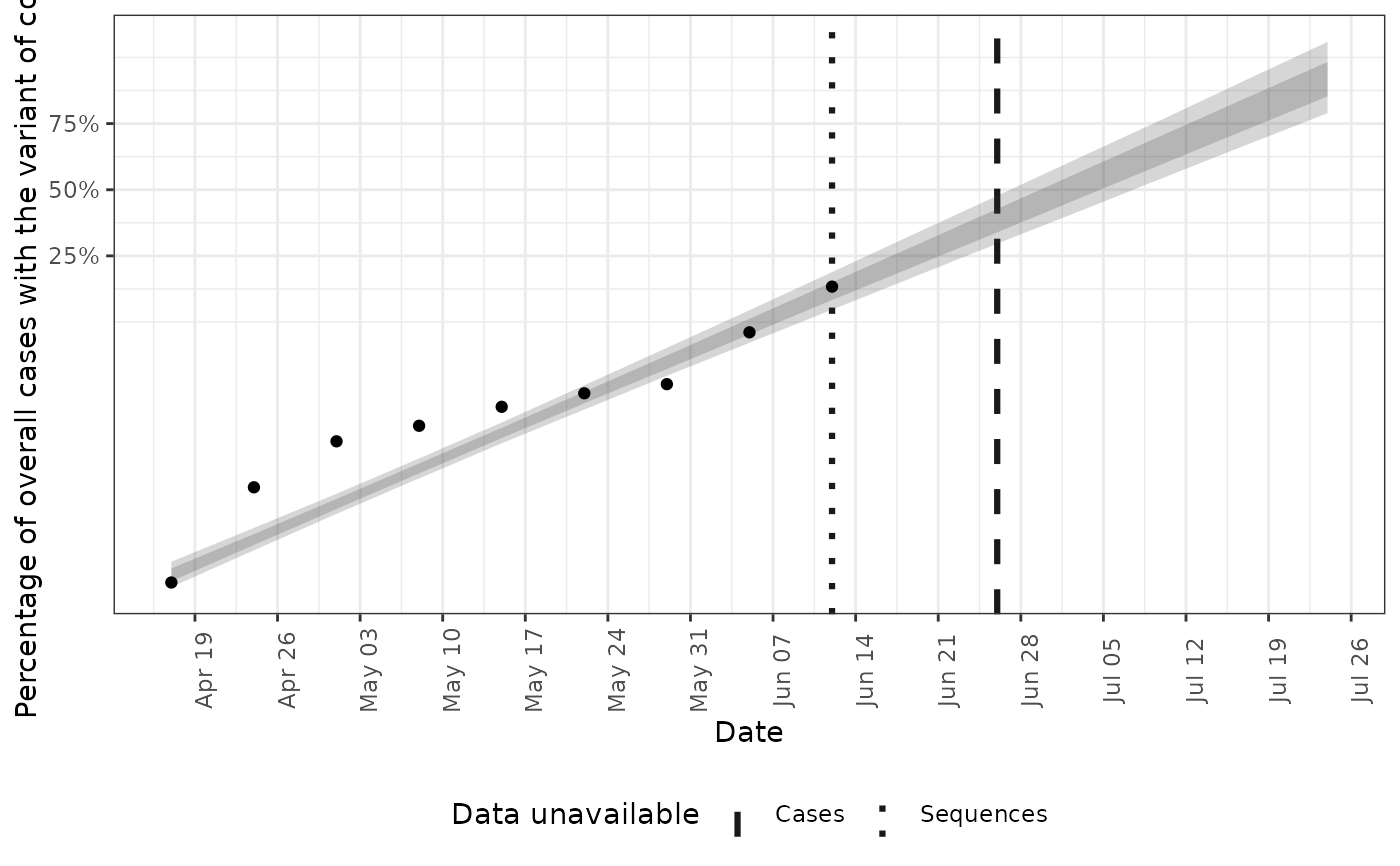
#> $voc_frac
#>
#> $voc_frac
 #>
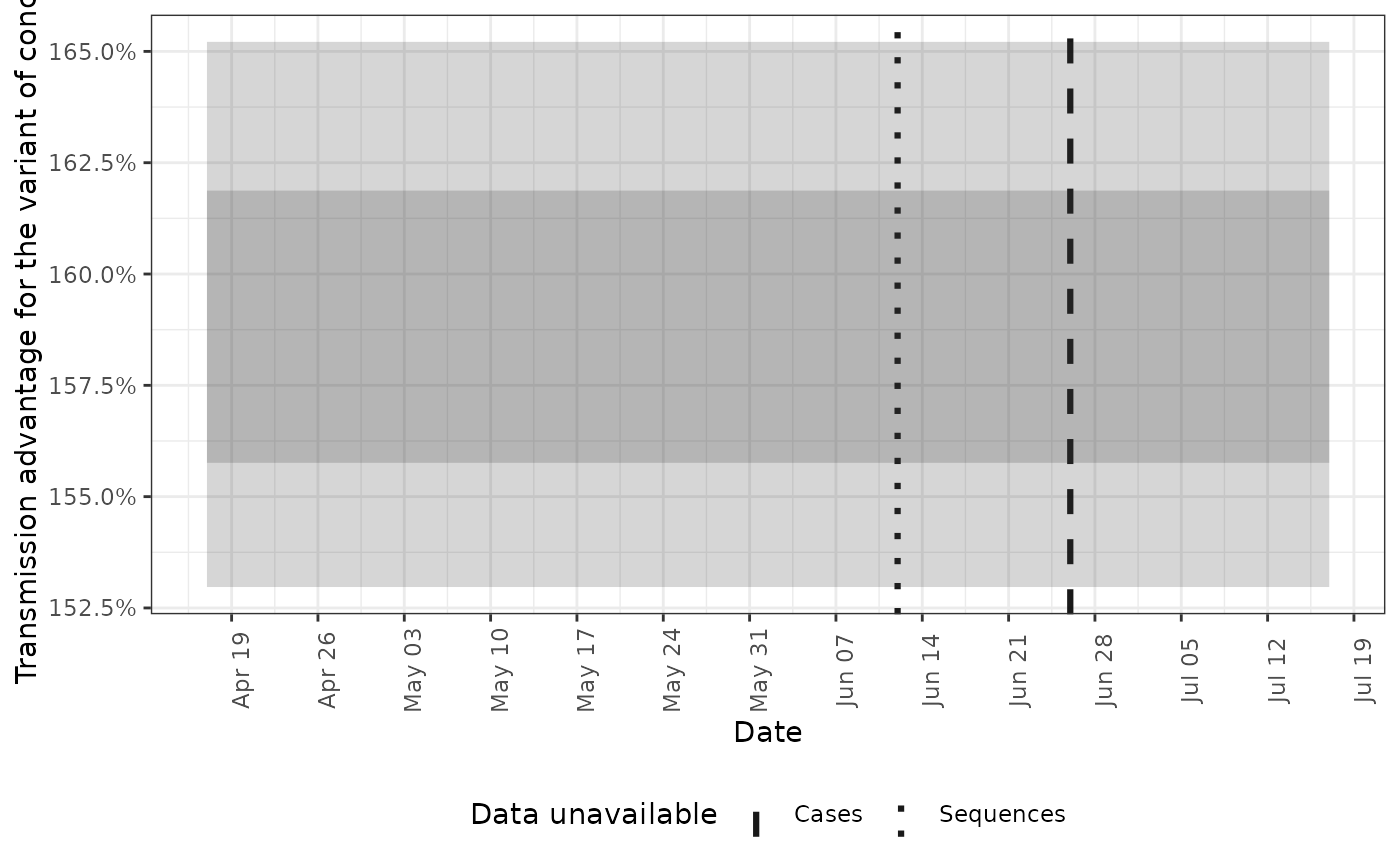
#> $voc_advantage
#>
#> $voc_advantage
 #>
#> $growth
#>
#> $growth
 #>
#> $rt
#>
#> $rt
 #>
#>