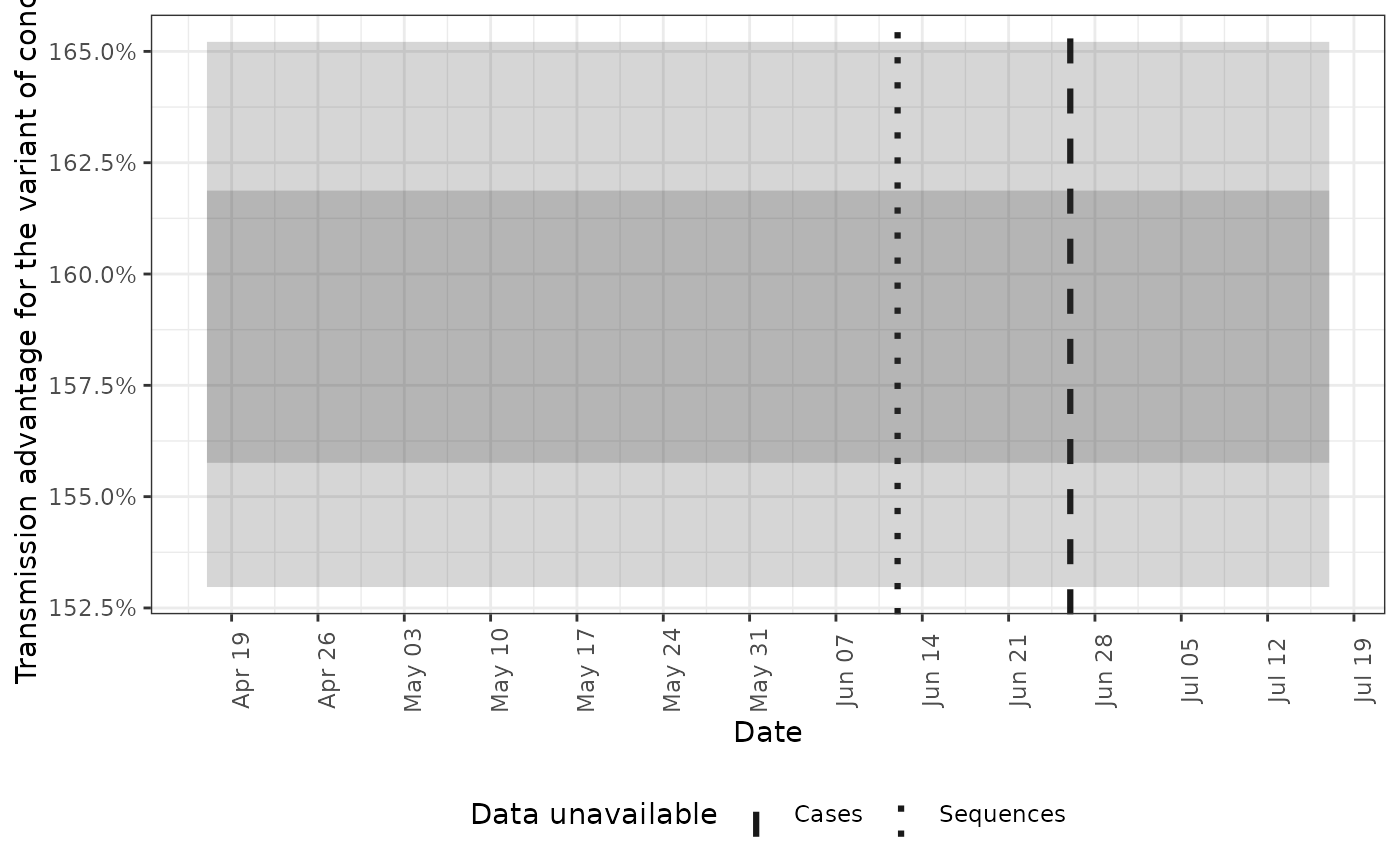
Plot the posterior prediction for the transmission advantage for the variant of concern
Source:R/plot.R
plot_voc_advantage.RdPlot the posterior prediction for the transmission advantage for the variant of concern
Usage
plot_voc_advantage(
  posterior,
  forecast_dates = NULL,
  central = FALSE,
  voc_label = "variant of concern",
  ...
)
Arguments
- posterior
A dataframe of posterior output as produced by
fv_tidy_posterior(). For forecast dates to be extracted data withvalue_type == "cases"must be present.- forecast_dates
A data.frame in the format produced by
extract_forecast_dates()(with at least a date variable and a Data unavailable variable)). Specifies when date availability should be add to plots. May contain faceting variables.- central
Logical, defaults to FALSE. Should the mean and median central estimates be plot as dashed and solid lines respectively. Requires
meanandmedianvariables to be present in the input.- voc_label
Character string giving the name to assign to the variant of concern. Defaults to "variant of concern".
- ...
Additional parameters passed to
plot_default().
See also
Plotting functions
add_forecast_dates(),
plot.fv_forecast(),
plot.fv_posterior(),
plot_cases(),
plot_default(),
plot_growth(),
plot_pairs(),
plot_posterior(),
plot_rt(),
plot_theme(),
plot_voc_frac(),
save_plots()
Examples
posterior <- fv_example(strains = 2, type = "posterior")
plot_voc_advantage(posterior)