plot method for class "fv_posterior". This function wraps all
lower level plot functions.
Usage
# S3 method for fv_posterior
plot(
  x,
  obs = NULL,
  type = "cases",
  forecast_dates = NULL,
  central = FALSE,
  all_obs = FALSE,
  voc_label = "variant of concern",
  ...
)
Arguments
- x
A
data.tableof output as produced byfv_tidy_posterior().- obs
A data frame of observed data as produced by
latest_obs().- type
A character string indicating the type of plot required, defaulting to "cases". Current options are: "cases" which calls
plot_cases(), "voc_frac" which callsplot_voc_frac(), "voc_advantage" which callsplot_voc_advantage(), "growth" which callsplot_growth(), "rt" which callsplot_rt(), and "all" which produces a list of all plots by callplot_posterior().- forecast_dates
A data.frame in the format produced by
extract_forecast_dates()(with at least a date variable and a Data unavailable variable)). Specifies when date availability should be add to plots. May contain faceting variables.- central
Logical, defaults to FALSE. Should the mean and median central estimates be plot as dashed and solid lines respectively. Requires
meanandmedianvariables to be present in the input.- all_obs
Logical, defaults to
FALSE. Should all observations be plot or just those in the date range of the estimates being plot.- voc_label
Character string giving the name to assign to the variant of concern. Defaults to "variant of concern".
- ...
Pass additional arguments to lower level plot functions.
See also
Functions used for postprocessing of model fits
convert_to_stanfit(),
extract_draws(),
extract_forecast_dates(),
fv_extract_forecast(),
fv_posterior(),
fv_tidy_posterior(),
link_dates_with_posterior(),
link_obs_with_posterior(),
print.fv_posterior(),
quantiles_to_long(),
summary.fv_posterior(),
update_voc_label()
Plotting functions
add_forecast_dates(),
plot.fv_forecast(),
plot_cases(),
plot_default(),
plot_growth(),
plot_pairs(),
plot_posterior(),
plot_rt(),
plot_theme(),
plot_voc_advantage(),
plot_voc_frac(),
save_plots()
Examples
posterior <- fv_example(strains = 2, type = "posterior")
# plot cases on the log scale
plot(posterior, type = "cases", log = TRUE)
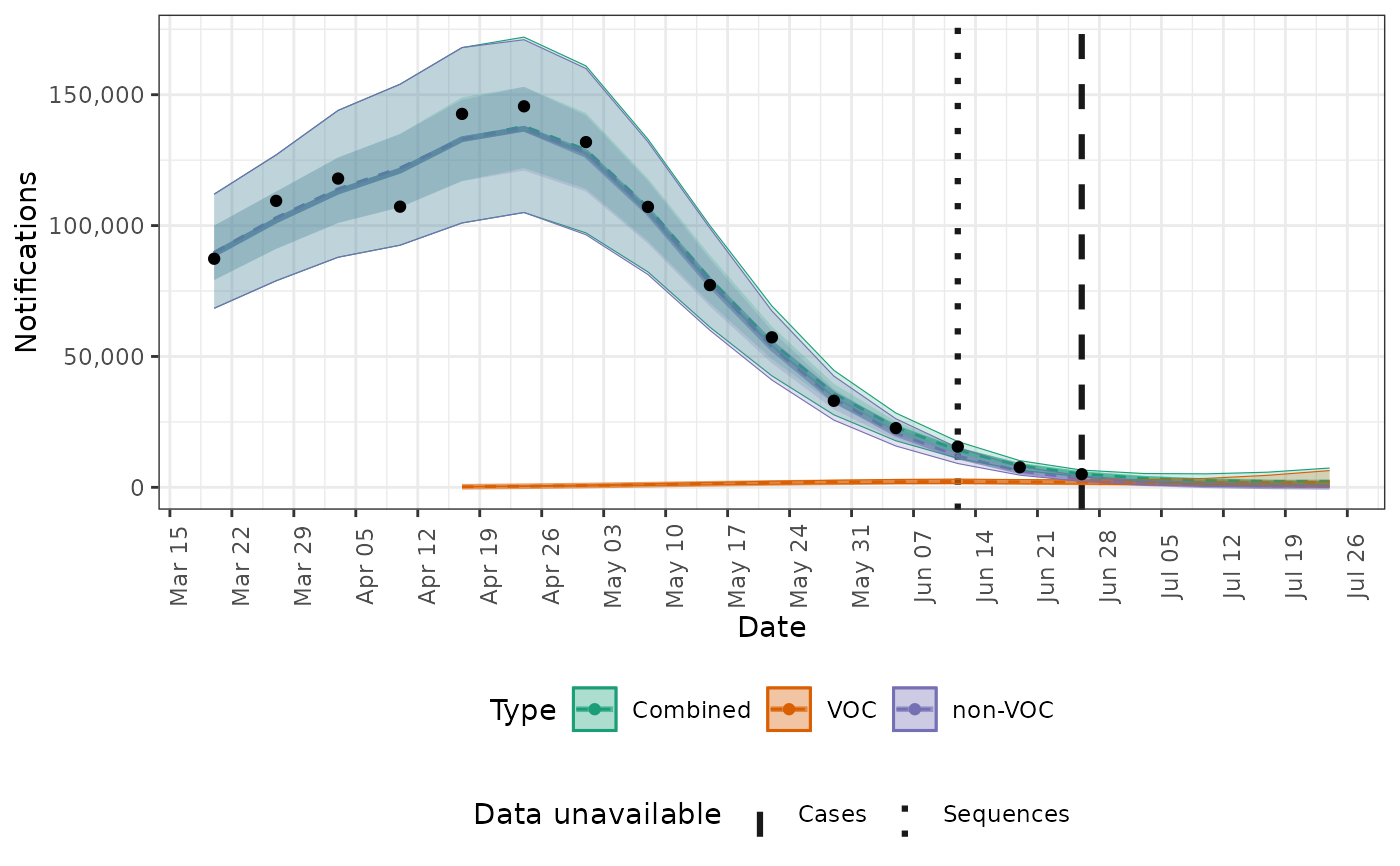
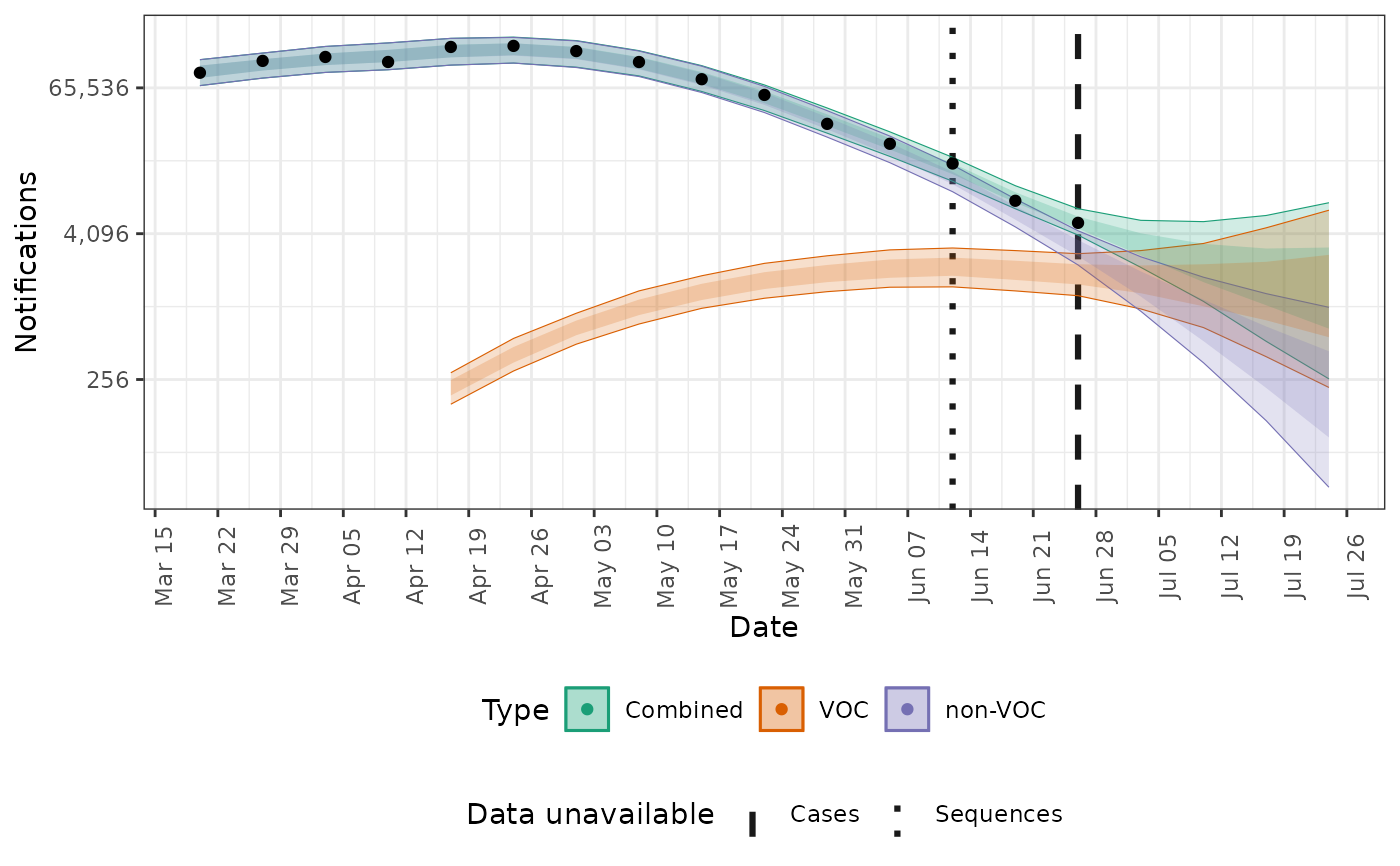 # plot cases with central estimates
plot(posterior, type = "cases", log = FALSE, central = TRUE)
# plot cases with central estimates
plot(posterior, type = "cases", log = FALSE, central = TRUE)
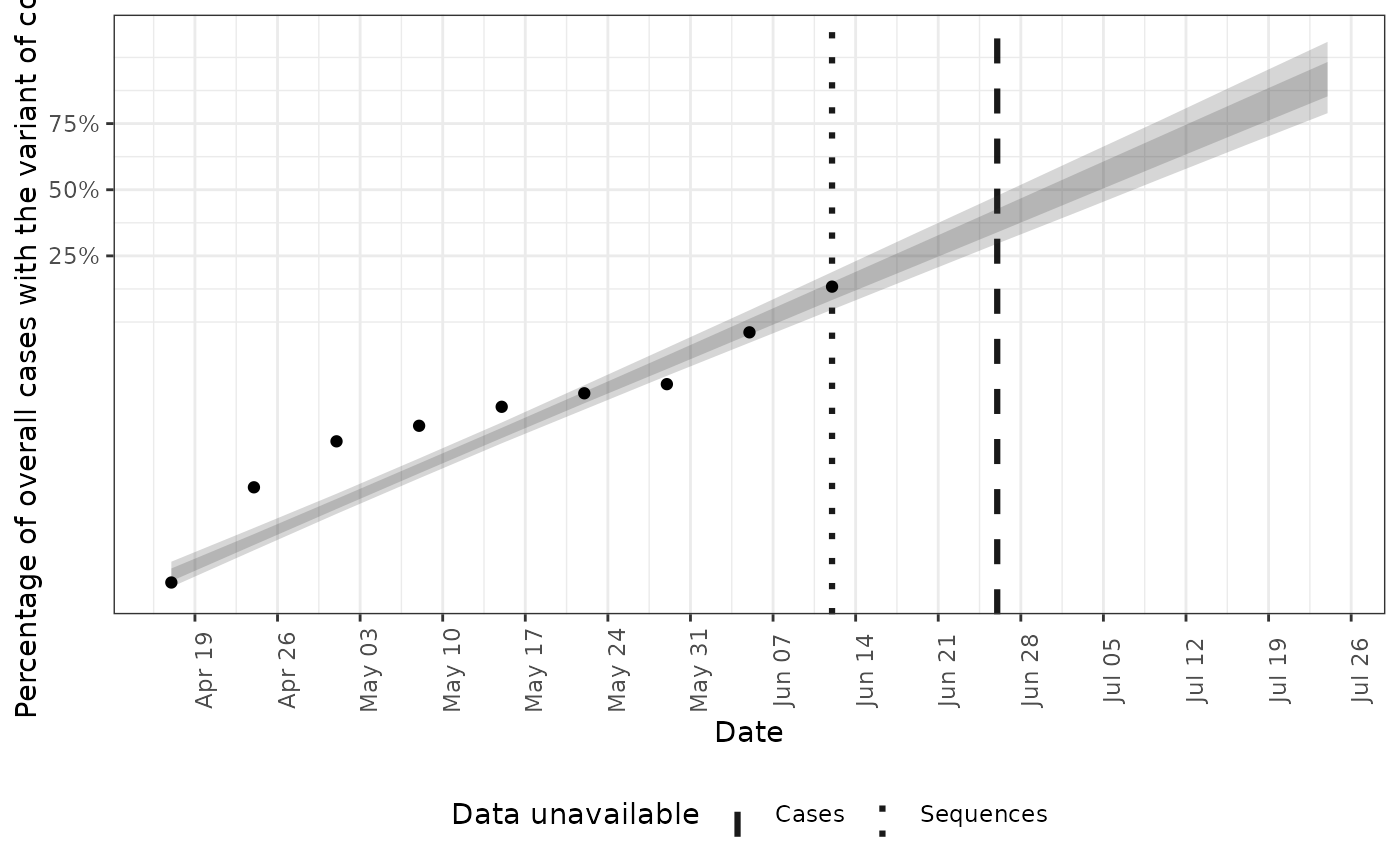
 # plot fraction that have the variant of concern
plot(posterior, type = "voc_frac")
# plot fraction that have the variant of concern
plot(posterior, type = "voc_frac")
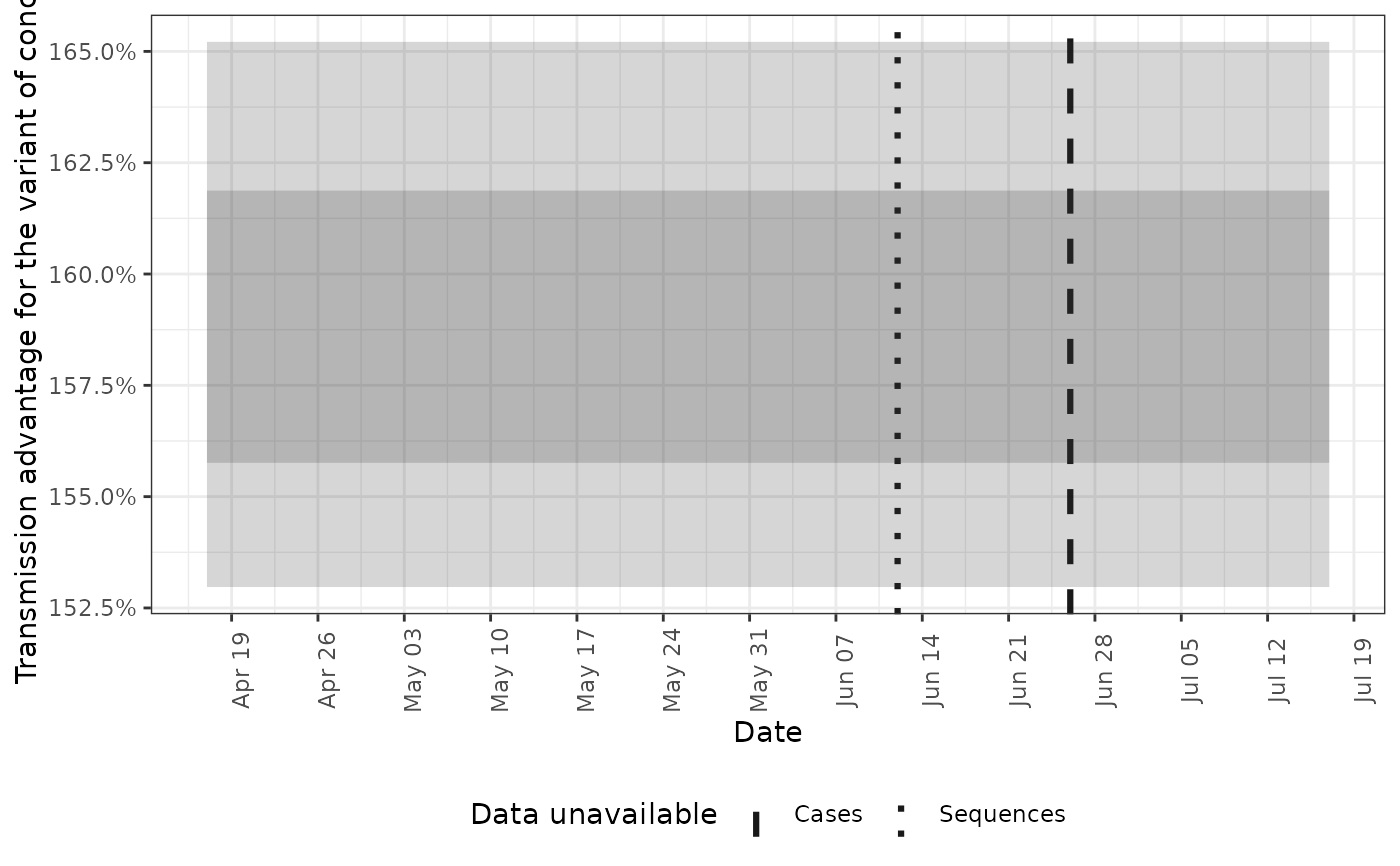
 # plot the transmission advantage for the the variant of concern
plot(posterior, type = "voc_advantage")
# plot the transmission advantage for the the variant of concern
plot(posterior, type = "voc_advantage")
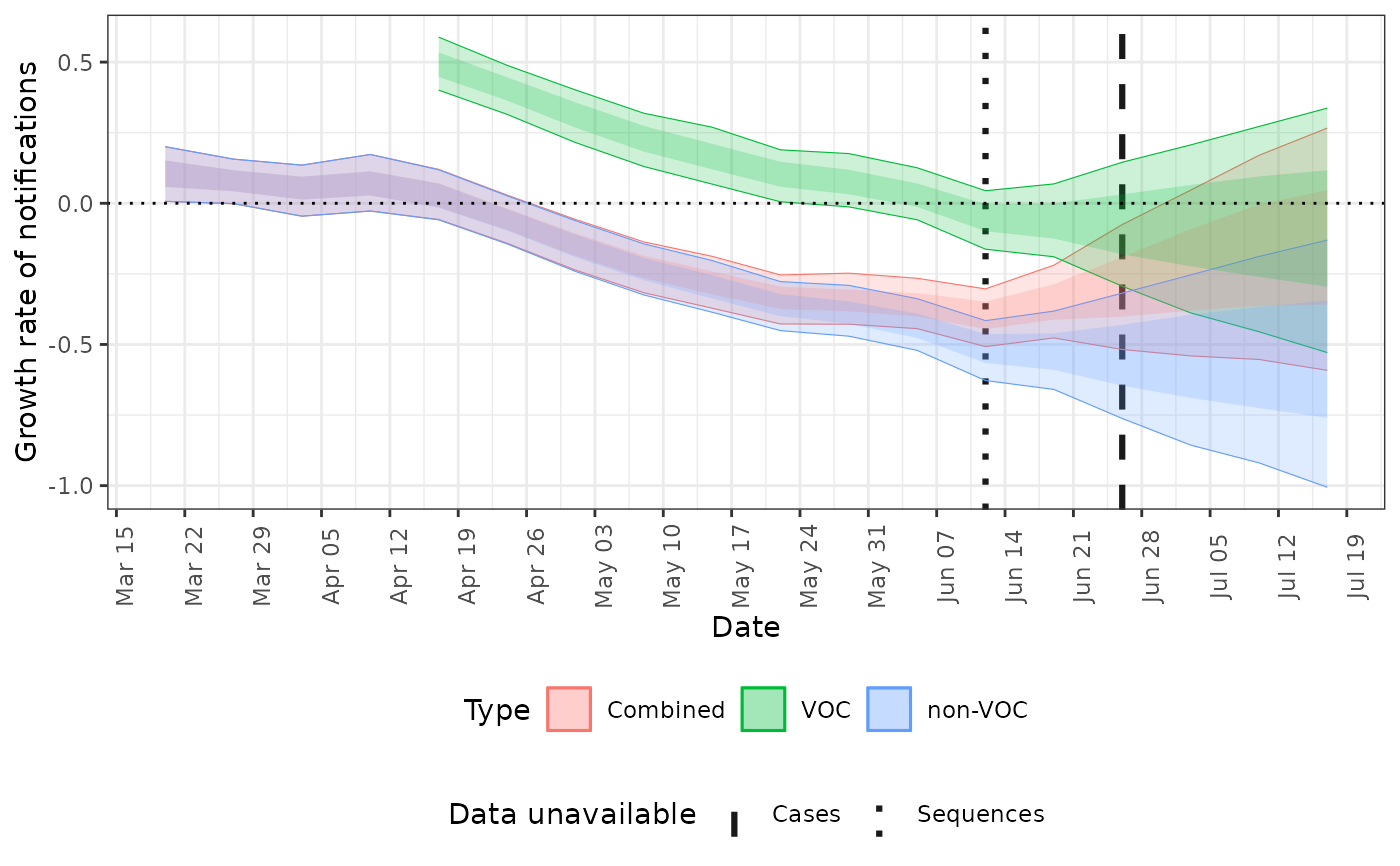
 # plot the growth rates for both voc and non-voc cases
plot(posterior, type = "growth")
# plot the growth rates for both voc and non-voc cases
plot(posterior, type = "growth")
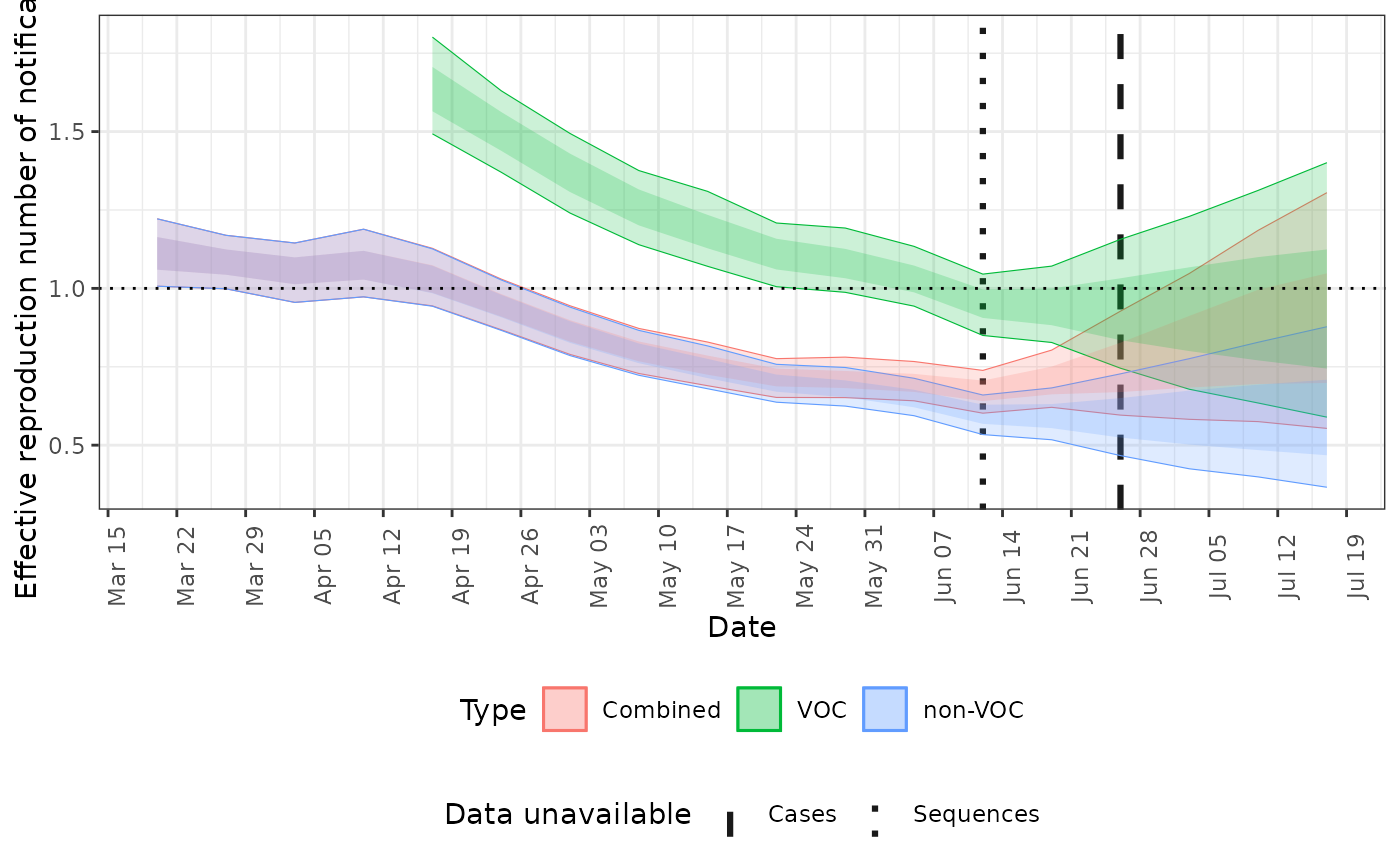
 # plot the reproduction number estimates
plot(posterior, type = "rt")
# plot the reproduction number estimates
plot(posterior, type = "rt")