Wrapper around pit() for use in data.frames
Arguments
- data
a data.frame with the following columns:
true_value,prediction,sample.- by
Character vector with the columns according to which the PIT values shall be grouped. If you e.g. have the columns 'model' and 'location' in the data and want to have a PIT histogram for every model and location, specify
by = c("model", "location").- n_replicates
the number of draws for the randomised PIT for integer predictions.
References
Sebastian Funk, Anton Camacho, Adam J. Kucharski, Rachel Lowe, Rosalind M. Eggo, W. John Edmunds (2019) Assessing the performance of real-time epidemic forecasts: A case study of Ebola in the Western Area region of Sierra Leone, 2014-15, doi:10.1371/journal.pcbi.1006785
Examples
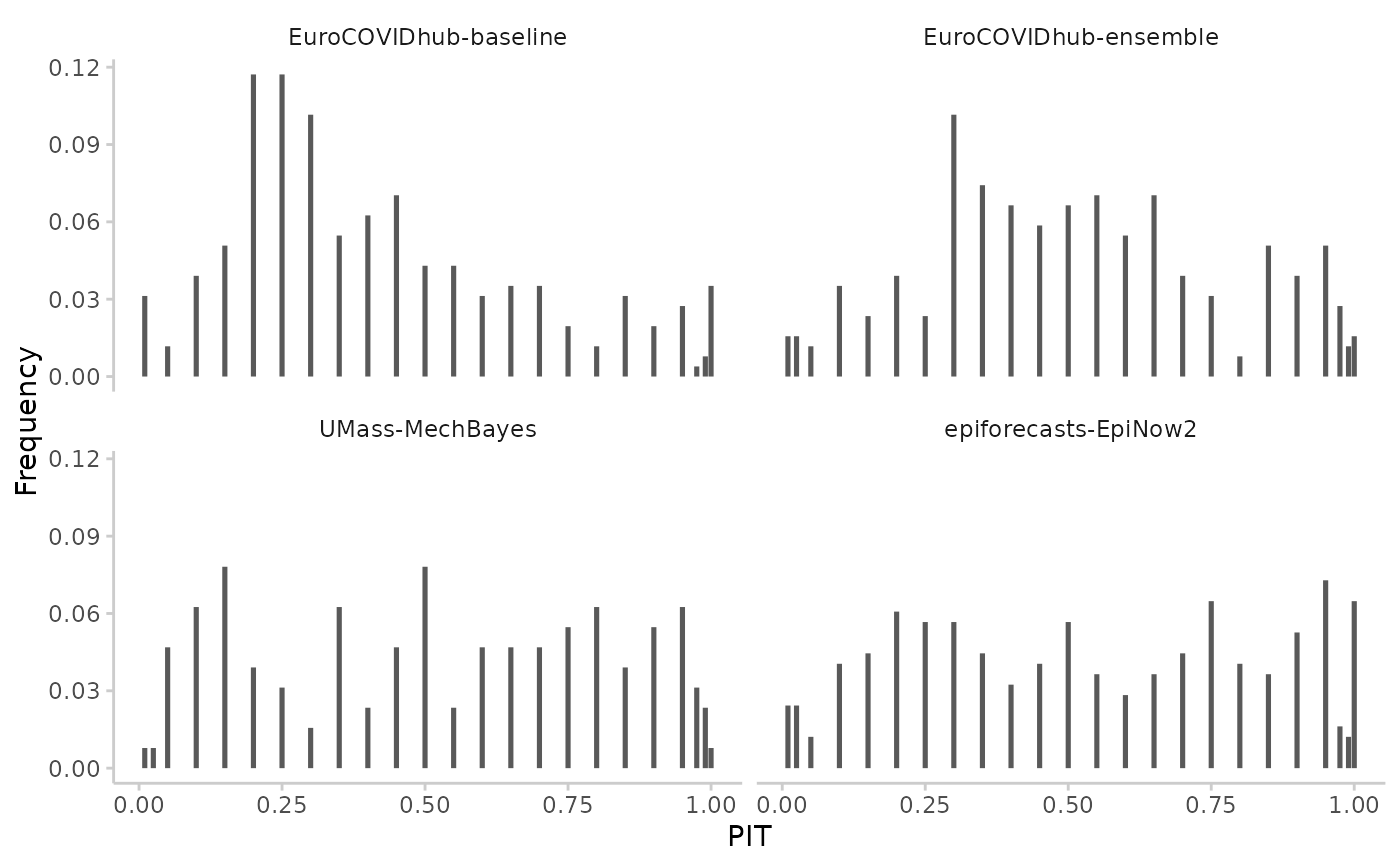
result <- pit(example_continuous, by = "model")
#> The following messages were produced when checking inputs:
#> 1. 144 values for `prediction` are NA in the data provided and the corresponding rows were removed. This may indicate a problem if unexpected.
plot_pit(result)
 # example with quantile data
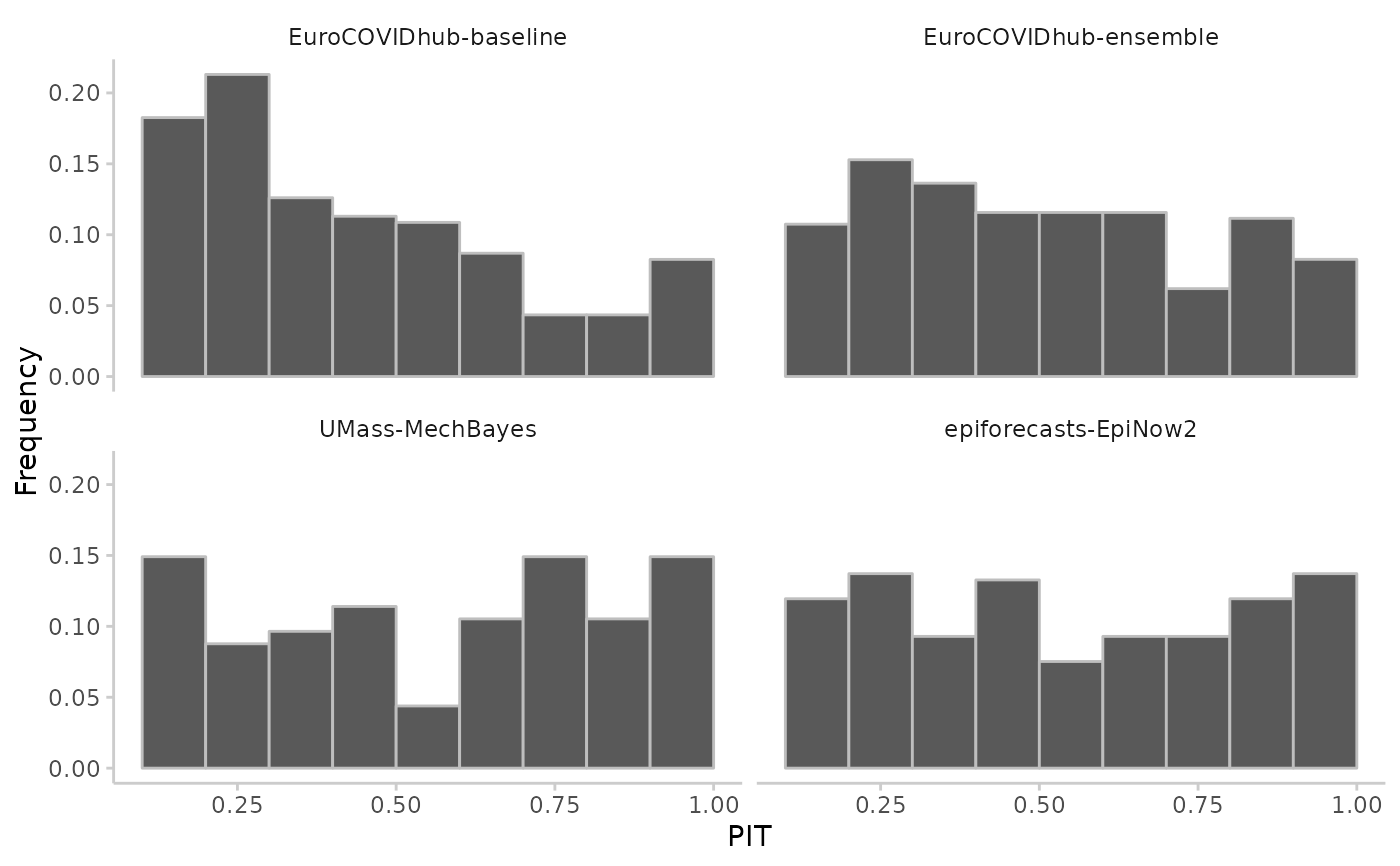
result <- pit(example_quantile, by = "model")
#> The following messages were produced when checking inputs:
#> 1. 144 values for `prediction` are NA in the data provided and the corresponding rows were removed. This may indicate a problem if unexpected.
plot_pit(result)
# example with quantile data
result <- pit(example_quantile, by = "model")
#> The following messages were produced when checking inputs:
#> 1. 144 values for `prediction` are NA in the data provided and the corresponding rows were removed. This may indicate a problem if unexpected.
plot_pit(result)