Visualise Where Forecasts Are Available
Usage
plot_avail_forecasts(
  avail_forecasts,
  y = "model",
  x = "forecast_date",
  make_x_factor = TRUE,
  show_numbers = TRUE
)
Arguments
- avail_forecasts
data.frame with a column called
Number forecastsas produced byavail_forecasts()- y
character vector of length one that denotes the name of the column to appear on the y-axis of the plot. Default is "model".
- x
character vector of length one that denotes the name of the column to appear on the x-axis of the plot. Default is "forecast_date".
- make_x_factor
logical (default is TRUE). Whether or not to convert the variable on the x-axis to a factor. This has an effect e.g. if dates are shown on the x-axis.
- show_numbers
logical (default is
TRUE) that indicates whether or not to show the actual count numbers on the plot
Examples
library(ggplot2)
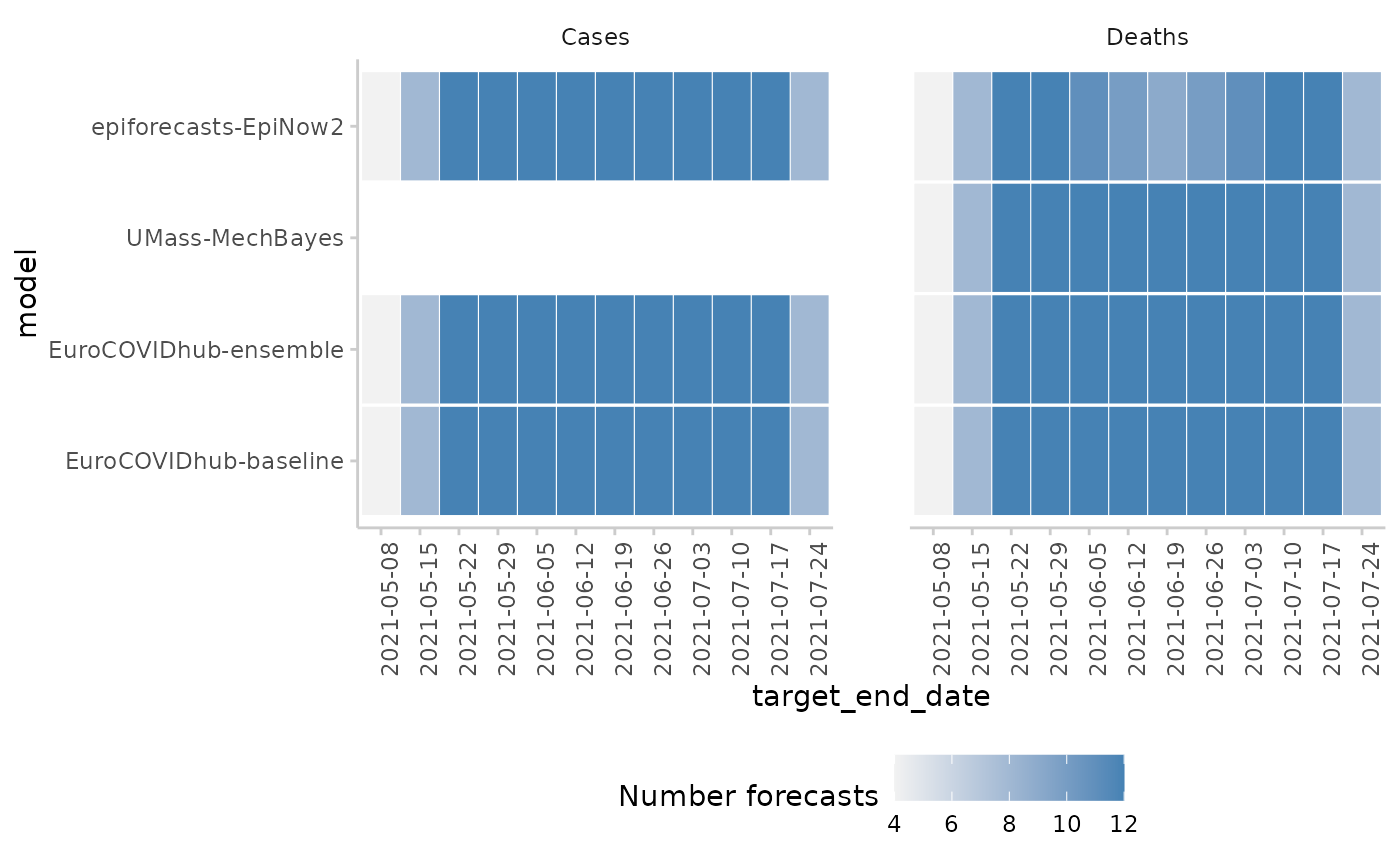
avail_forecasts <- avail_forecasts(
example_quantile, by = c("model", "target_type", "target_end_date")
)
#> The following messages were produced when checking inputs:
#> 1. 144 values for `prediction` are NA in the data provided and the corresponding rows were removed. This may indicate a problem if unexpected.
plot_avail_forecasts(
avail_forecasts, x = "target_end_date", show_numbers = FALSE
) +
facet_wrap("target_type")