Make a plot of observed and predicted values
Usage
plot_predictions(data, by = NULL, x = "date", range = c(0, 50, 90))Arguments
- data
a data.frame that follows the same specifications outlined in
score(). To customise your plotting, you can filter your data using the functionmake_NA().- by
character vector with column names that denote categories by which the plot should be stratified. If for example you want to have a facetted plot, this should be a character vector with the columns used in facetting (note that the facetting still needs to be done outside of the function call)
- x
character vector of length one that denotes the name of the variable
- range
numeric vector indicating the interval ranges to plot. If 0 is included in range, the median prediction will be shown.
Examples
library(ggplot2)
library(magrittr)
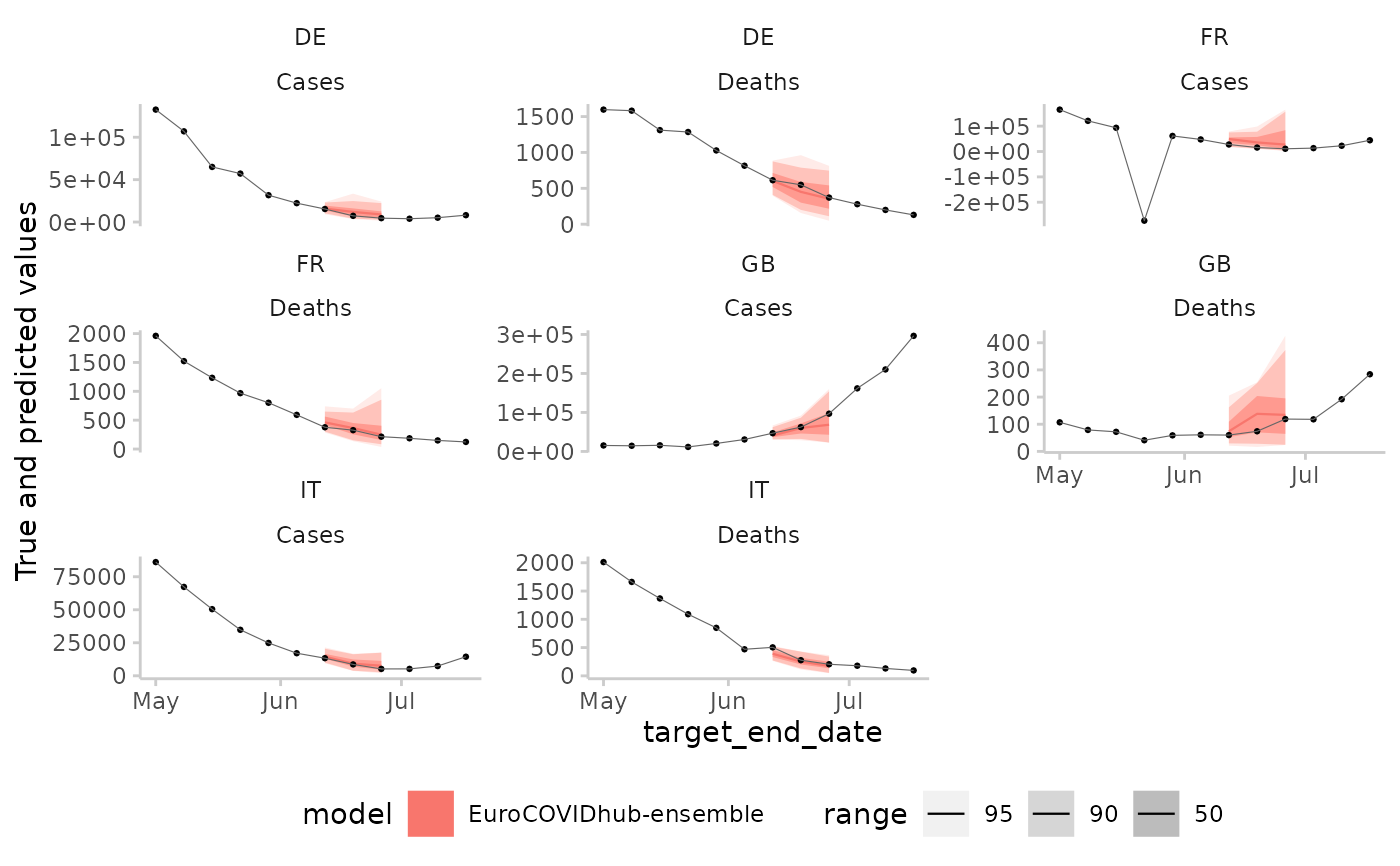
example_continuous %>%
make_NA (
what = "truth",
target_end_date >= "2021-07-22",
target_end_date < "2021-05-01"
) %>%
make_NA (
what = "forecast",
model != "EuroCOVIDhub-ensemble",
forecast_date != "2021-06-07"
) %>%
plot_predictions (
x = "target_end_date",
by = c("target_type", "location"),
range = c(0, 50, 90, 95)
) +
facet_wrap(~ location + target_type, scales = "free_y") +
aes(fill = model, color = model)
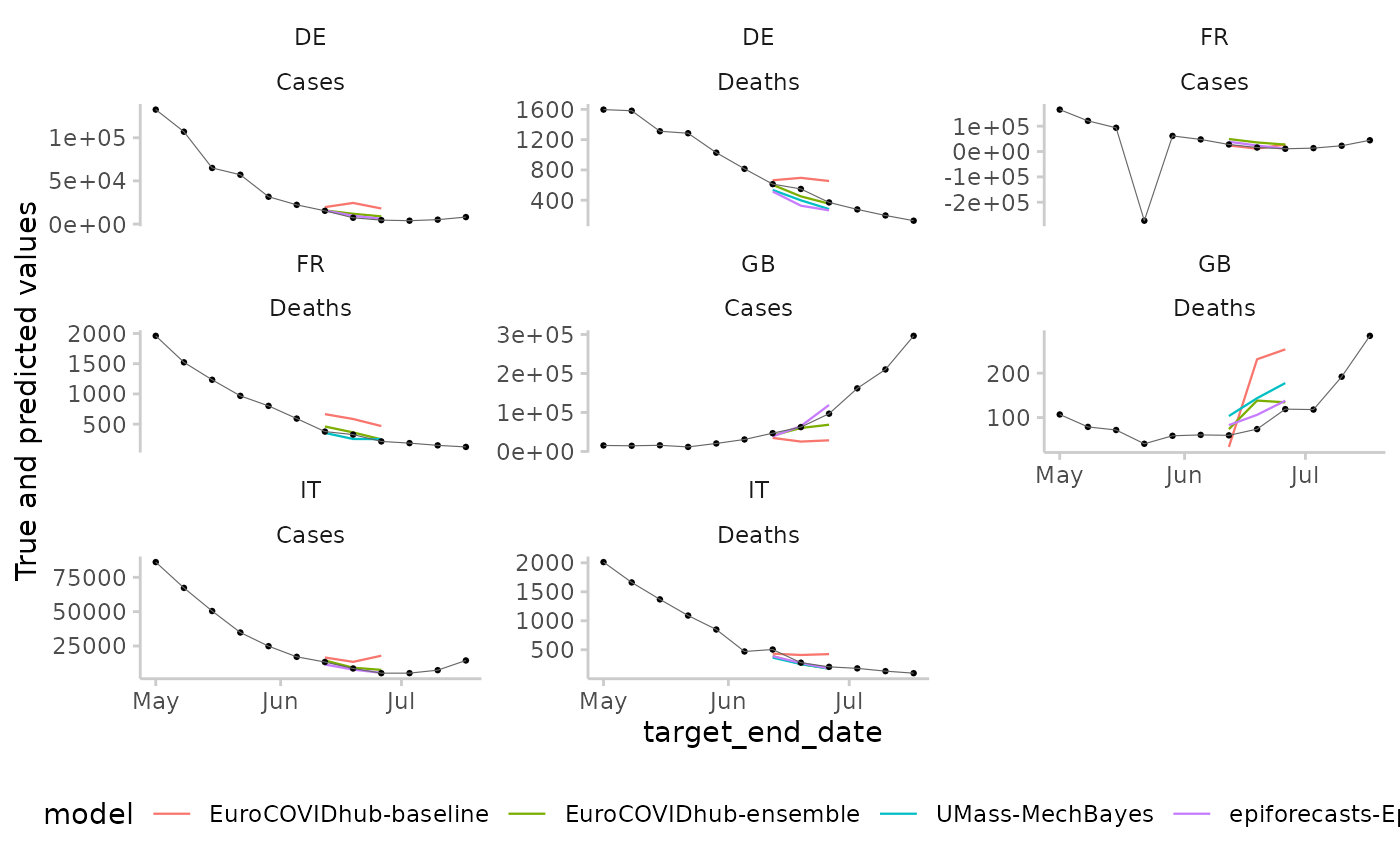
 example_continuous %>%
make_NA (
what = "truth",
target_end_date >= "2021-07-22",
target_end_date < "2021-05-01"
) %>%
make_NA (
what = "forecast",
forecast_date != "2021-06-07"
) %>%
plot_predictions (
x = "target_end_date",
by = c("target_type", "location"),
range = c(0)
) +
facet_wrap(~ location + target_type, scales = "free_y") +
aes(fill = model, color = model)
example_continuous %>%
make_NA (
what = "truth",
target_end_date >= "2021-07-22",
target_end_date < "2021-05-01"
) %>%
make_NA (
what = "forecast",
forecast_date != "2021-06-07"
) %>%
plot_predictions (
x = "target_end_date",
by = c("target_type", "location"),
range = c(0)
) +
facet_wrap(~ location + target_type, scales = "free_y") +
aes(fill = model, color = model)