This function is a wrapper around the
logs_sample() function from the
scoringRules package.
The log score is the negative logarithm of the predictive density evaluated at the observed value.
The function should be used to score continuous predictions only. While the Log Score is in theory also applicable to discrete forecasts, the problem lies in the implementation: The function uses a kernel density estimation, which is not well defined with integer-valued Monte Carlo Samples. See the scoringRules package for more details and alternatives, e.g. calculating scores for specific discrete probability distributions.
Arguments
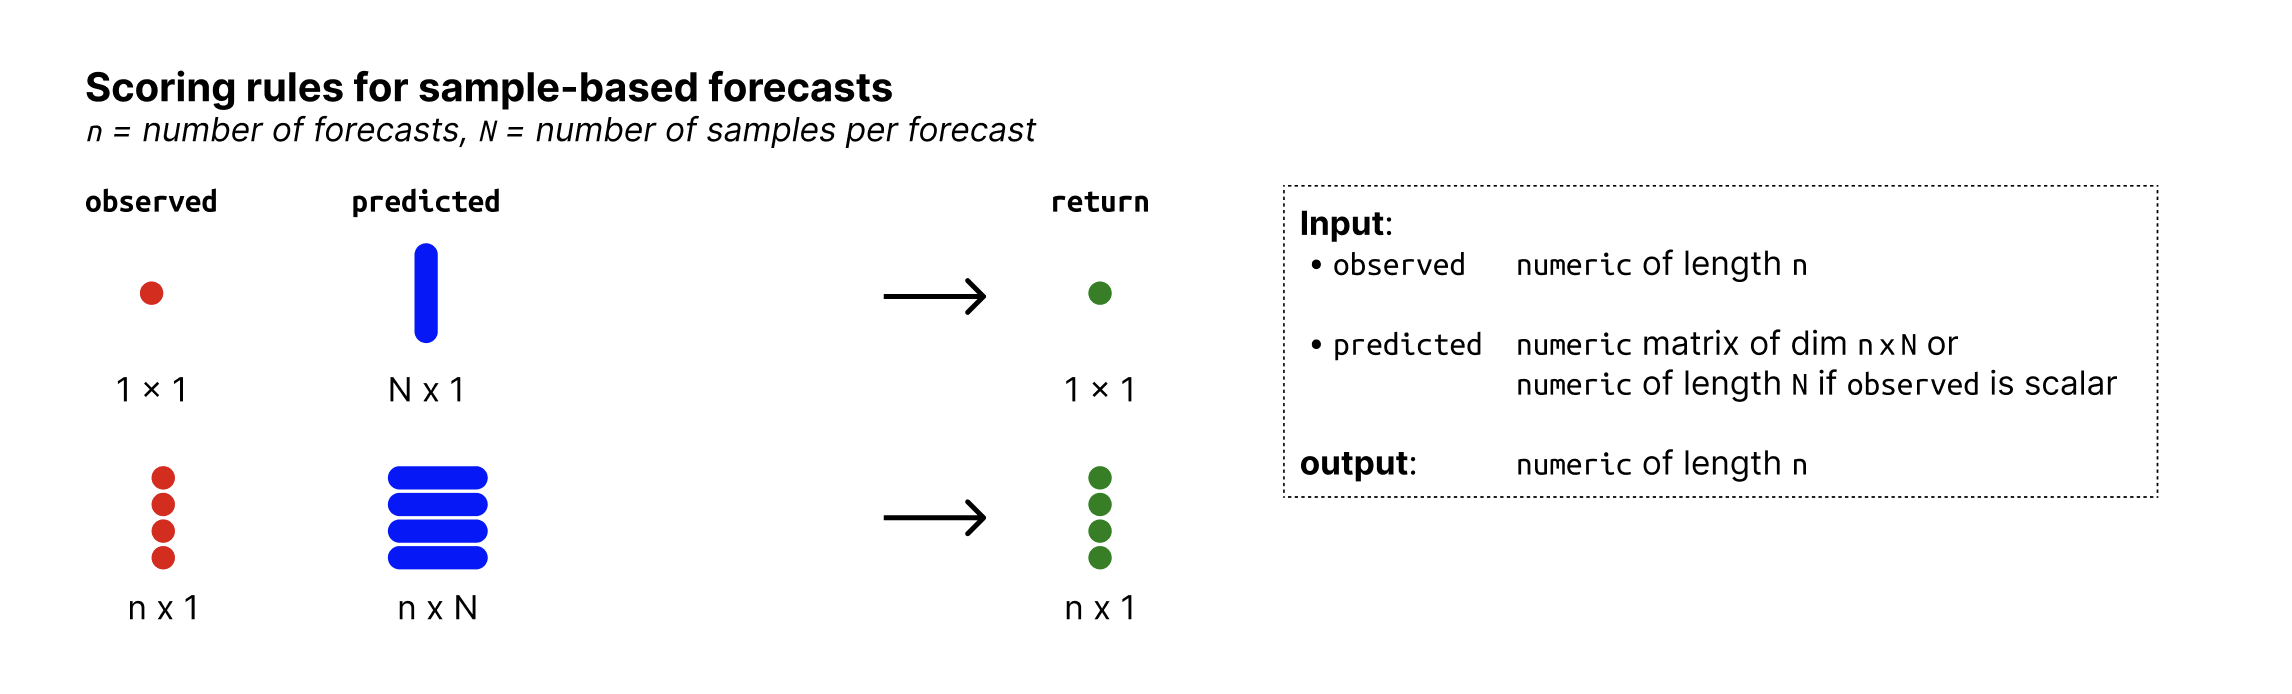
- observed
A vector with observed values of size n
- predicted
nxN matrix of predictive samples, n (number of rows) being the number of data points and N (number of columns) the number of Monte Carlo samples. Alternatively, if n = 1,
predictedcan just be a vector of size n.- ...
Additional arguments passed to logs_sample() from the scoringRules package.
References
Alexander Jordan, Fabian Krüger, Sebastian Lerch, Evaluating Probabilistic Forecasts with scoringRules, https://www.jstatsoft.org/article/view/v090i12
See also
Other log score functions:
logs_categorical(),
scoring-functions-binary
Examples
observed <- rnorm(30, mean = 1:30)
predicted <- replicate(200, rnorm(30, mean = 1:30))
logs_sample(observed, predicted)
#>  [1] 2.4489536 3.7116350 1.0862273 1.1940239 1.2253578 1.2076263 1.0916030
#>  [8] 1.3492135 1.1224192 0.8611935 1.2755833 1.4257878 1.4456369 1.9480844
#> [15] 1.0418232 0.9733666 1.4392295 1.1437437 1.9639265 0.8770563 1.0327465
#> [22] 1.3654438 3.3944156 1.5085371 1.4531986 1.0920996 1.0067286 0.9989672
#> [29] 1.9040067 2.8640134