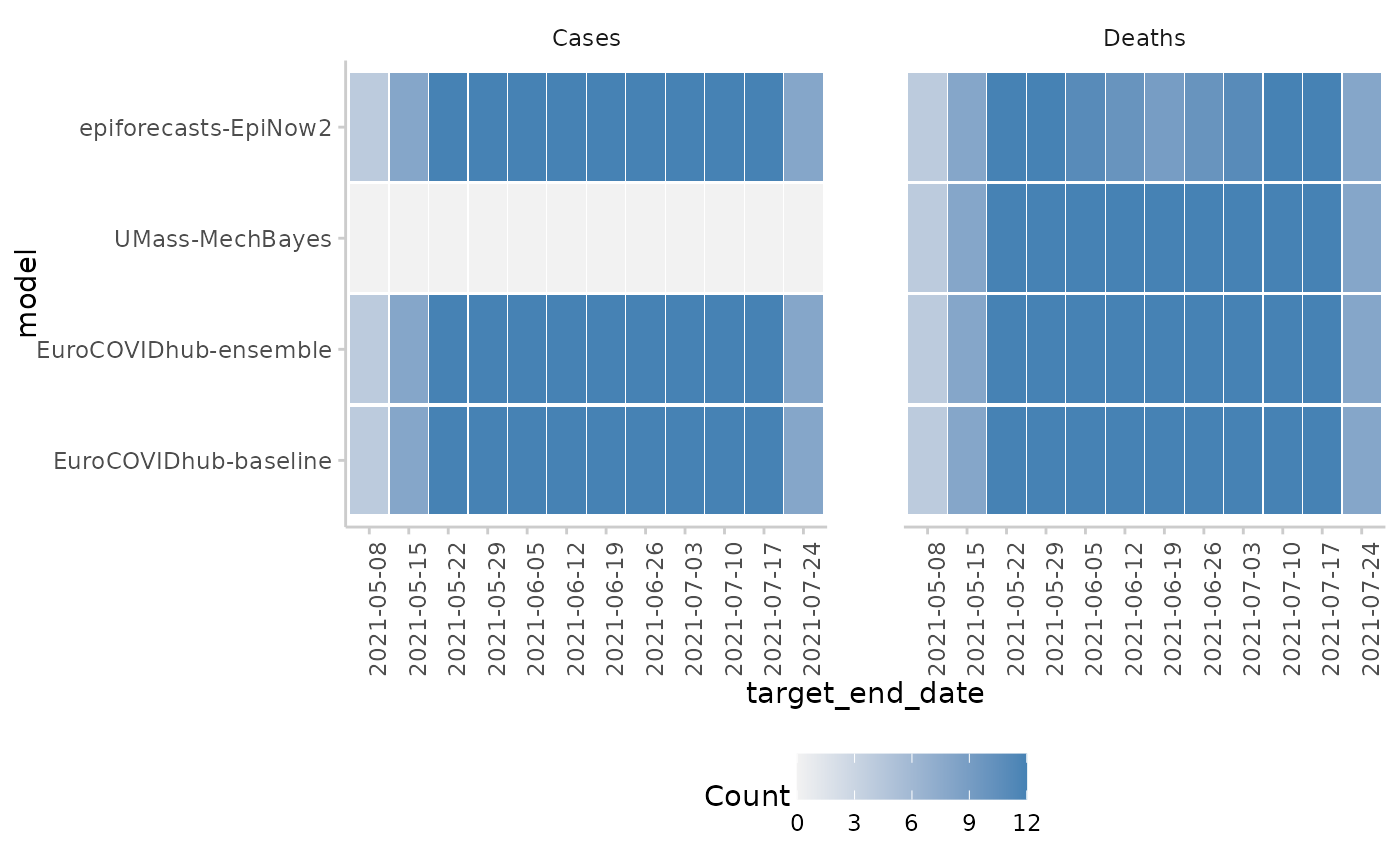
Visualise Where Forecasts Are Available.
Usage
plot_forecast_counts(
  forecast_counts,
  x,
  y = "model",
  x_as_factor = TRUE,
  show_counts = TRUE
)
Arguments
- forecast_counts
A data.table (or similar) with a column
countholding forecast counts, as produced byget_forecast_counts().- x
Character vector of length one that denotes the name of the column to appear on the x-axis of the plot.
- y
Character vector of length one that denotes the name of the column to appear on the y-axis of the plot. Default is "model".
- x_as_factor
Logical (default is
TRUE). Whether or not to convert the variable on the x-axis to a factor. This has an effect e.g. if dates are shown on the x-axis.- show_counts
Logical (default is
TRUE) that indicates whether or not to show the actual count numbers on the plot.
Examples
library(ggplot2)
forecast_counts <- example_quantile |>
  as_forecast_quantile() |>
  get_forecast_counts(by = c("model", "target_type", "target_end_date"))
#> ℹ Some rows containing NA values may be removed. This is fine if not
#>   unexpected.
plot_forecast_counts(
 forecast_counts, x = "target_end_date", show_counts = FALSE
) +
 facet_wrap("target_type")