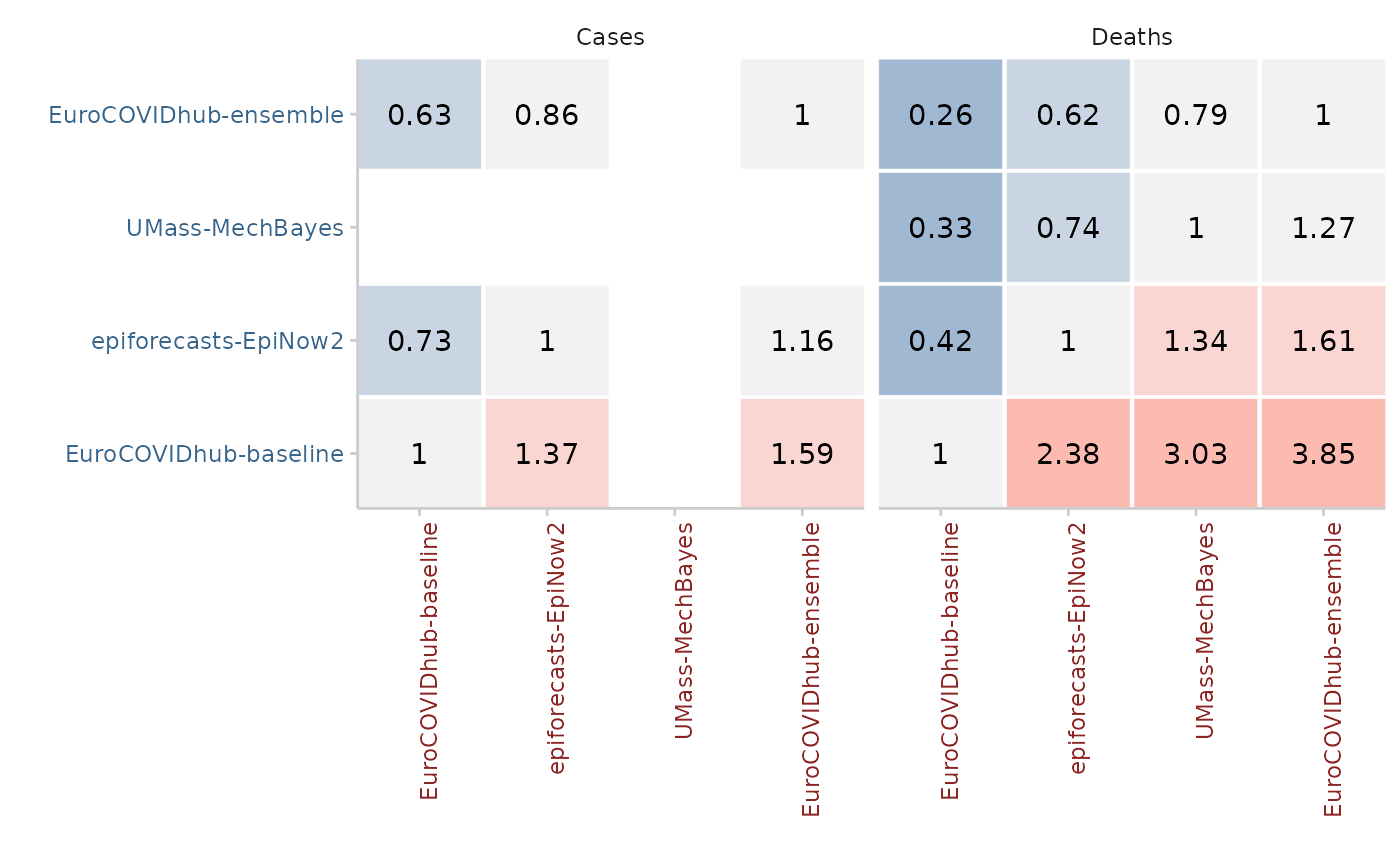
Compute relative scores between different models making pairwise
comparisons. Pairwise comparisons are a sort of pairwise tournament where all
combinations of two models are compared against each other based on the
overlapping set of available forecasts common to both models.
Internally, a ratio of the mean scores of both models is computed.
The relative score of a model is then the geometric mean of all mean score
ratios which involve that model. When a baseline is provided, then that
baseline is excluded from the relative scores for individual models
(which therefore differ slightly from relative scores without a baseline)
and all relative scores are scaled by (i.e. divided by) the relative score of
the baseline model.
Usually, the function input should be unsummarised scores as
produced by score().
Note that the function internally infers the unit of a single forecast by
determining all columns in the input that do not correspond to metrics
computed by score(). Adding unrelated columns will change results in an
unpredictable way.
The code for the pairwise comparisons is inspired by an implementation by
Johannes Bracher.
The implementation of the permutation test follows the function
permutationTest from the surveillance package by Michael Höhle,
Andrea Riebler and Michaela Paul.
Arguments
- scores
A data.table of scores as produced by
score().- by
character vector with names of columns present in the input data.frame.
bydetermines how pairwise comparisons will be computed. You will get a relative skill score for every grouping level determined inby. If, for example,by = c("model", "location"). Then you will get a separate relative skill score for every model in every location. Internally, the data.frame will be split accordingby(but removing "model" before splitting) and the pairwise comparisons will be computed separately for the split data.frames.- metric
A character vector of length one with the metric to do the comparison on. The default is "auto", meaning that either "interval_score", "crps", or "brier_score" will be selected where available. See
available_metrics()for available metrics.- baseline
character vector of length one that denotes the baseline model against which to compare other models.
- ...
additional arguments for the comparison between two models. See
compare_two_models()for more information.
Examples
# \dontshow{
  data.table::setDTthreads(2) # restricts number of cores used on CRAN
# }

scores <- score(example_quantile)
#> The following messages were produced when checking inputs:
#> 1.  144 values for `prediction` are NA in the data provided and the corresponding rows were removed. This may indicate a problem if unexpected.
pairwise <- pairwise_comparison(scores, by = "target_type")

library(ggplot2)
plot_pairwise_comparison(pairwise, type = "mean_scores_ratio") +
  facet_wrap(~target_type)