Forecasts
Every release forecasts each DRC stream a week ahead from the joint posterior, as the one-week-ahead forecast Methods section describes. How these forecasts have scored against the data that arrived afterwards is on the evaluation page. The split by province is on the province forecasts page and the split by health zone on the health-zone forecasts page.
Load packages, data and fitted chains
# Shared setup: packages, observations and the fit registry. See
# `docs/pages/_setup.jl`.
using BVDOutbreakSize
include(joinpath(pkgdir(BVDOutbreakSize), "docs", "pages", "_setup.jl"))
validation_forecast_from (generic function with 1 method)# The fits this page reads, loaded from the cache here.
chn_joint = load_fit("joint");Summary
These are the expected counts for the week after the cut-off.
Generate the one-week-ahead forecast
forecast = forecast_reported(
    fit_forecast("joint");
    horizon = 7,
    obs_cases = obs.reported_cases,
    obs_deaths = obs.total_deaths,
    obs_confirmed = obs.confirmed_cases,
    obs_confirmed_deaths = obs.confirmed_deaths,
    obs_recovered = obs.recovered_cases
);
forecast_week_end = obs.cutoff + Day(7);
national_forecast_bullets = join(
    [
        "- **Confirmed cases:** $(median_interval_text(forecast.confirmed_new)) new laboratory-confirmed cases in the week to $(forecast_week_end).",
        "- **Confirmed deaths:** $(median_interval_text(forecast.confirmed_deaths_new)) new confirmed deaths over the same week.",
        "- **Infections:** $(median_interval_text(forecast.infections_new)) new infections, reported and unreported.",
        "- **Reproduction number:** $(median_interval_text(forecast.rt_forecast; digits = 2)) on $(forecast_week_end).",
    ], "\n"
);
Confirmed cases: about 511 (90% credible interval 369 to 703) new laboratory-confirmed cases in the week to 2026-11-08.
Confirmed deaths: about 252 (90% credible interval 195 to 327) new confirmed deaths over the same week.
Infections: about 981 (90% credible interval 502 to 1973) new infections, reported and unreported.
Reproduction number: about 1.04 (90% credible interval 0.75 to 1.49) on 2026-11-08.
One-week-ahead forecast results
Summarise the one-week-ahead forecast
forecast_summary = forecast_table(forecast);| Row | Stream | Quantity | Lower 90% | Lower 60% | Lower 30% | Upper 30% | Upper 60% | Upper 90% |
|---|---|---|---|---|---|---|---|---|
| String | String | Float64 | Float64 | Float64 | Float64 | Float64 | Float64 | |
| 1 | DRC confirmed cases | cumulative by T+7 | 10901.0 | 10960.0 | 11005.0 | 11081.0 | 11131.0 | 11235.0 |
| 2 | DRC confirmed cases | new this week | 369.0 | 428.0 | 473.0 | 549.0 | 599.0 | 703.0 |
| 3 | DRC confirmed deaths | cumulative by T+7 | 5321.0 | 5348.0 | 5364.0 | 5393.0 | 5413.0 | 5453.0 |
| 4 | DRC confirmed deaths | new this week | 195.0 | 222.0 | 238.0 | 267.0 | 287.0 | 327.0 |
| 5 | DRC isolation beds | demand at T+7 | 858.0 | 951.0 | 1007.0 | 1116.0 | 1191.0 | 1345.0 |
| 6 | DRC isolation beds | occupancy at T+7 | 626.0 | 745.0 | 808.0 | 921.0 | 998.0 | 1135.0 |
| 7 | DRC isolation admissions | daily at T+7 | 84.0 | 109.0 | 131.0 | 171.0 | 199.0 | 262.0 |
| 8 | DRC in-care deaths | daily at T+7 | 10.0 | 15.0 | 18.0 | 24.0 | 29.0 | 38.0 |
| 9 | DRC isolation rule-outs | daily at T+7 | 62.0 | 83.0 | 96.0 | 123.0 | 140.0 | 181.0 |
| 10 | DRC recovered among confirmed | cumulative by T+7 | 2953.0 | 2972.0 | 2983.0 | 3005.0 | 3018.0 | 3043.0 |
| 11 | DRC recovered among confirmed | new this week | 119.0 | 138.0 | 149.0 | 171.0 | 184.0 | 209.0 |
One-week-ahead latent forecast plot
forecast_latent_fig = plot_forecast_latent(forecast);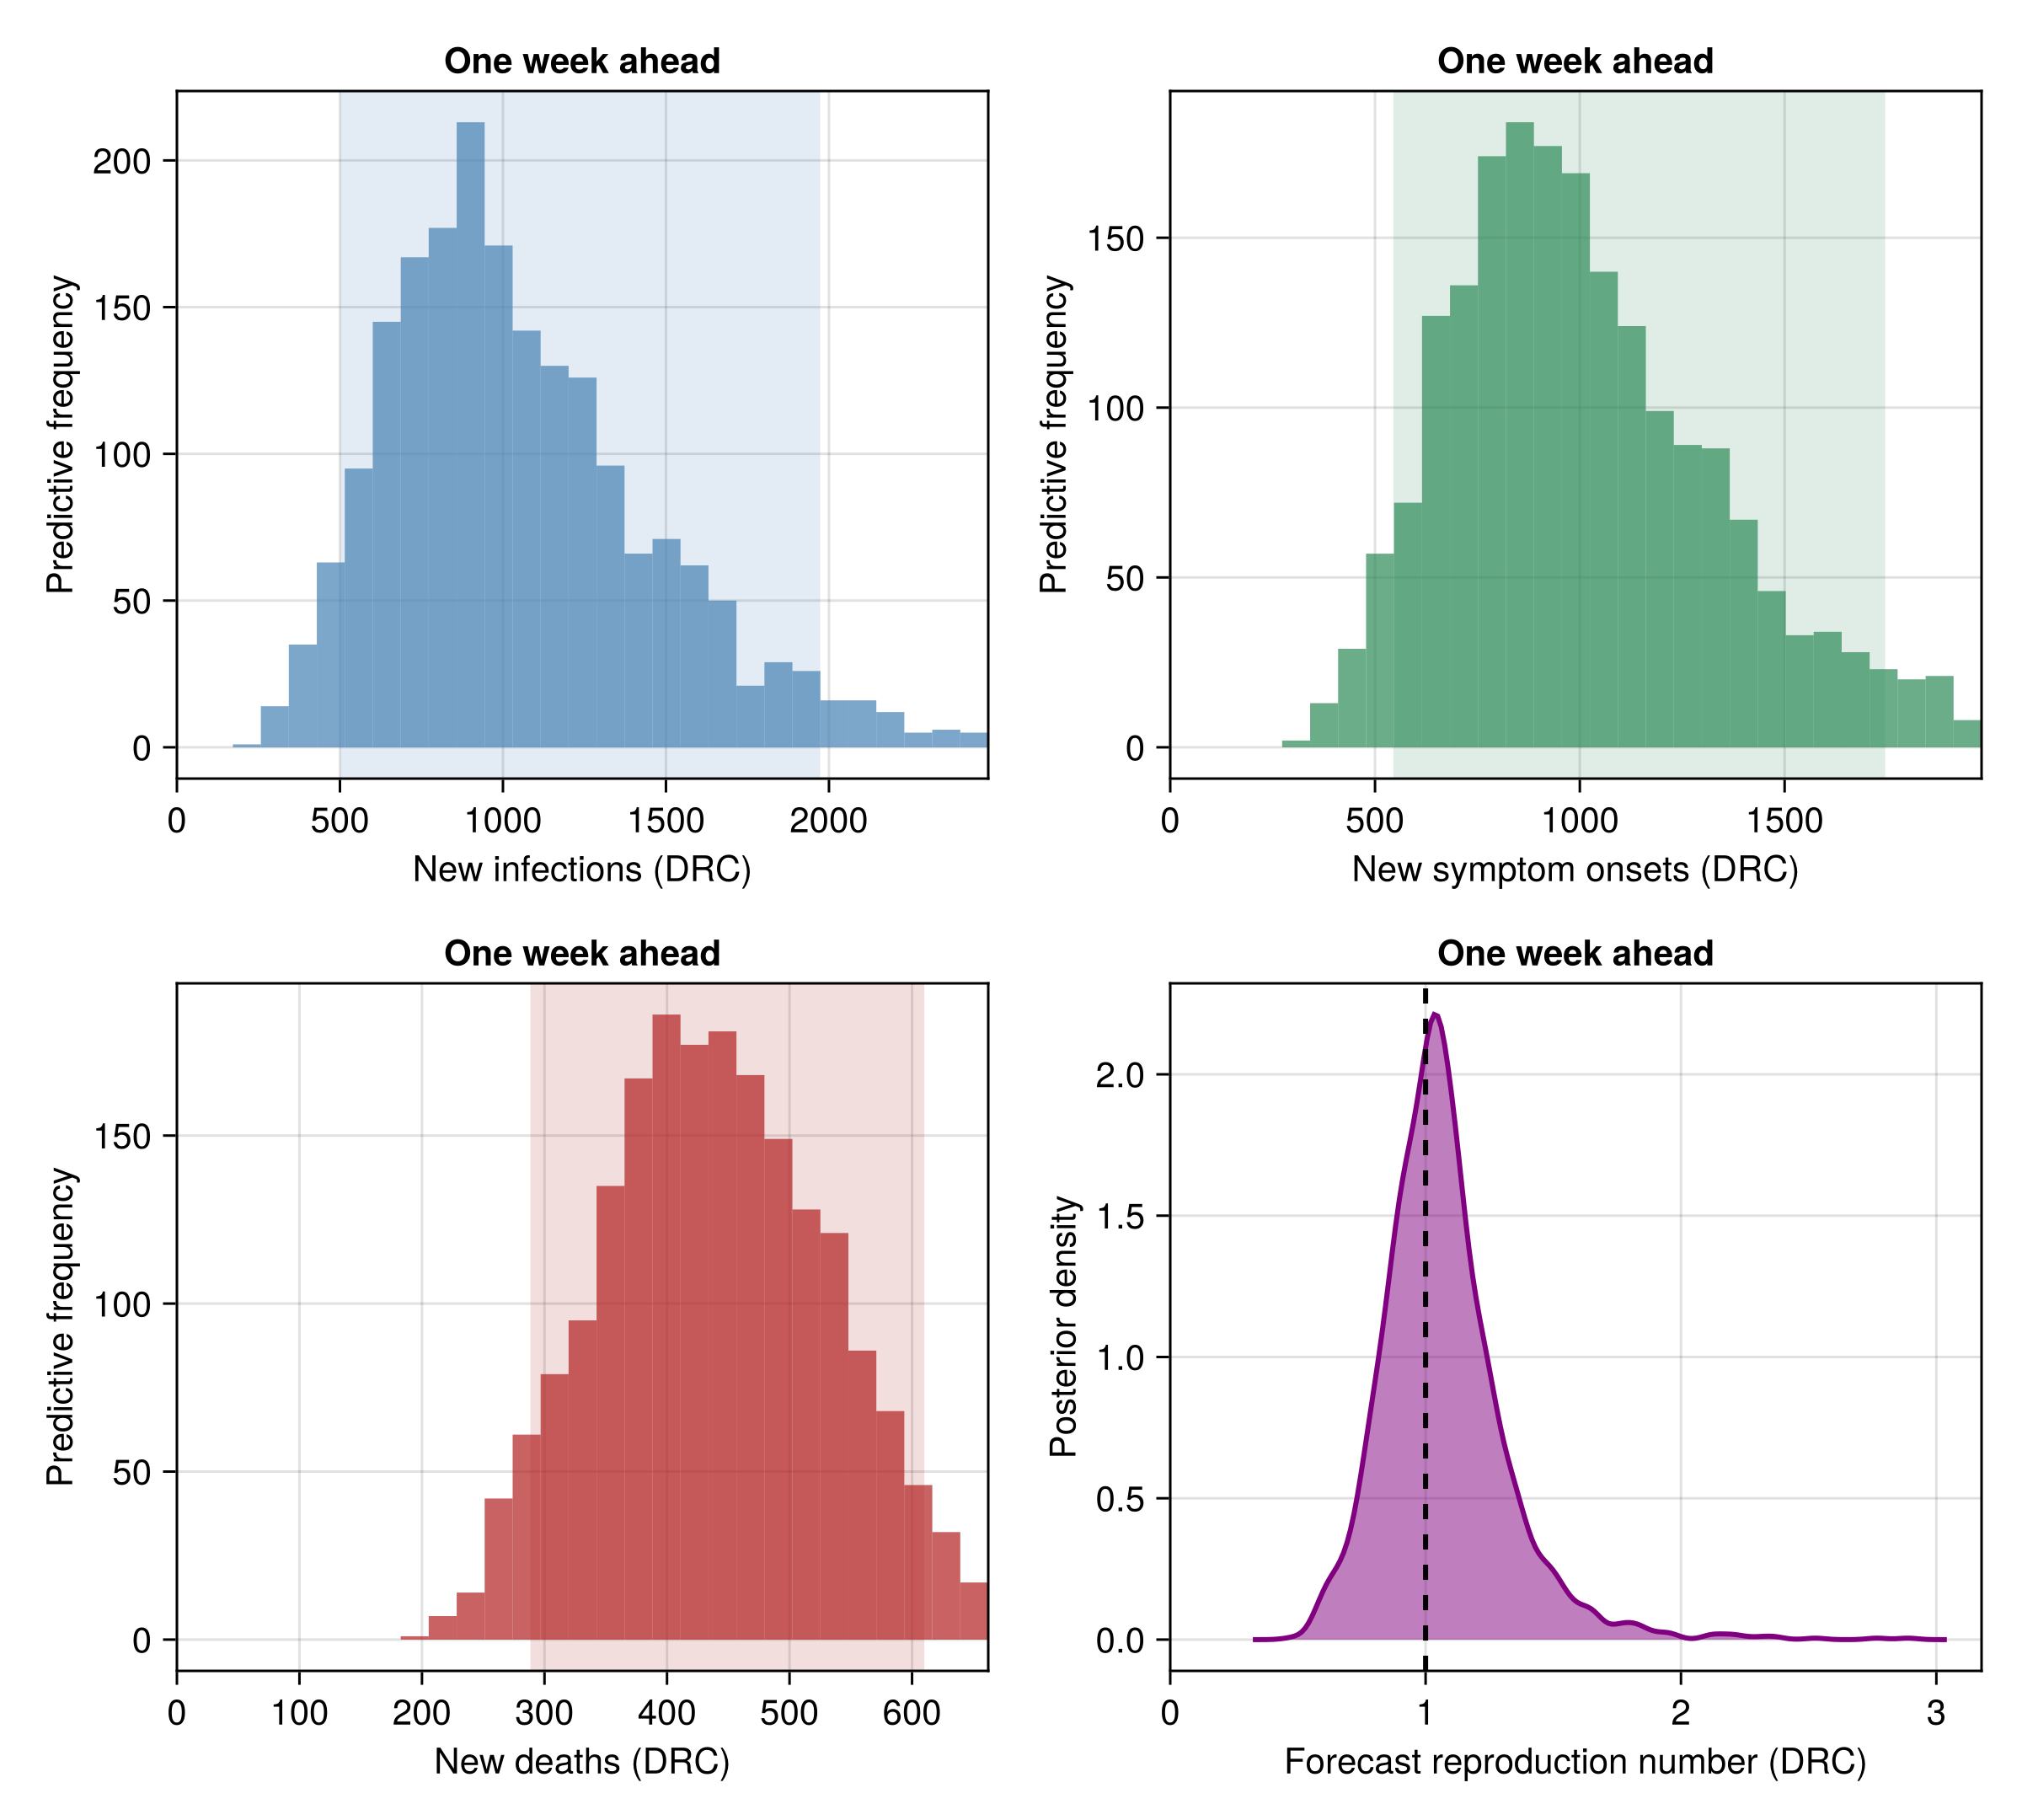
One-week-ahead observed forecast plot
forecast_fig = plot_forecast(forecast);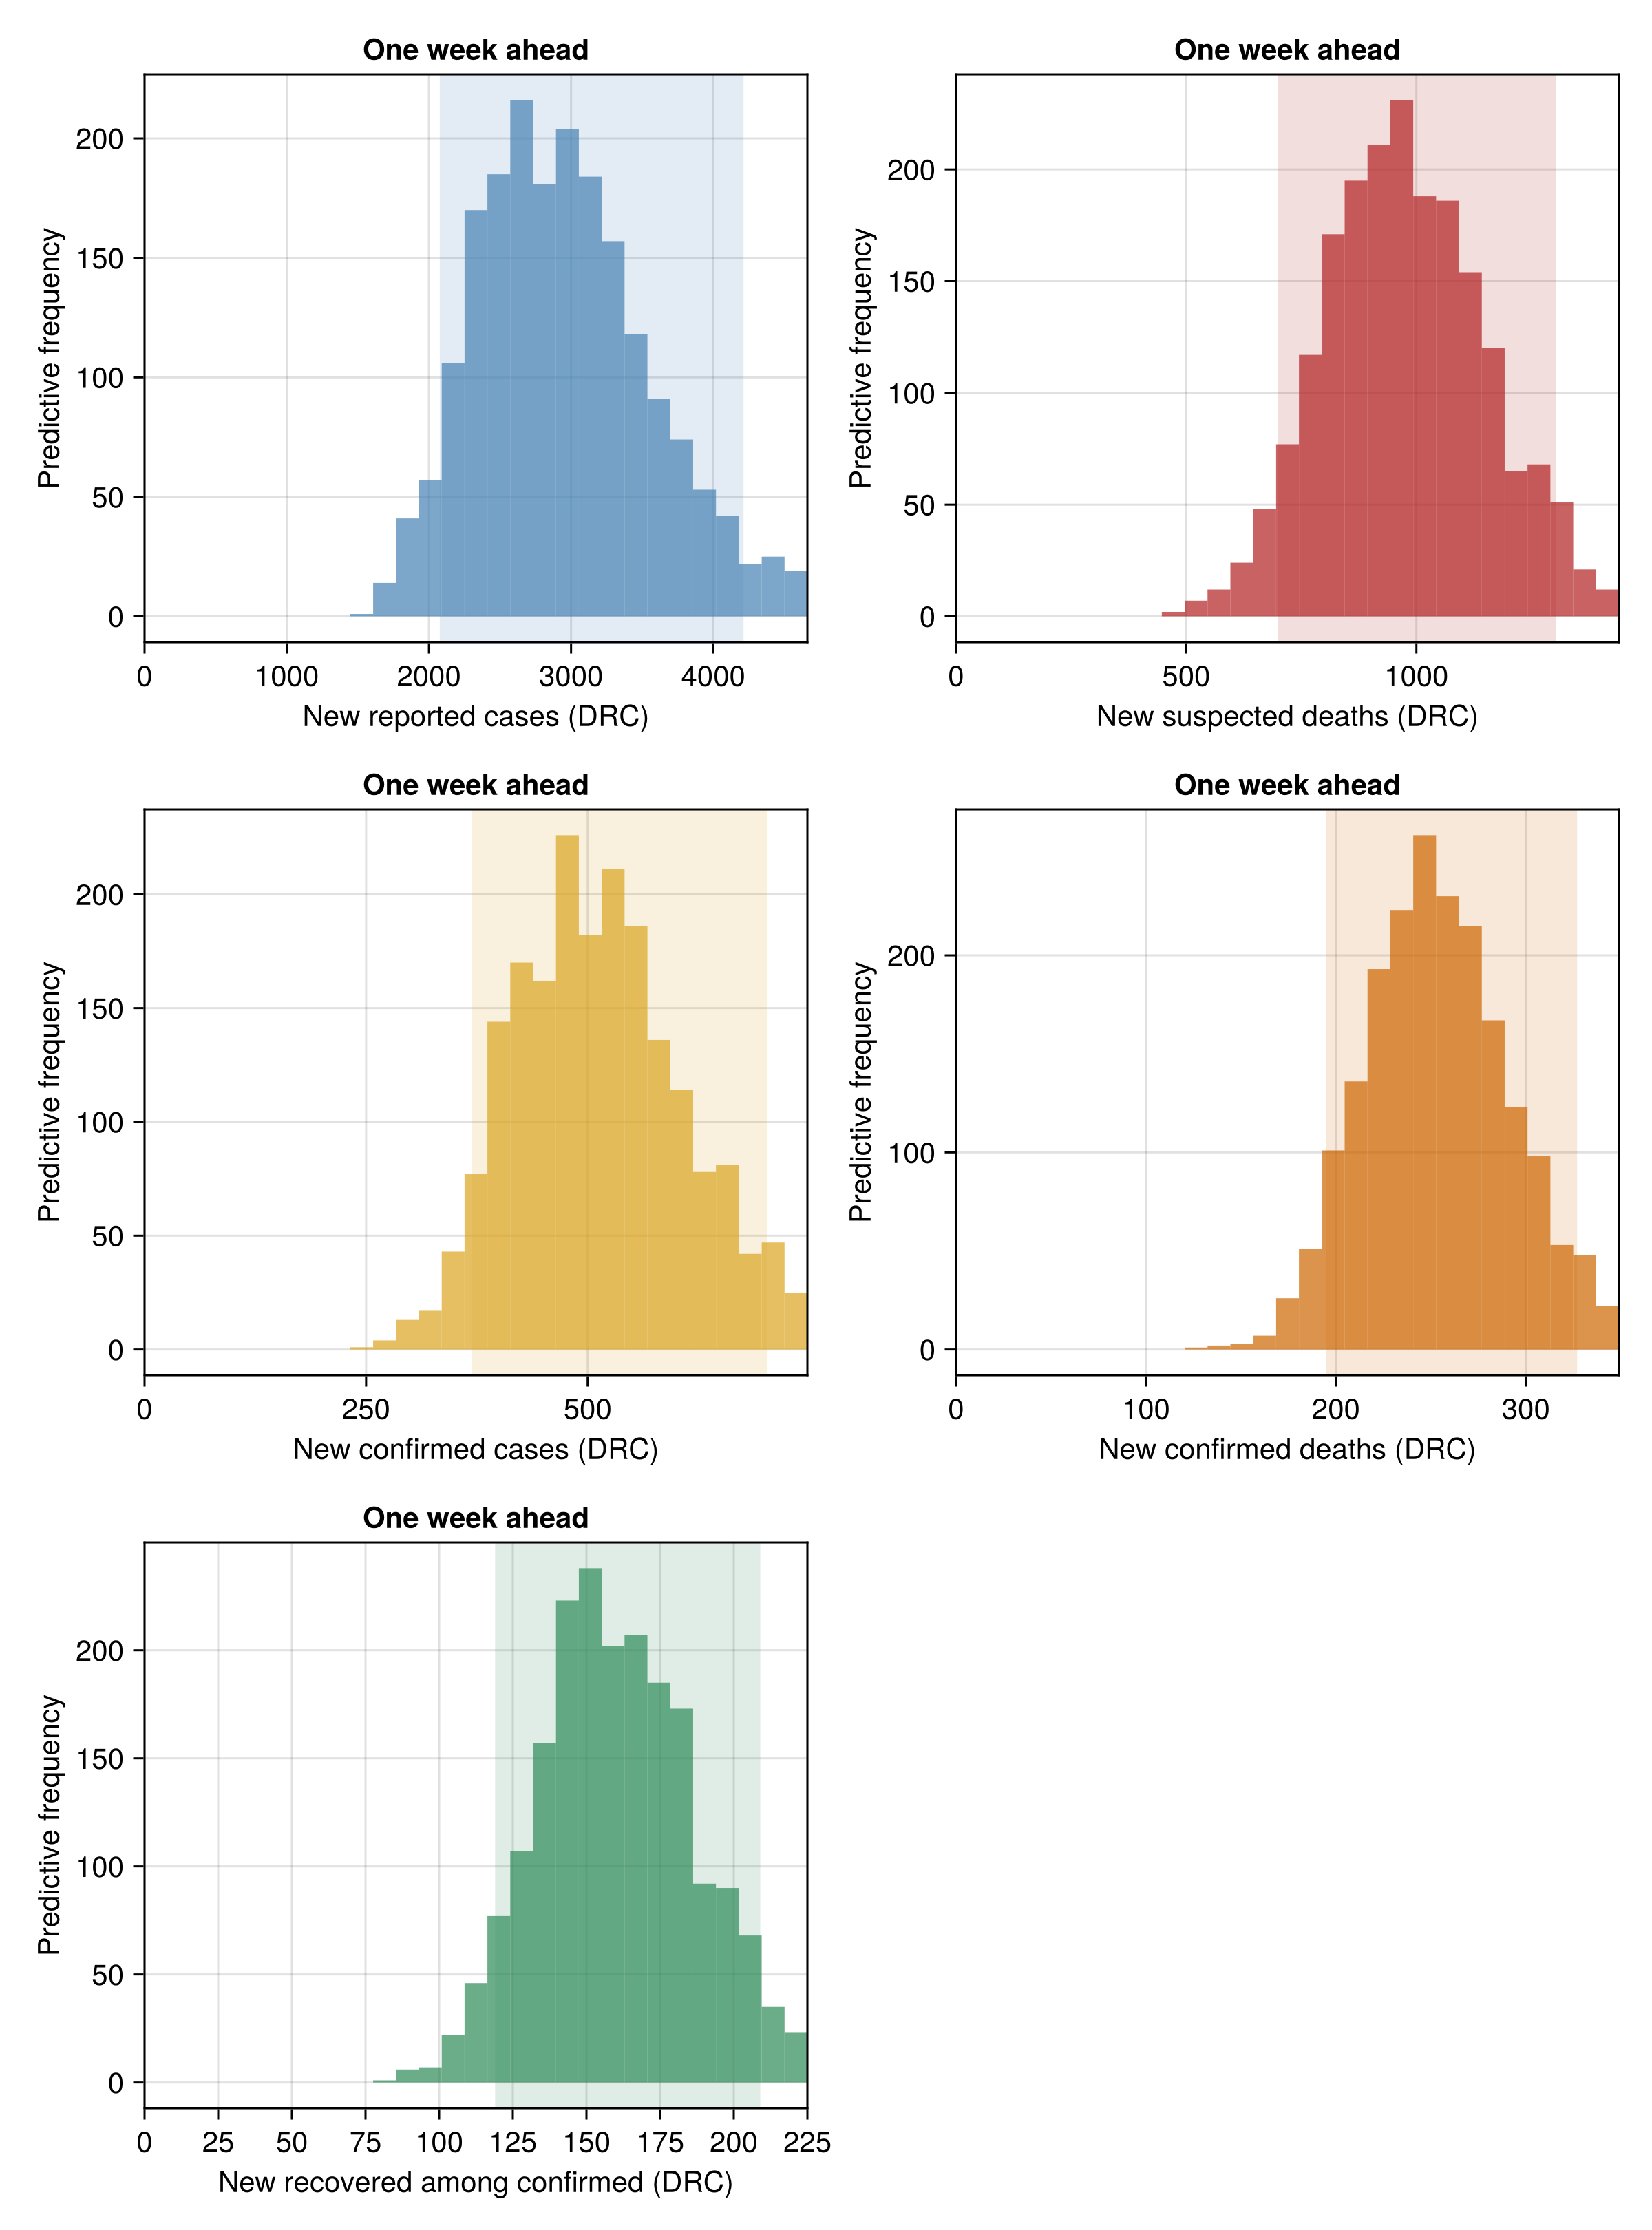
Bed demand is defined in the treatment-centre flow Methods section. The national occupancy is censored at the national beds, so the national shortfall understates local unmet need (see limitations).
One-week-ahead isolation-bed forecast plot
forecast_beds_fig = plot_forecast_beds(forecast);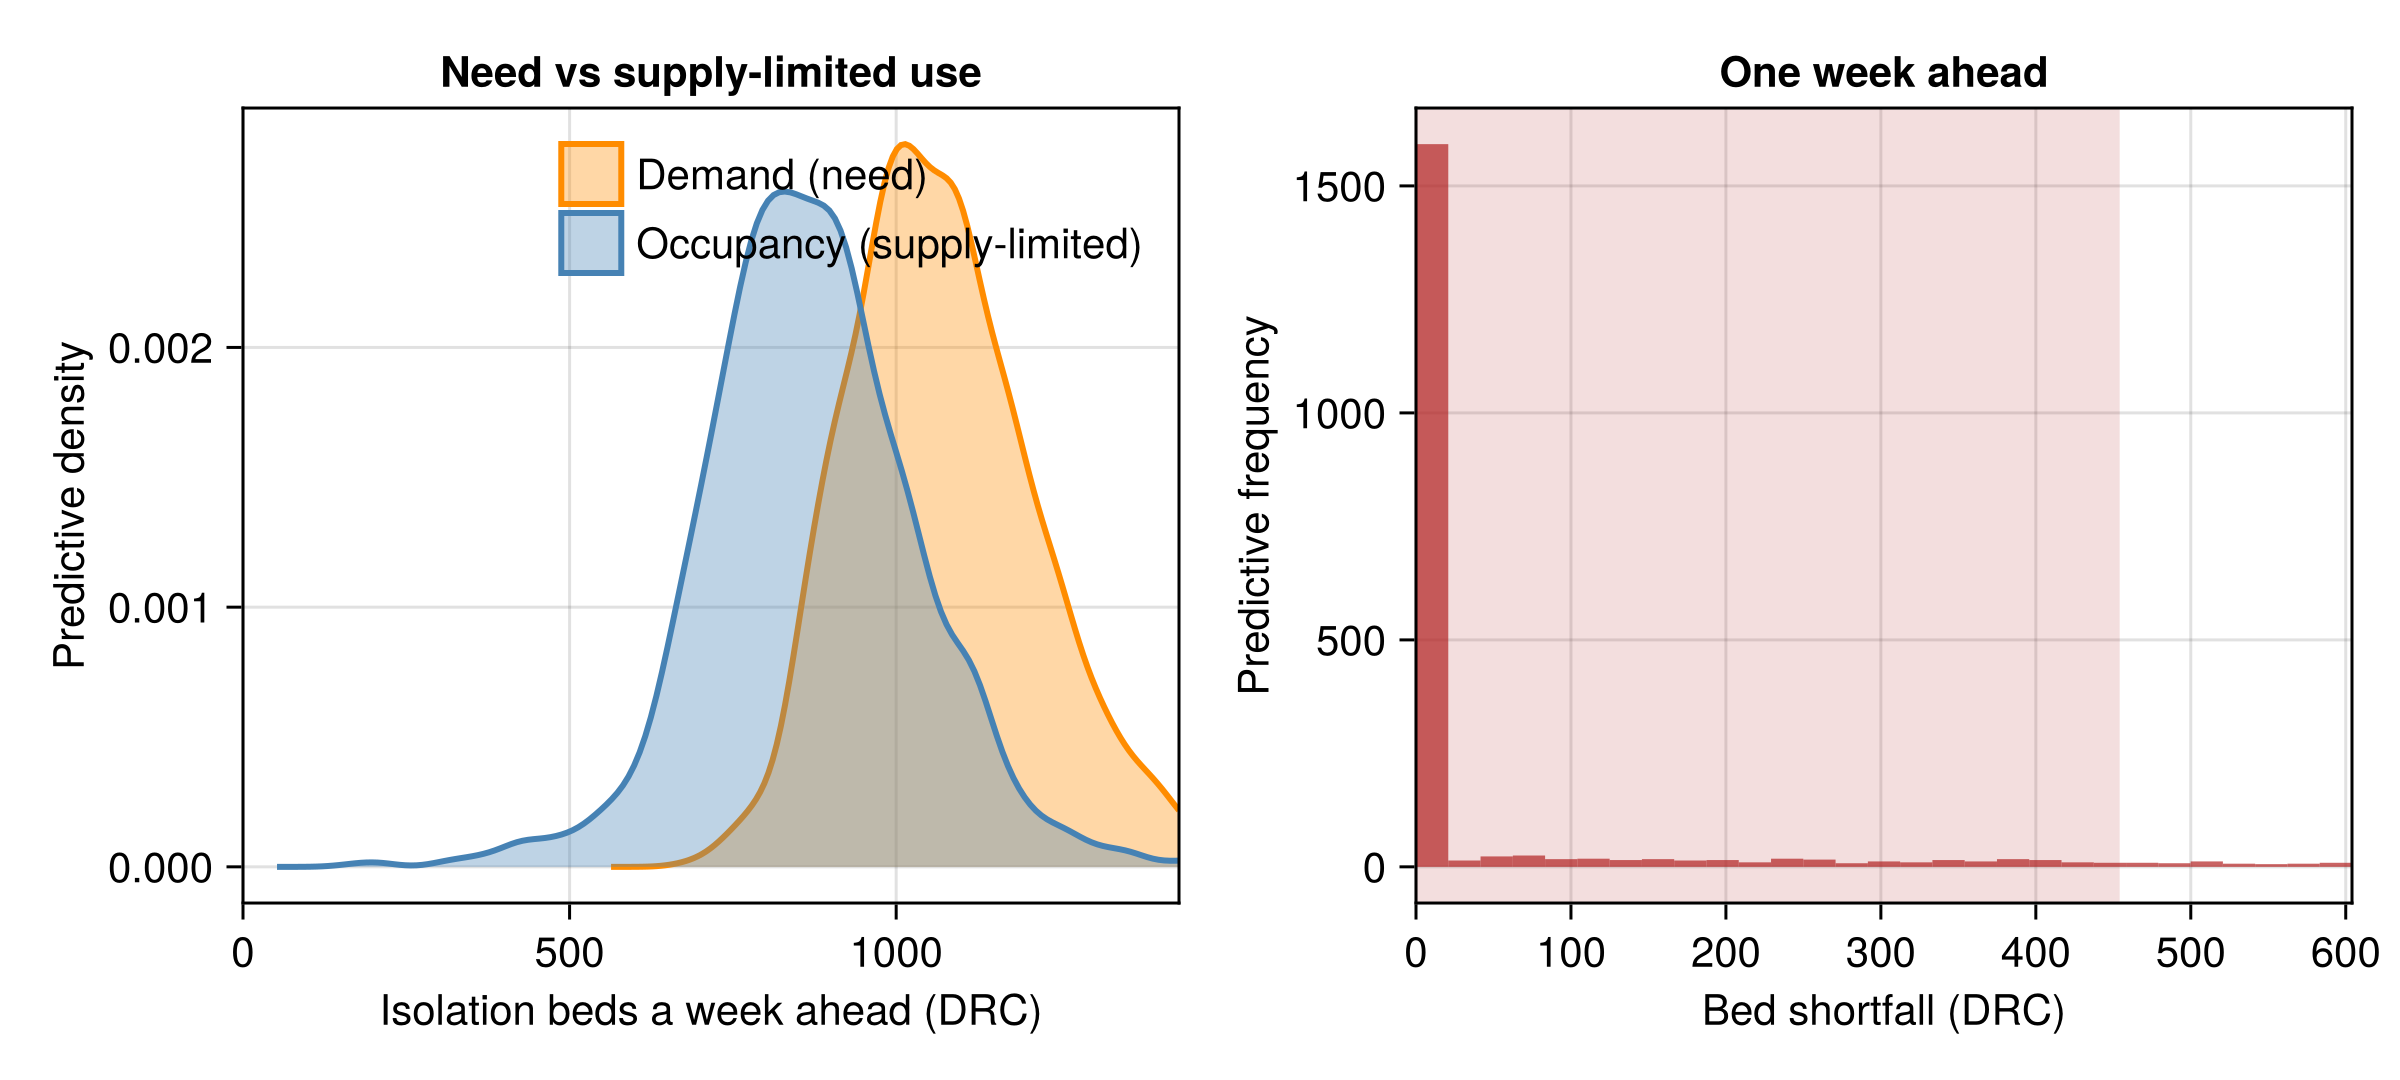
One-week-ahead treatment-flow forecast plot
forecast_flows_fig = plot_forecast_flows(forecast);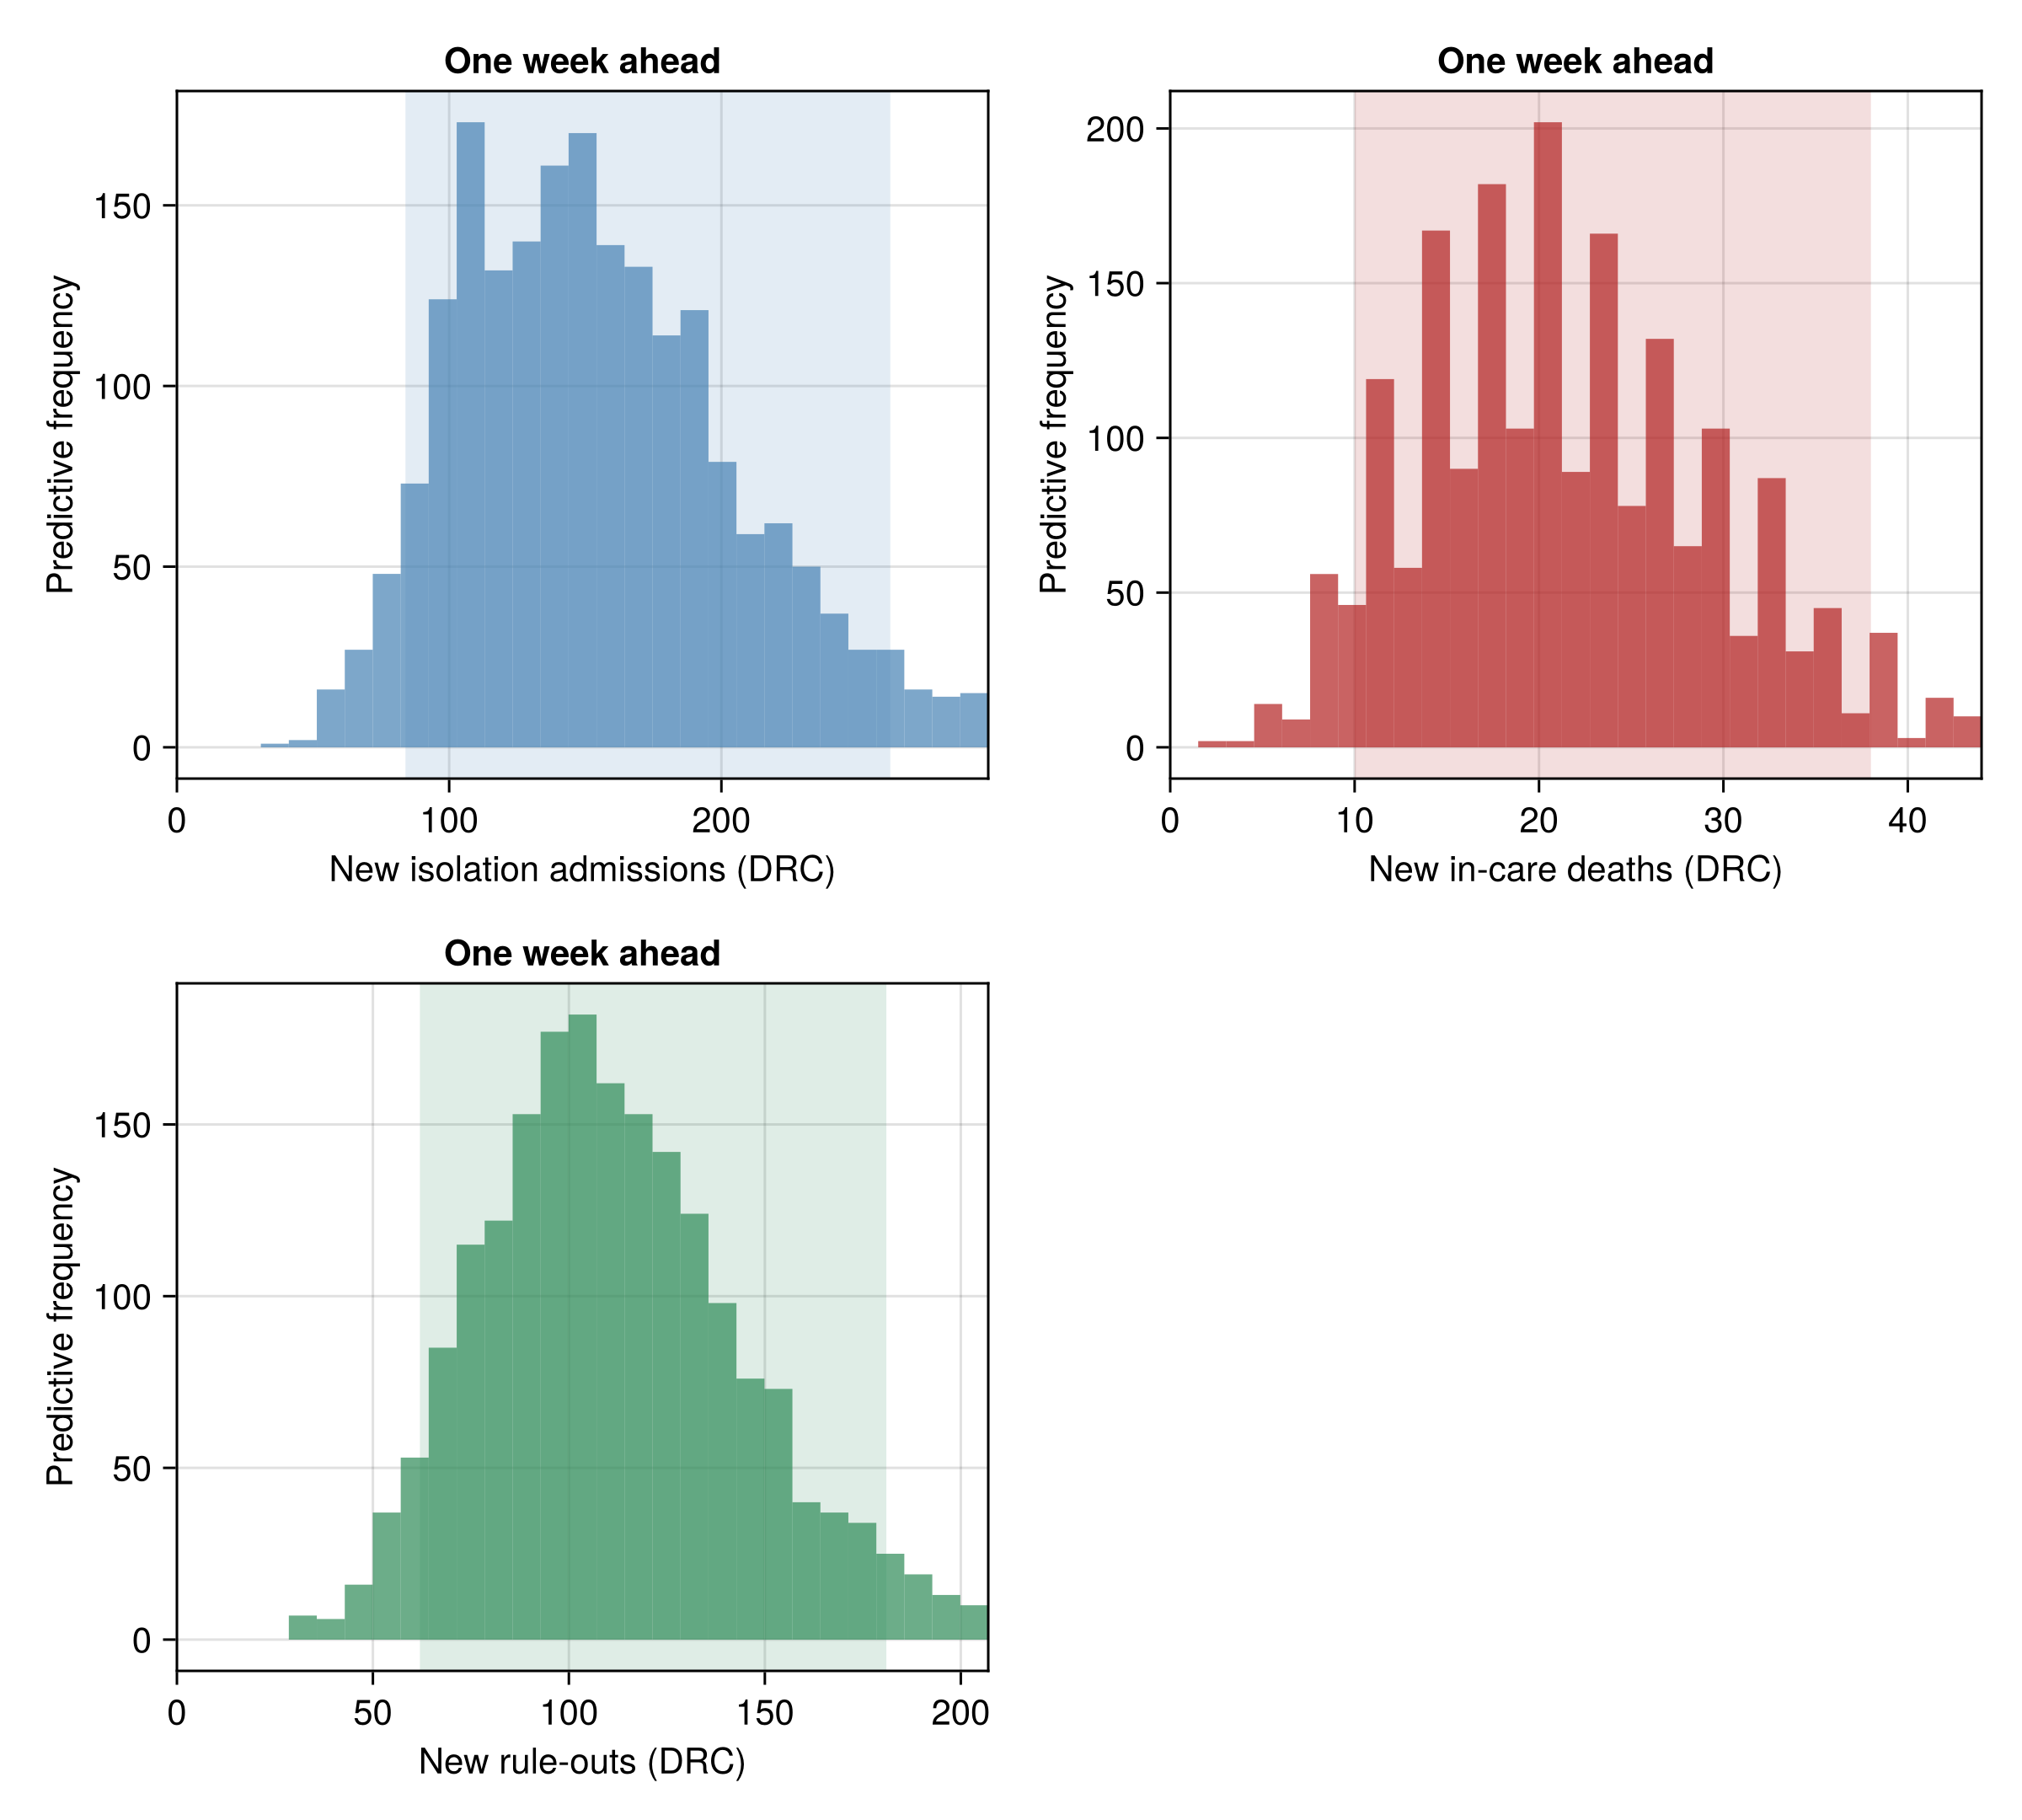
Symptom-onset nowcast and forecast results
The symptom-onset nowcast and forecast Methods section describes how the onset projection is built.
Generate the symptom-onset nowcast and forecast
onset_forecast = forecast_onsets(
    fit_forecast("joint");
    horizon = 7,
    obs_value = something(obs.onset_curve_history.last_total, 0)
);
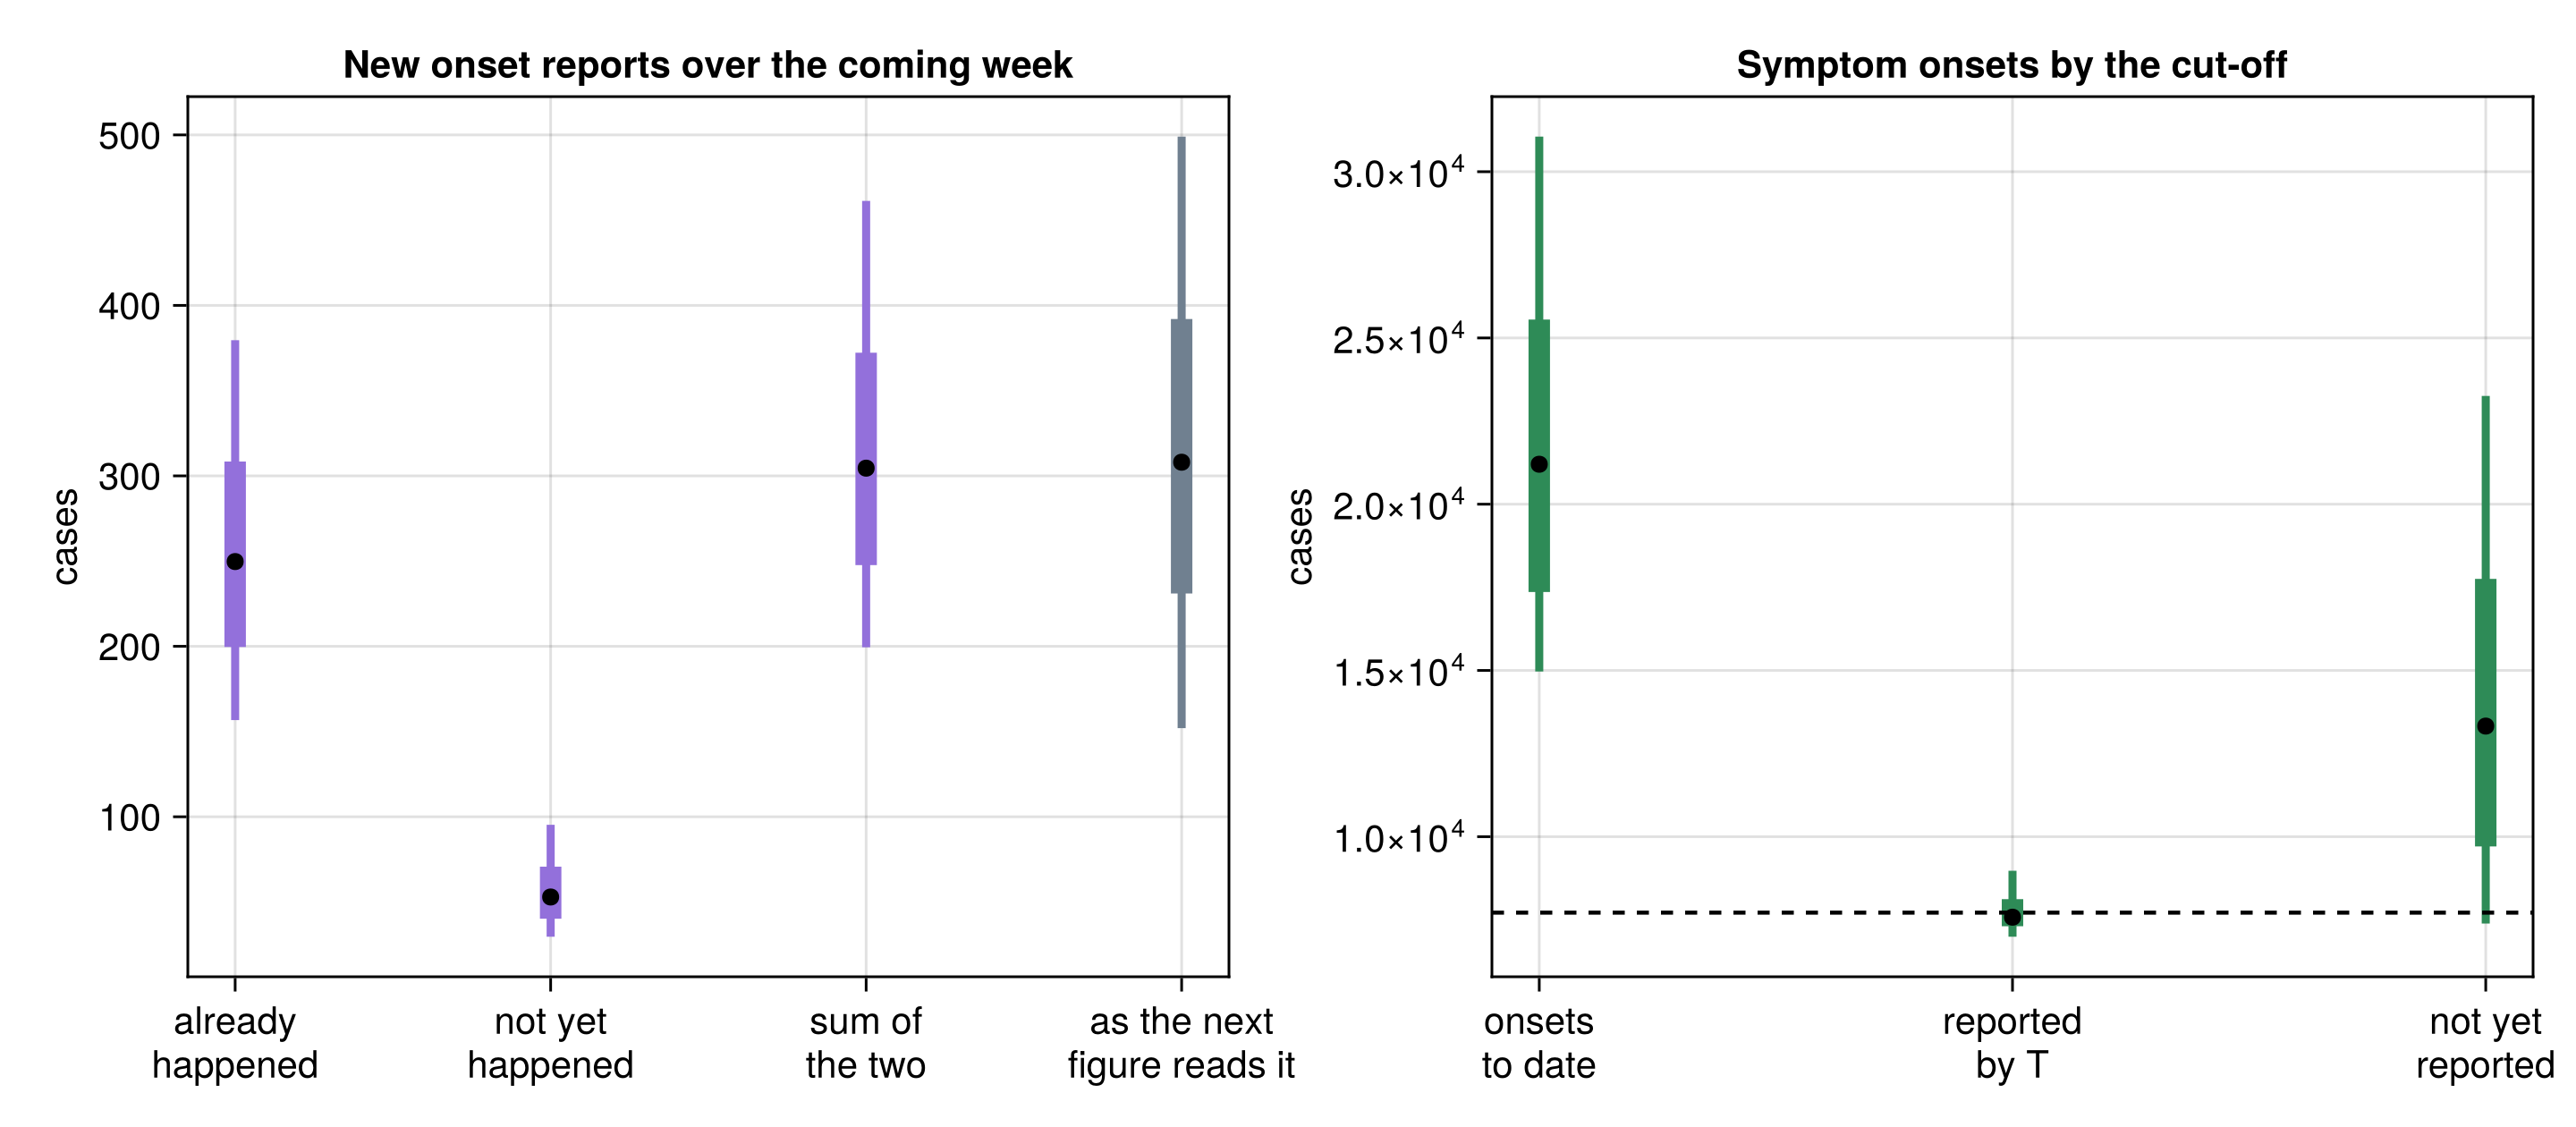
onset_forecast_summary = onset_forecast_table(onset_forecast);| Row | Quantity | Lower 90% | Lower 60% | Lower 30% | Upper 30% | Upper 60% | Upper 90% |
|---|---|---|---|---|---|---|---|
| String | Float64 | Float64 | Float64 | Float64 | Float64 | Float64 | |
| 1 | symptom onsets to date | 14969.0 | 17359.0 | 19314.0 | 23046.0 | 25553.0 | 31055.0 |
| 2 | of those, reported by T | 6991.0 | 7307.0 | 7442.0 | 7751.0 | 8120.0 | 8974.0 |
| 3 | onsets not yet reported at T | 7386.0 | 9706.0 | 11677.0 | 15280.0 | 17754.0 | 23256.0 |
| 4 | reports this week of onsets before T | 157.0 | 200.0 | 226.0 | 276.0 | 308.0 | 380.0 |
| 5 | reports this week of onsets after T | 30.0 | 40.0 | 47.0 | 60.0 | 71.0 | 95.0 |
| 6 | new onset reports this week | 152.0 | 231.0 | 272.0 | 346.0 | 392.0 | 499.0 |
| 7 | new symptom onsets this week | 545.0 | 732.0 | 853.0 | 1104.0 | 1306.0 | 1745.0 |
"Onsets not yet reported at T" is not a backlog that will all arrive, because ascertainment does not reach one. It holds both the reporting backlog and the cases surveillance will never confirm. The smaller "reports this week of onsets before T" row is the part the coming week should clear.
Symptom-onset nowcast and forecast plot
onset_forecast_fig = let
    fig = CairoMakie.Figure(; size = (960, 420))
    # Two-line tick labels rather than rotated ones: the leftmost rotated
    # label overhangs the axis and is clipped at the figure edge.
    ax1 = CairoMakie.Axis(
        fig[1, 1];
        title = "New onset reports over the coming week",
        ylabel = "cases", xticks = (
            1:4,
            [
                "already\nhappened", "not yet\nhappened", "sum of\nthe two",
                "as the next\nfigure reads it",
            ],
        )
    )
    # The first three bars are latent, so the third is exactly the first
    # two added. The fourth is that same sum replicated through the
    # observation model, which is the scored quantity and the only one
    # comparable to a digitised figure; it is wider by the read error,
    # which is why the three latent bars are shown as well rather than a
    # decomposition that appears not to add up.
    _latent_total = onset_forecast.onset_reports_backfill .+
        onset_forecast.onset_reports_future
    for (i, d, col) in (
            (
                1, onset_forecast.onset_reports_backfill,
                :mediumpurple,
            ),
            (2, onset_forecast.onset_reports_future, :mediumpurple),
            (3, _latent_total, :mediumpurple),
            (4, Float64.(onset_forecast.onset_reports_new), :slategray),
        )
        s = posterior_summary(d)
        CairoMakie.rangebars!(
            ax1, [Float64(i)], [s.lo90], [s.hi90];
            color = col, linewidth = 3
        )
        CairoMakie.rangebars!(
            ax1, [Float64(i)], [s.lo60], [s.hi60];
            color = col, linewidth = 8
        )
        CairoMakie.scatter!(
            ax1, [Float64(i)], [quantile(d, 0.5)];
            color = :black, markersize = 9
        )
    end
    ax2 = CairoMakie.Axis(
        fig[1, 2];
        title = "Symptom onsets by the cut-off",
        ylabel = "cases", xticks = (
            1:3,
            ["onsets\nto date", "reported\nby T", "not yet\nreported"],
        )
    )
    for (i, d) in enumerate(
            (
                onset_forecast.onsets_to_date,
                onset_forecast.onset_reports_to_date,
                onset_forecast.onsets_unreported,
            )
        )
        s = posterior_summary(d)
        CairoMakie.rangebars!(
            ax2, [Float64(i)], [s.lo90], [s.hi90];
            color = :seagreen, linewidth = 3
        )
        CairoMakie.rangebars!(
            ax2, [Float64(i)], [s.lo60], [s.hi60];
            color = :seagreen, linewidth = 8
        )
        CairoMakie.scatter!(
            ax2, [Float64(i)], [quantile(d, 0.5)];
            color = :black, markersize = 9
        )
    end
    # The digitised total the "reported by T" bar is a model of, so the
    # reader can see the fitted reported level against the figure itself.
    ismissing(obs.onset_curve_history.last_total) ||
        CairoMakie.hlines!(
        ax2,
        [Float64(obs.onset_curve_history.last_total)];
        color = :black, linestyle = :dash
    )
    fig
end;