Province forecasts
This page gives the one-week-ahead forecast for each province from the joint model, as defined in the province forecast Methods section. The national forecast is on the forecasts page. How these forecasts have scored against what each province went on to report is in the forecast by province across releases evaluation. How well the model reproduces each province's share is on the in-sample checks page.
Load packages, data and fitted chains
# Shared setup: packages, observations and the fit registry. See
# `docs/pages/_setup.jl`.
using BVDOutbreakSize
include(joinpath(pkgdir(BVDOutbreakSize), "docs", "pages", "_setup.jl"))
validation_forecast_from (generic function with 1 method)# The fits this page reads, loaded from the cache here.
chn_joint = load_fit("joint");Summary
The table gives each province's forecast for the week to
Project each province a week ahead
# Read from the same draws as the national forecast page, so the provinces
# add up to the national forecast shown there.
province_draws = fit_forecast("joint");
province_projection = forecast_provinces(
    province_draws; horizon = 7, n_patches = N_PATCHES
);
province_forecast = province_forecast_table(
    province_draws, province_projection;
    n_patches = N_PATCHES
);
province_forecast_fig = plot_province_forecast(
    province_draws, province_projection;
    n_patches = N_PATCHES
);
province_week_end = obs.cutoff + Day(7);
province_forecast_md = province_forecast_headline(
    province_projection; n_patches = N_PATCHES
);| Province | New confirmed cases | New confirmed deaths | Patients in isolation | Isolation beds | New admissions | New infections | R at T+7 | P(R > 1) |
|---|---|---|---|---|---|---|---|---|
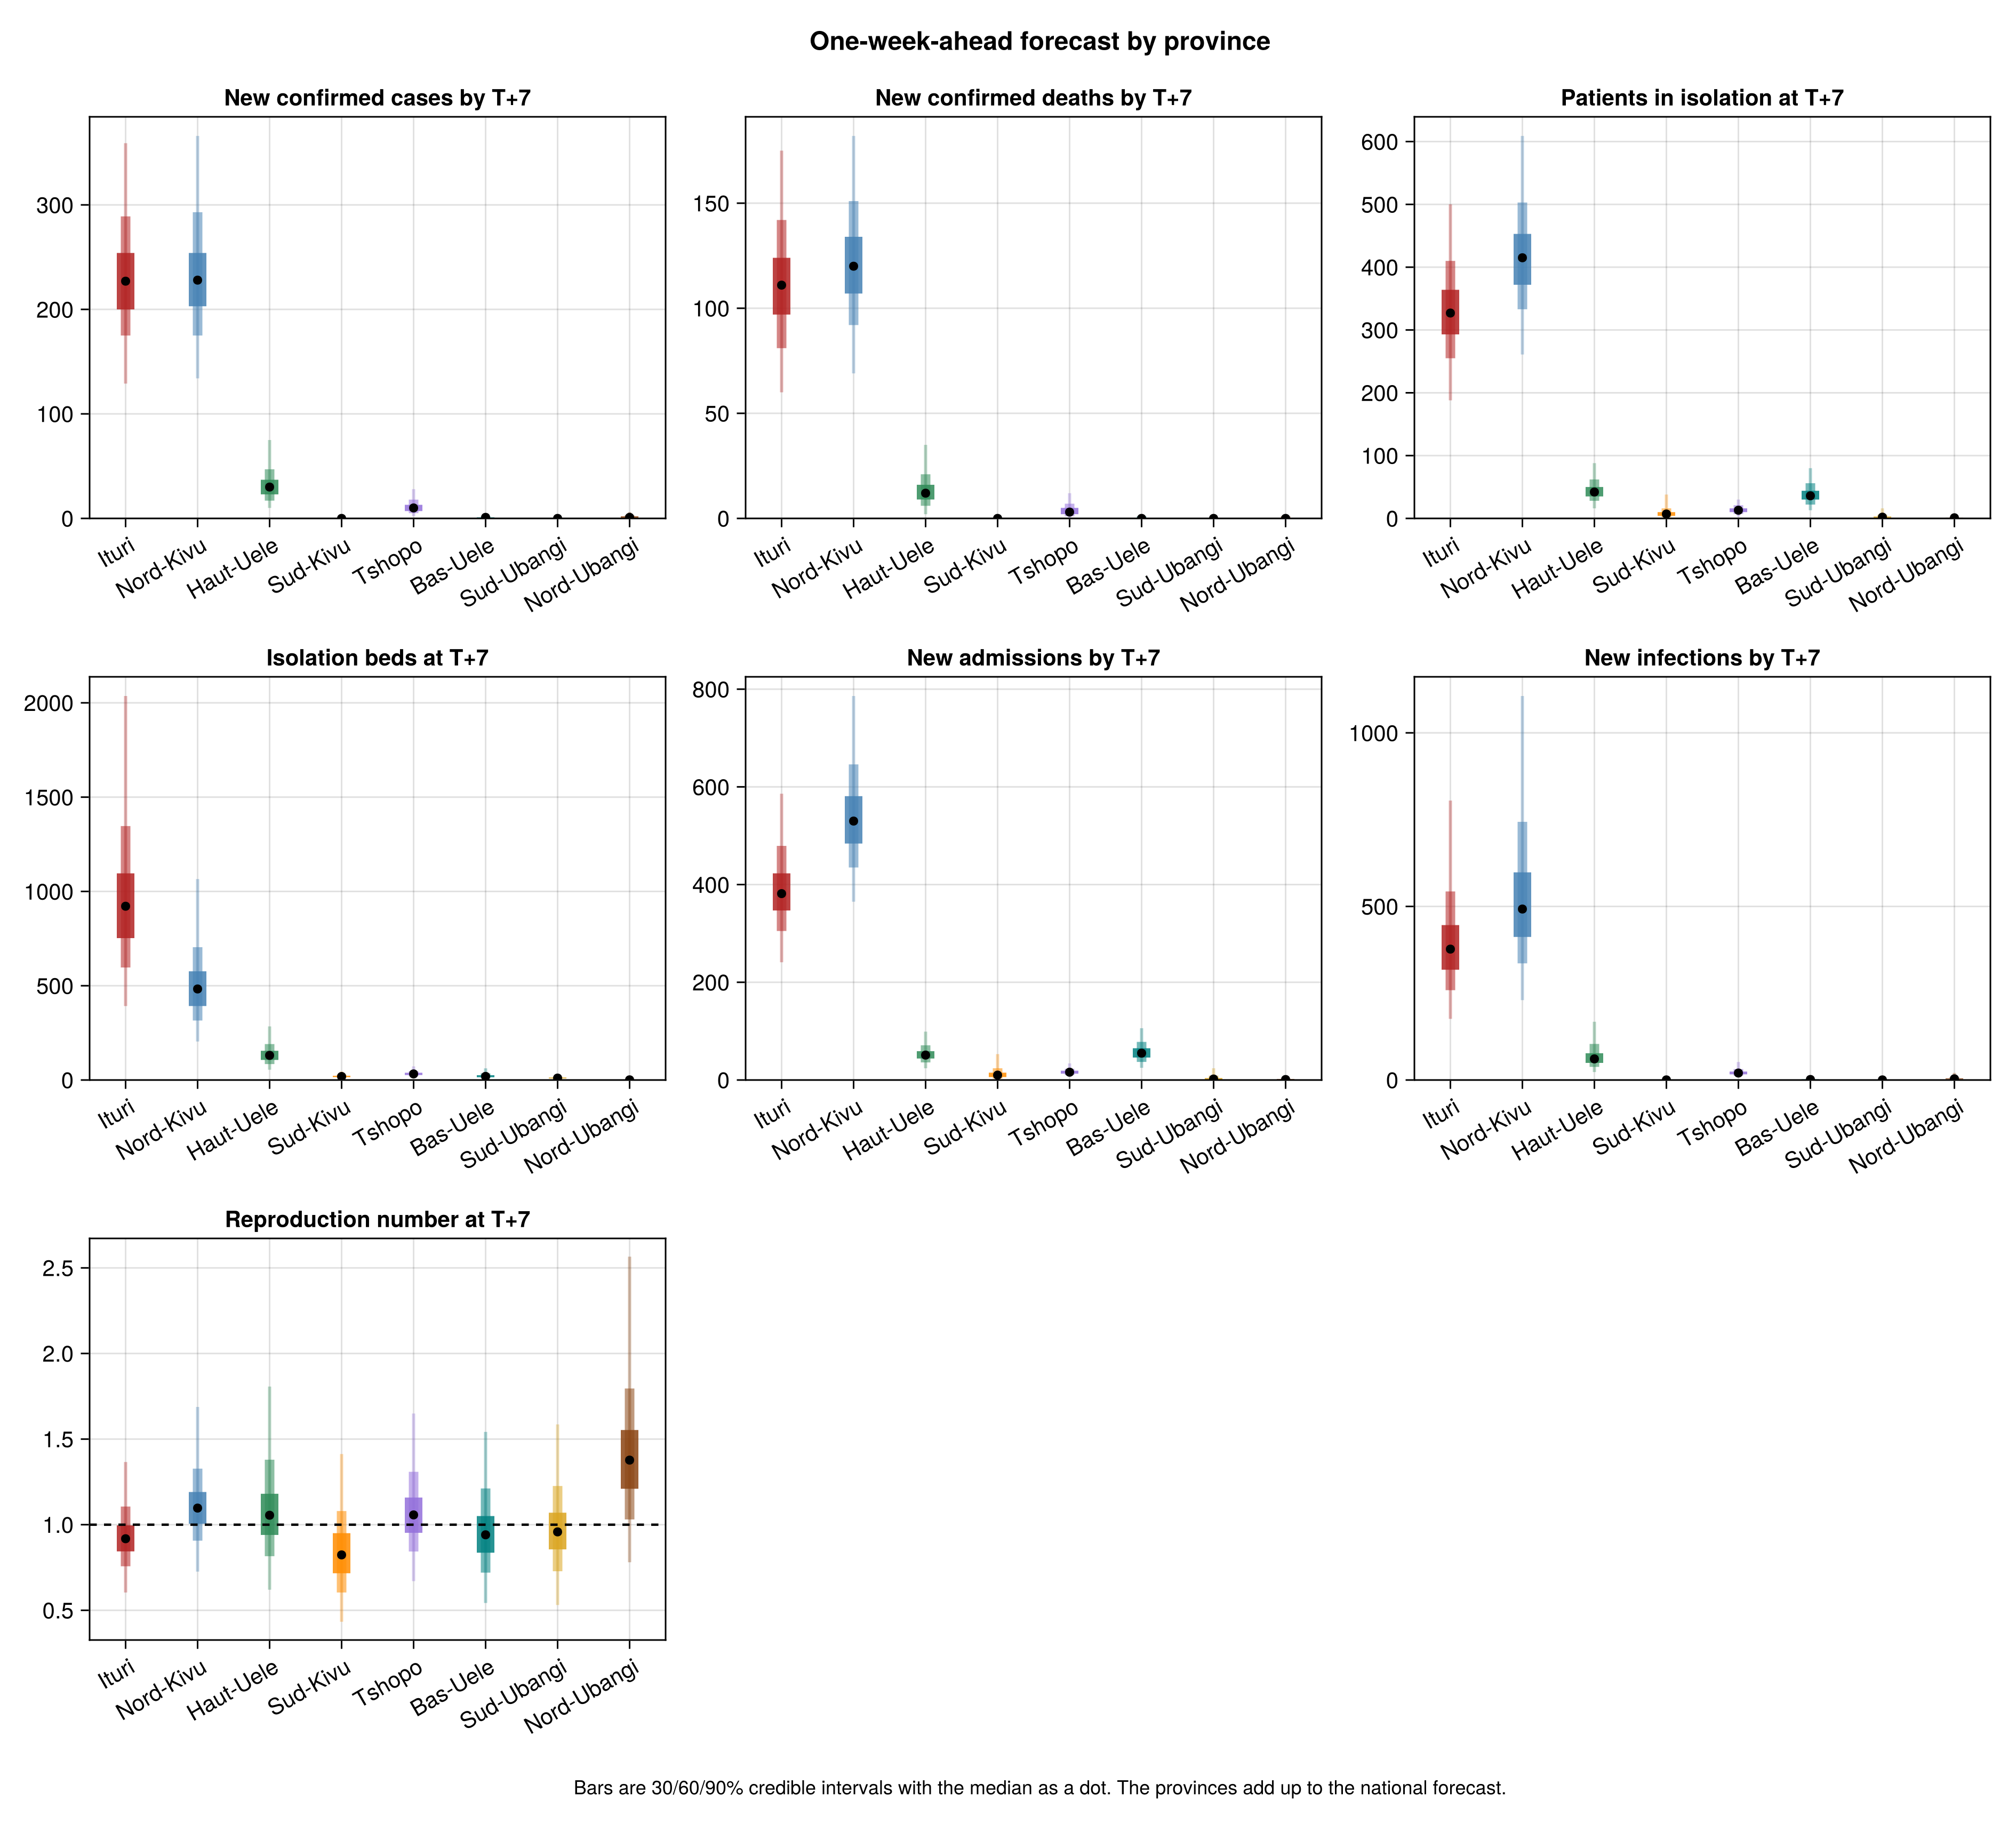
| Ituri | 129–359 | 60–175 | 188–500 | 392–2036 | 241–586 | 176–805 | 0.6–1.37 | 34% |
| Nord-Kivu | 134–366 | 69–182 | 261–609 | 204–1066 | 365–786 | 230–1106 | 0.73–1.69 | 66% |
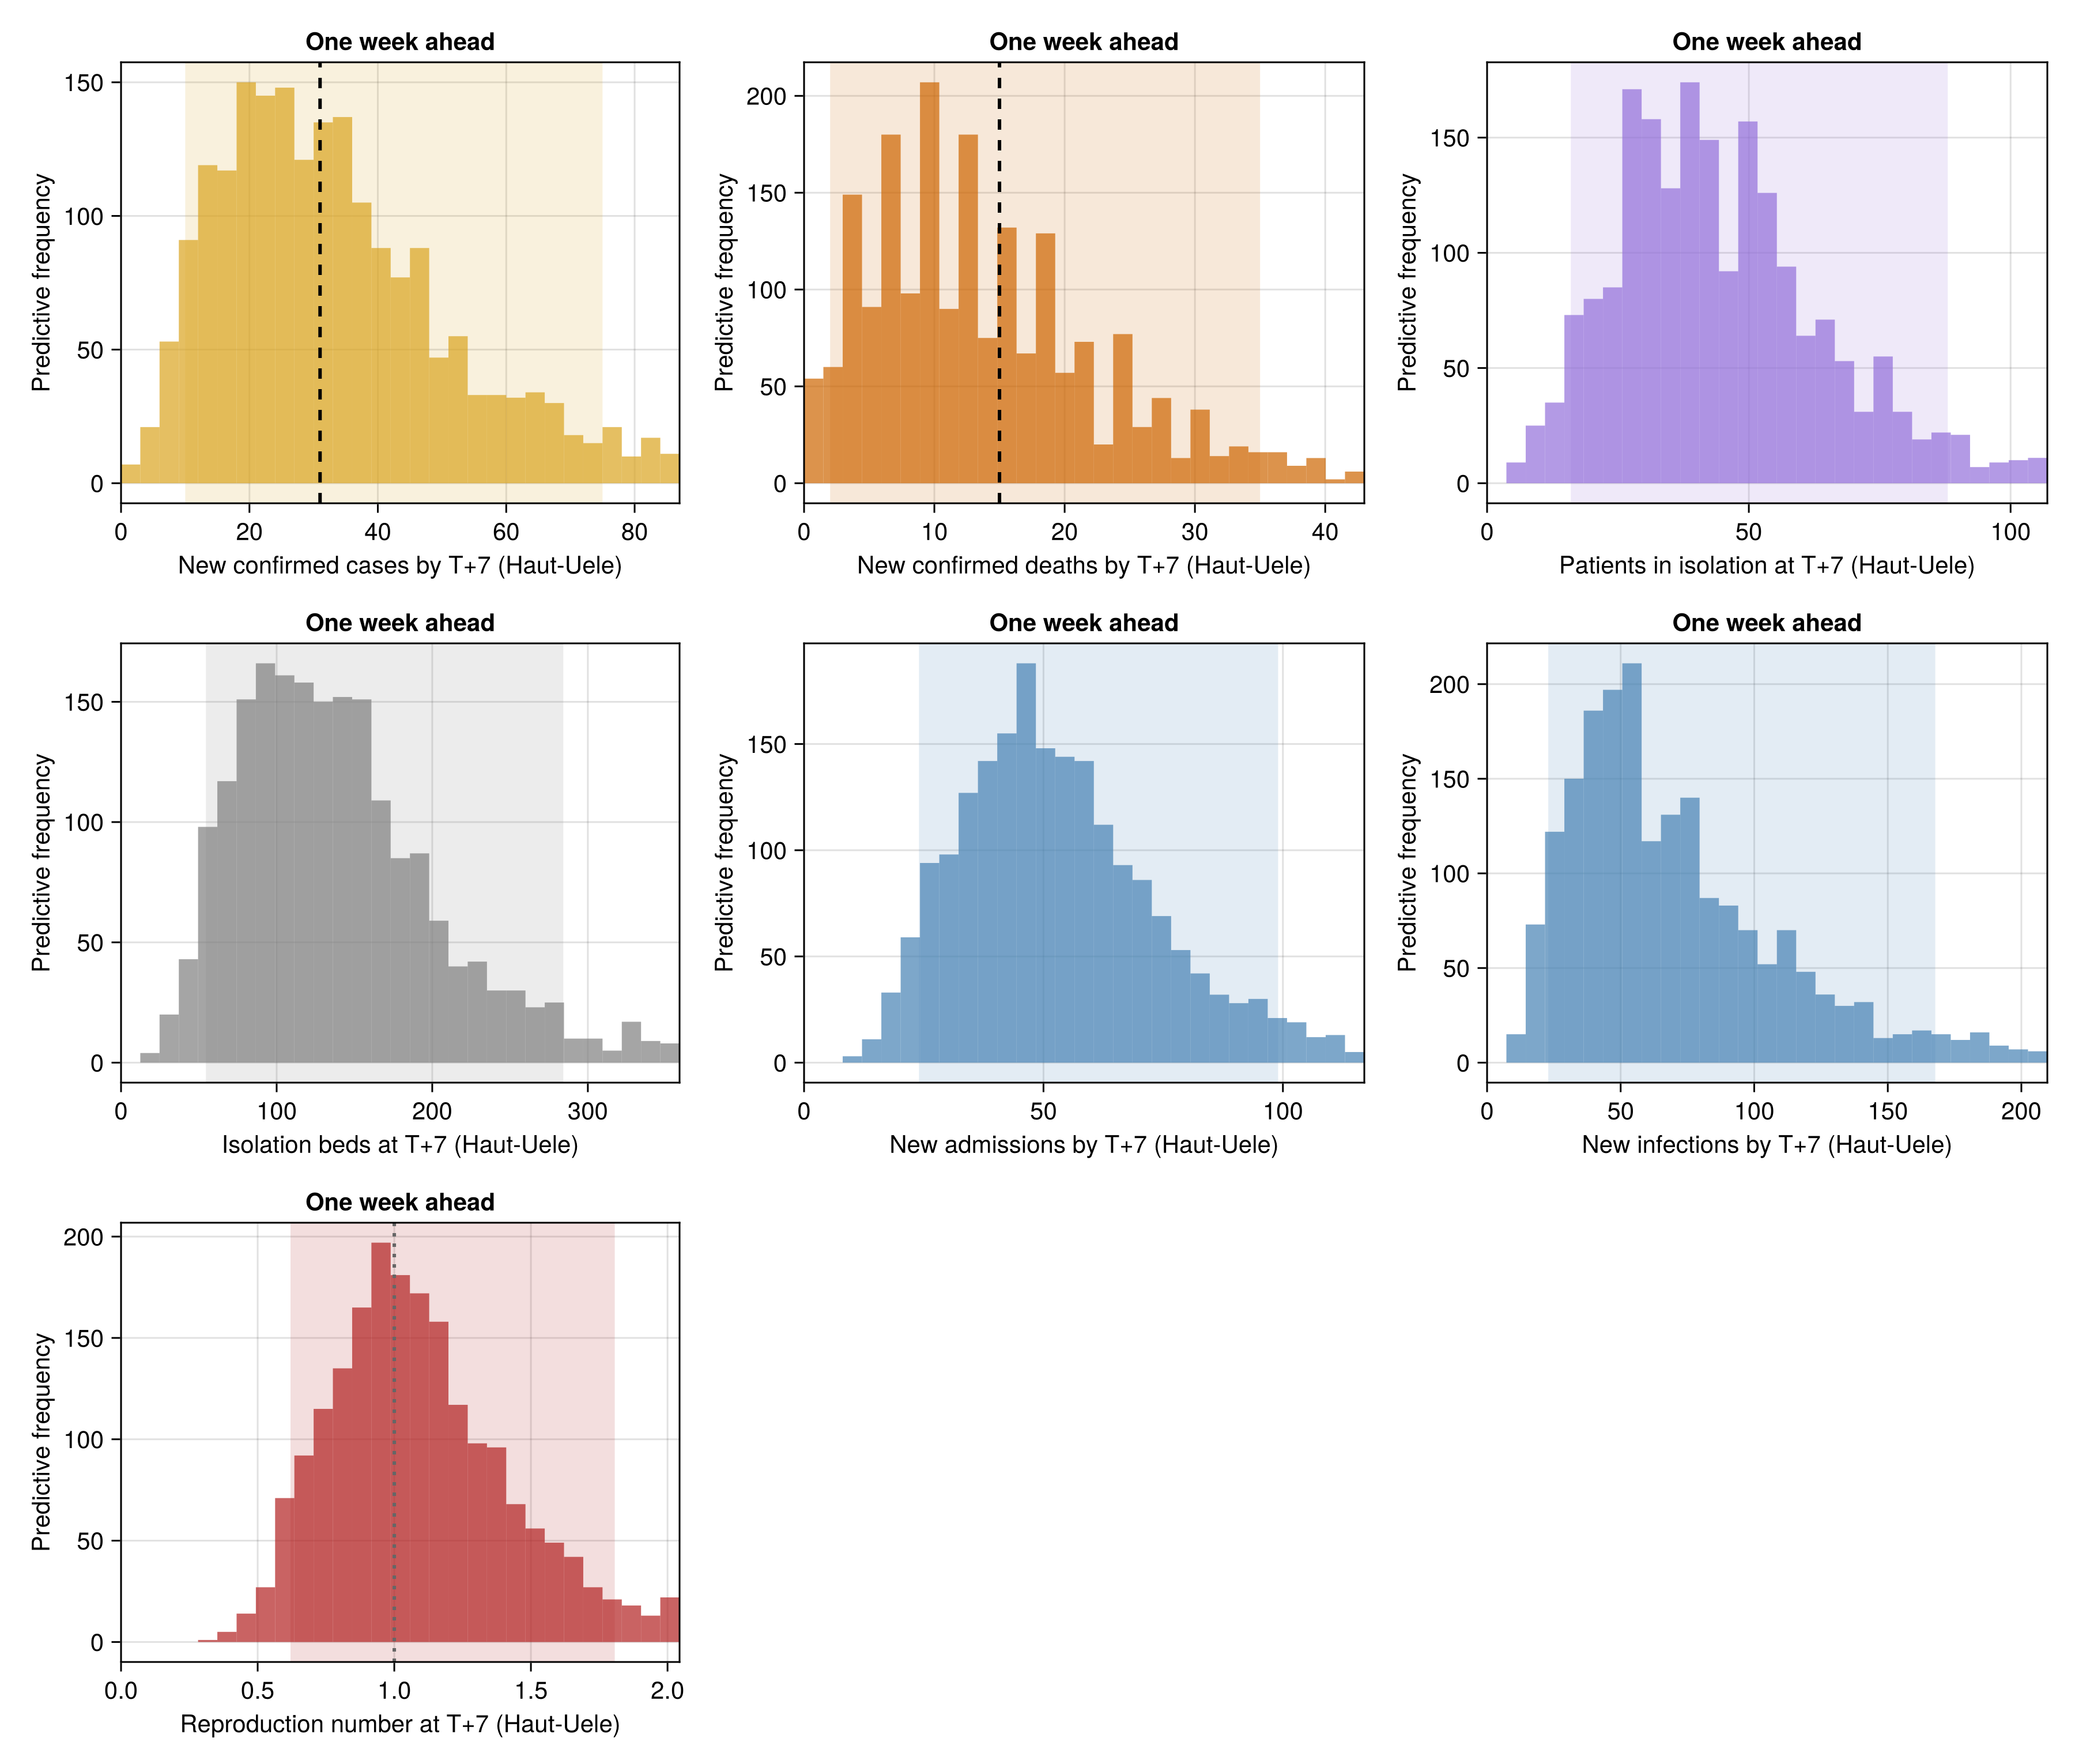
| Haut-Uele | 10–75 | 2–35 | 16–88 | 55–284 | 24–99 | 23–168 | 0.62–1.81 | 57% |
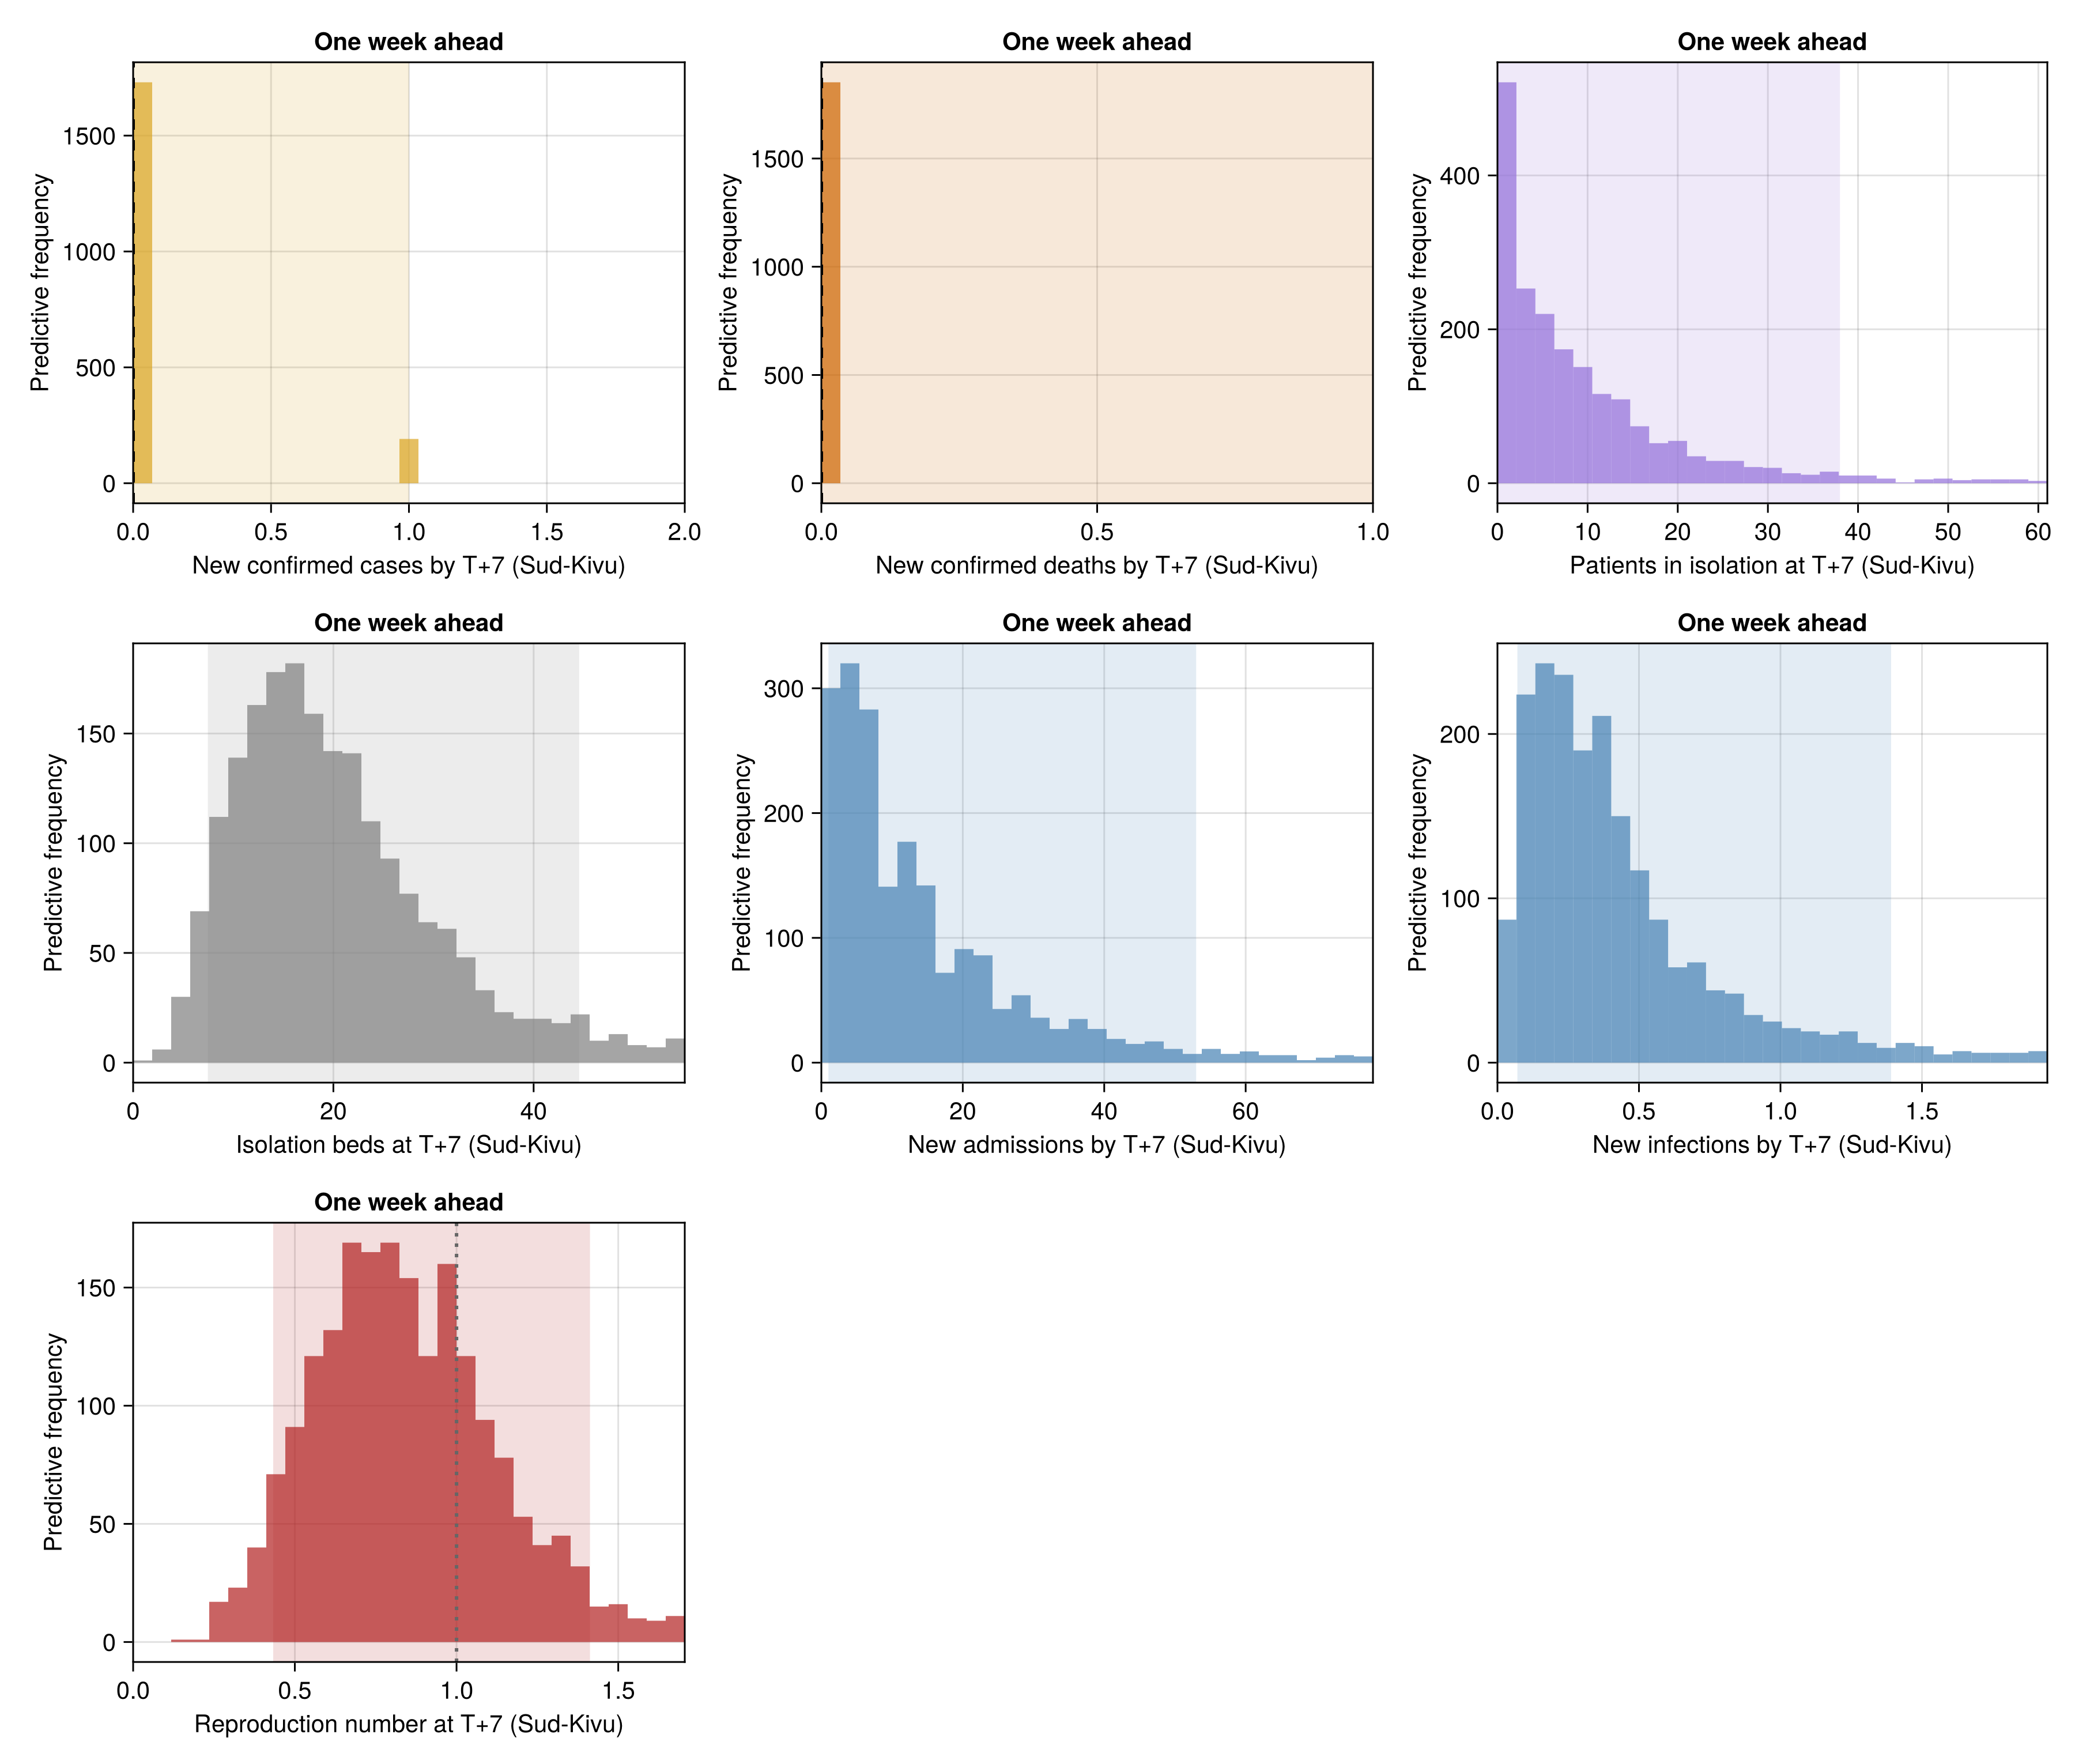
| Sud-Kivu | 0–1 | 0–1 | 0–38 | 7–45 | 1–53 | 0–1 | 0.43–1.41 | 28% |
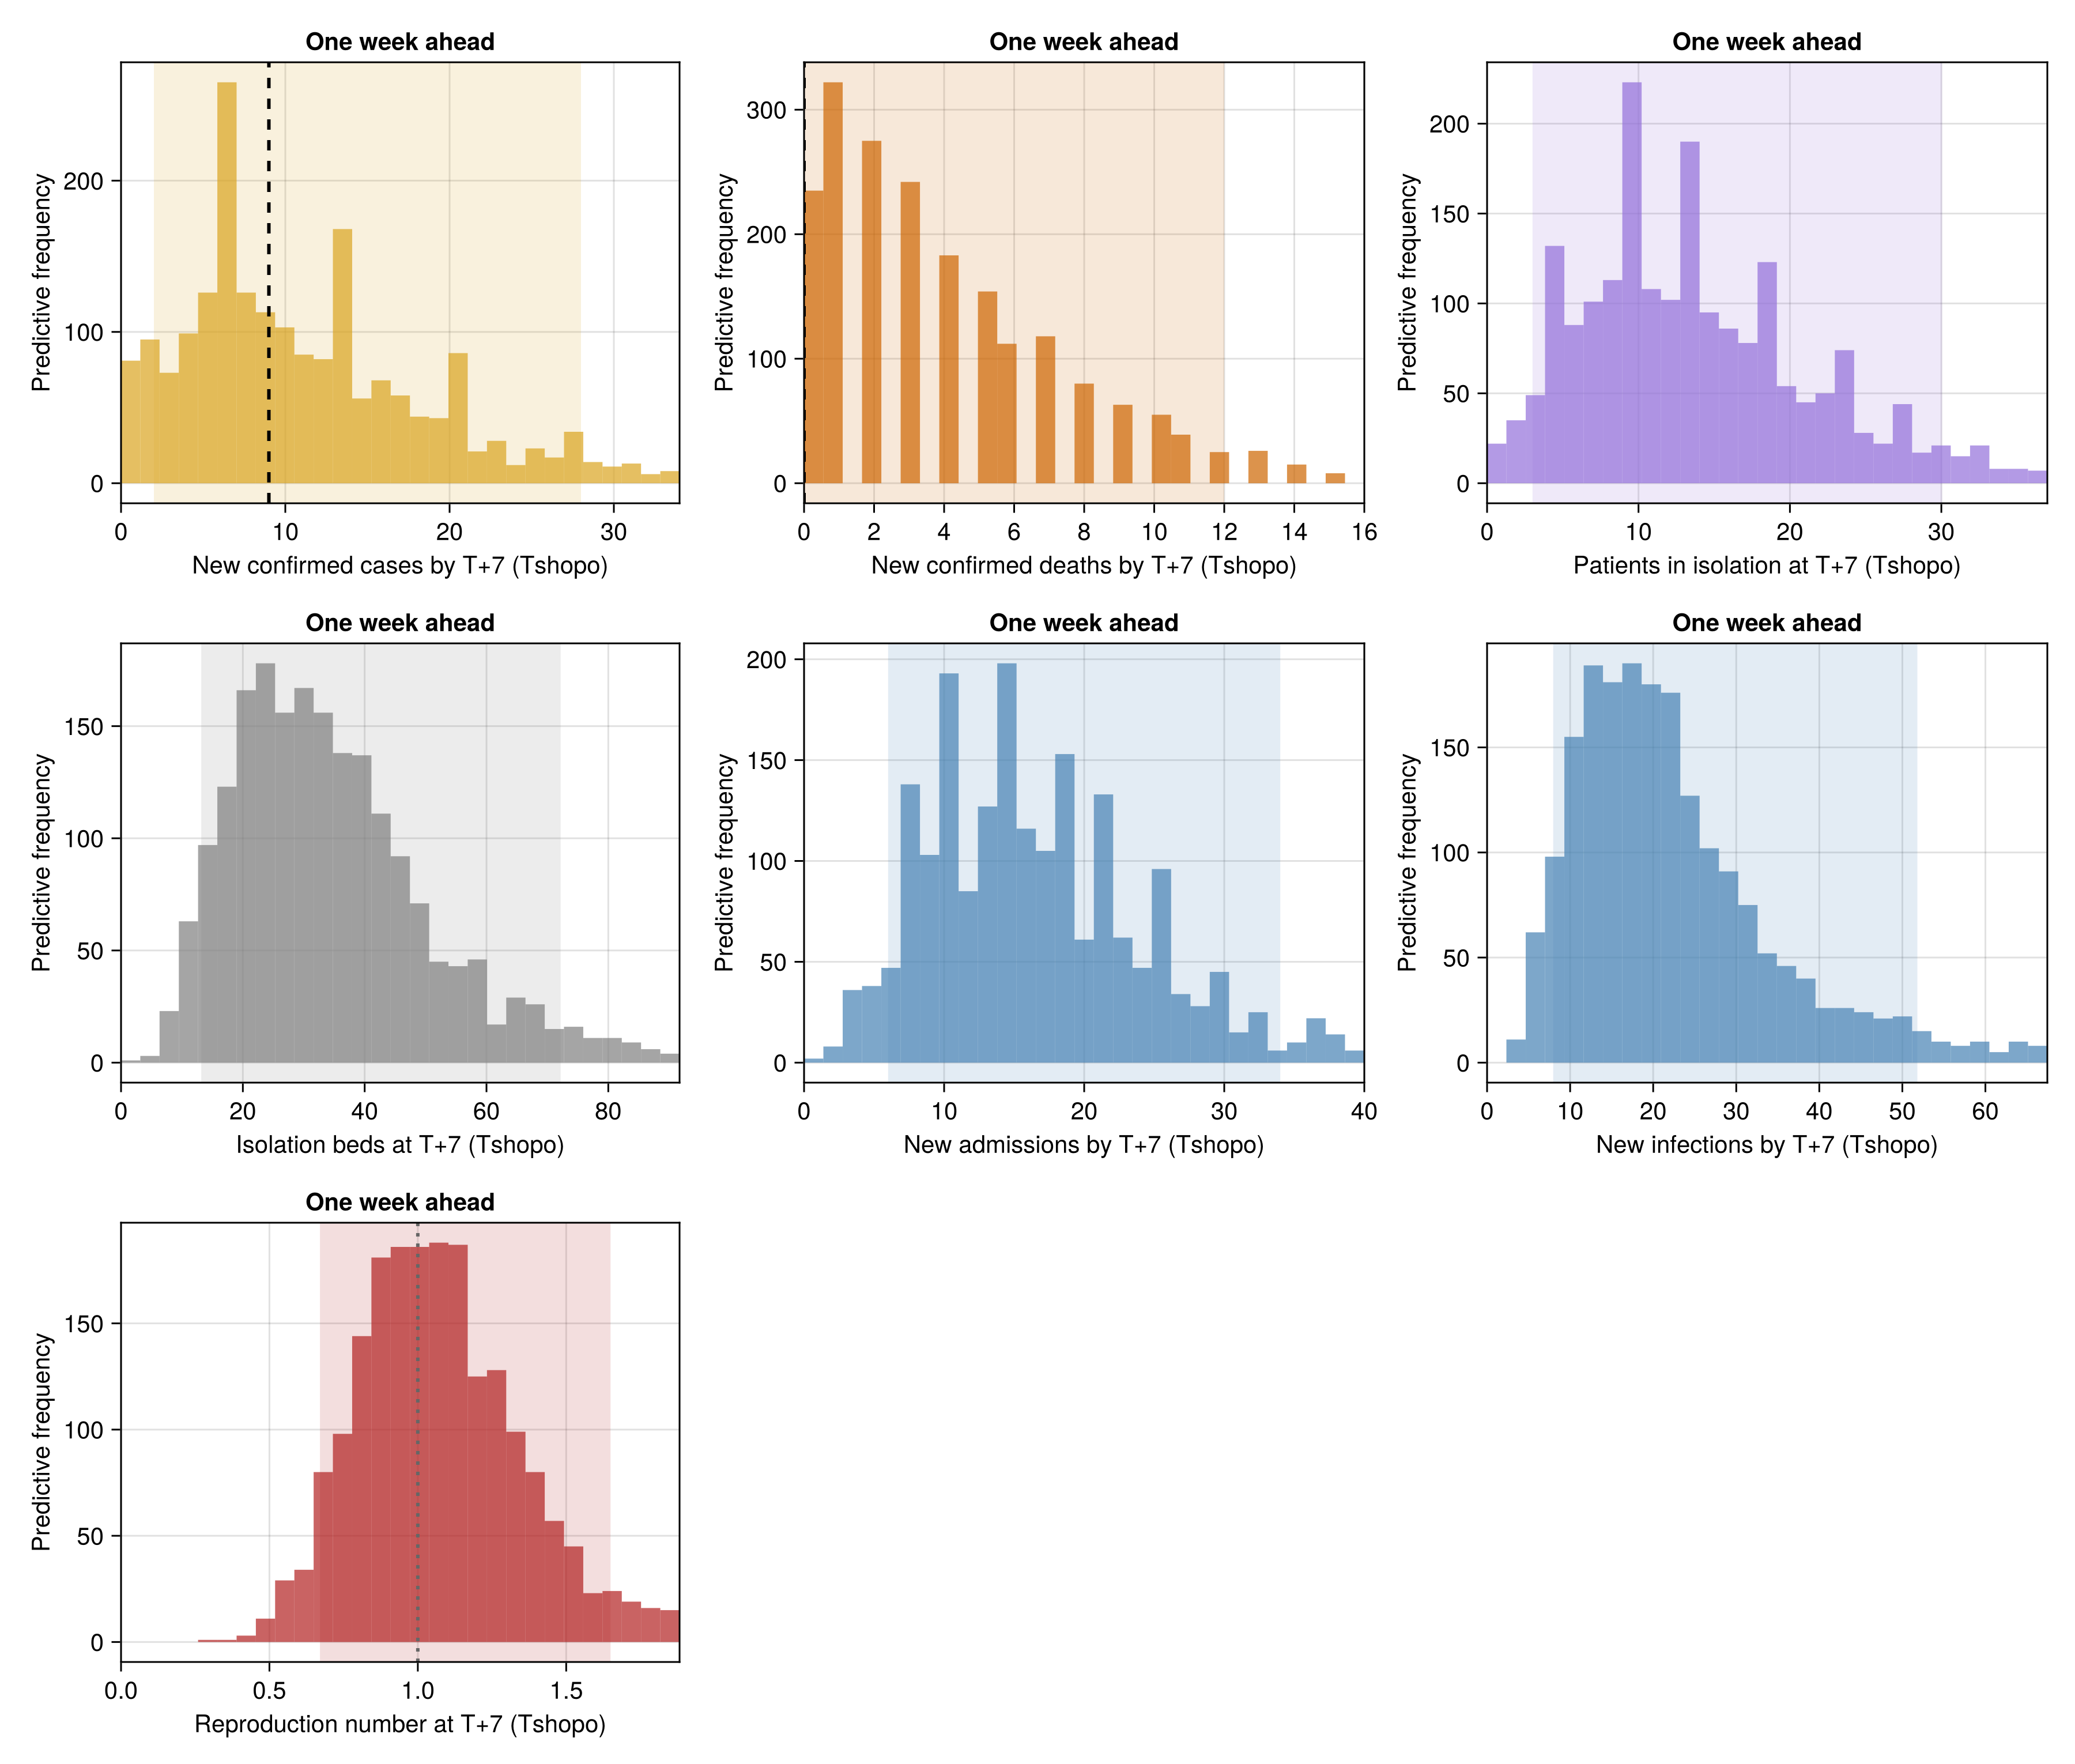
| Tshopo | 2–28 | 0–12 | 3–30 | 13–72 | 6–34 | 8–52 | 0.67–1.65 | 57% |
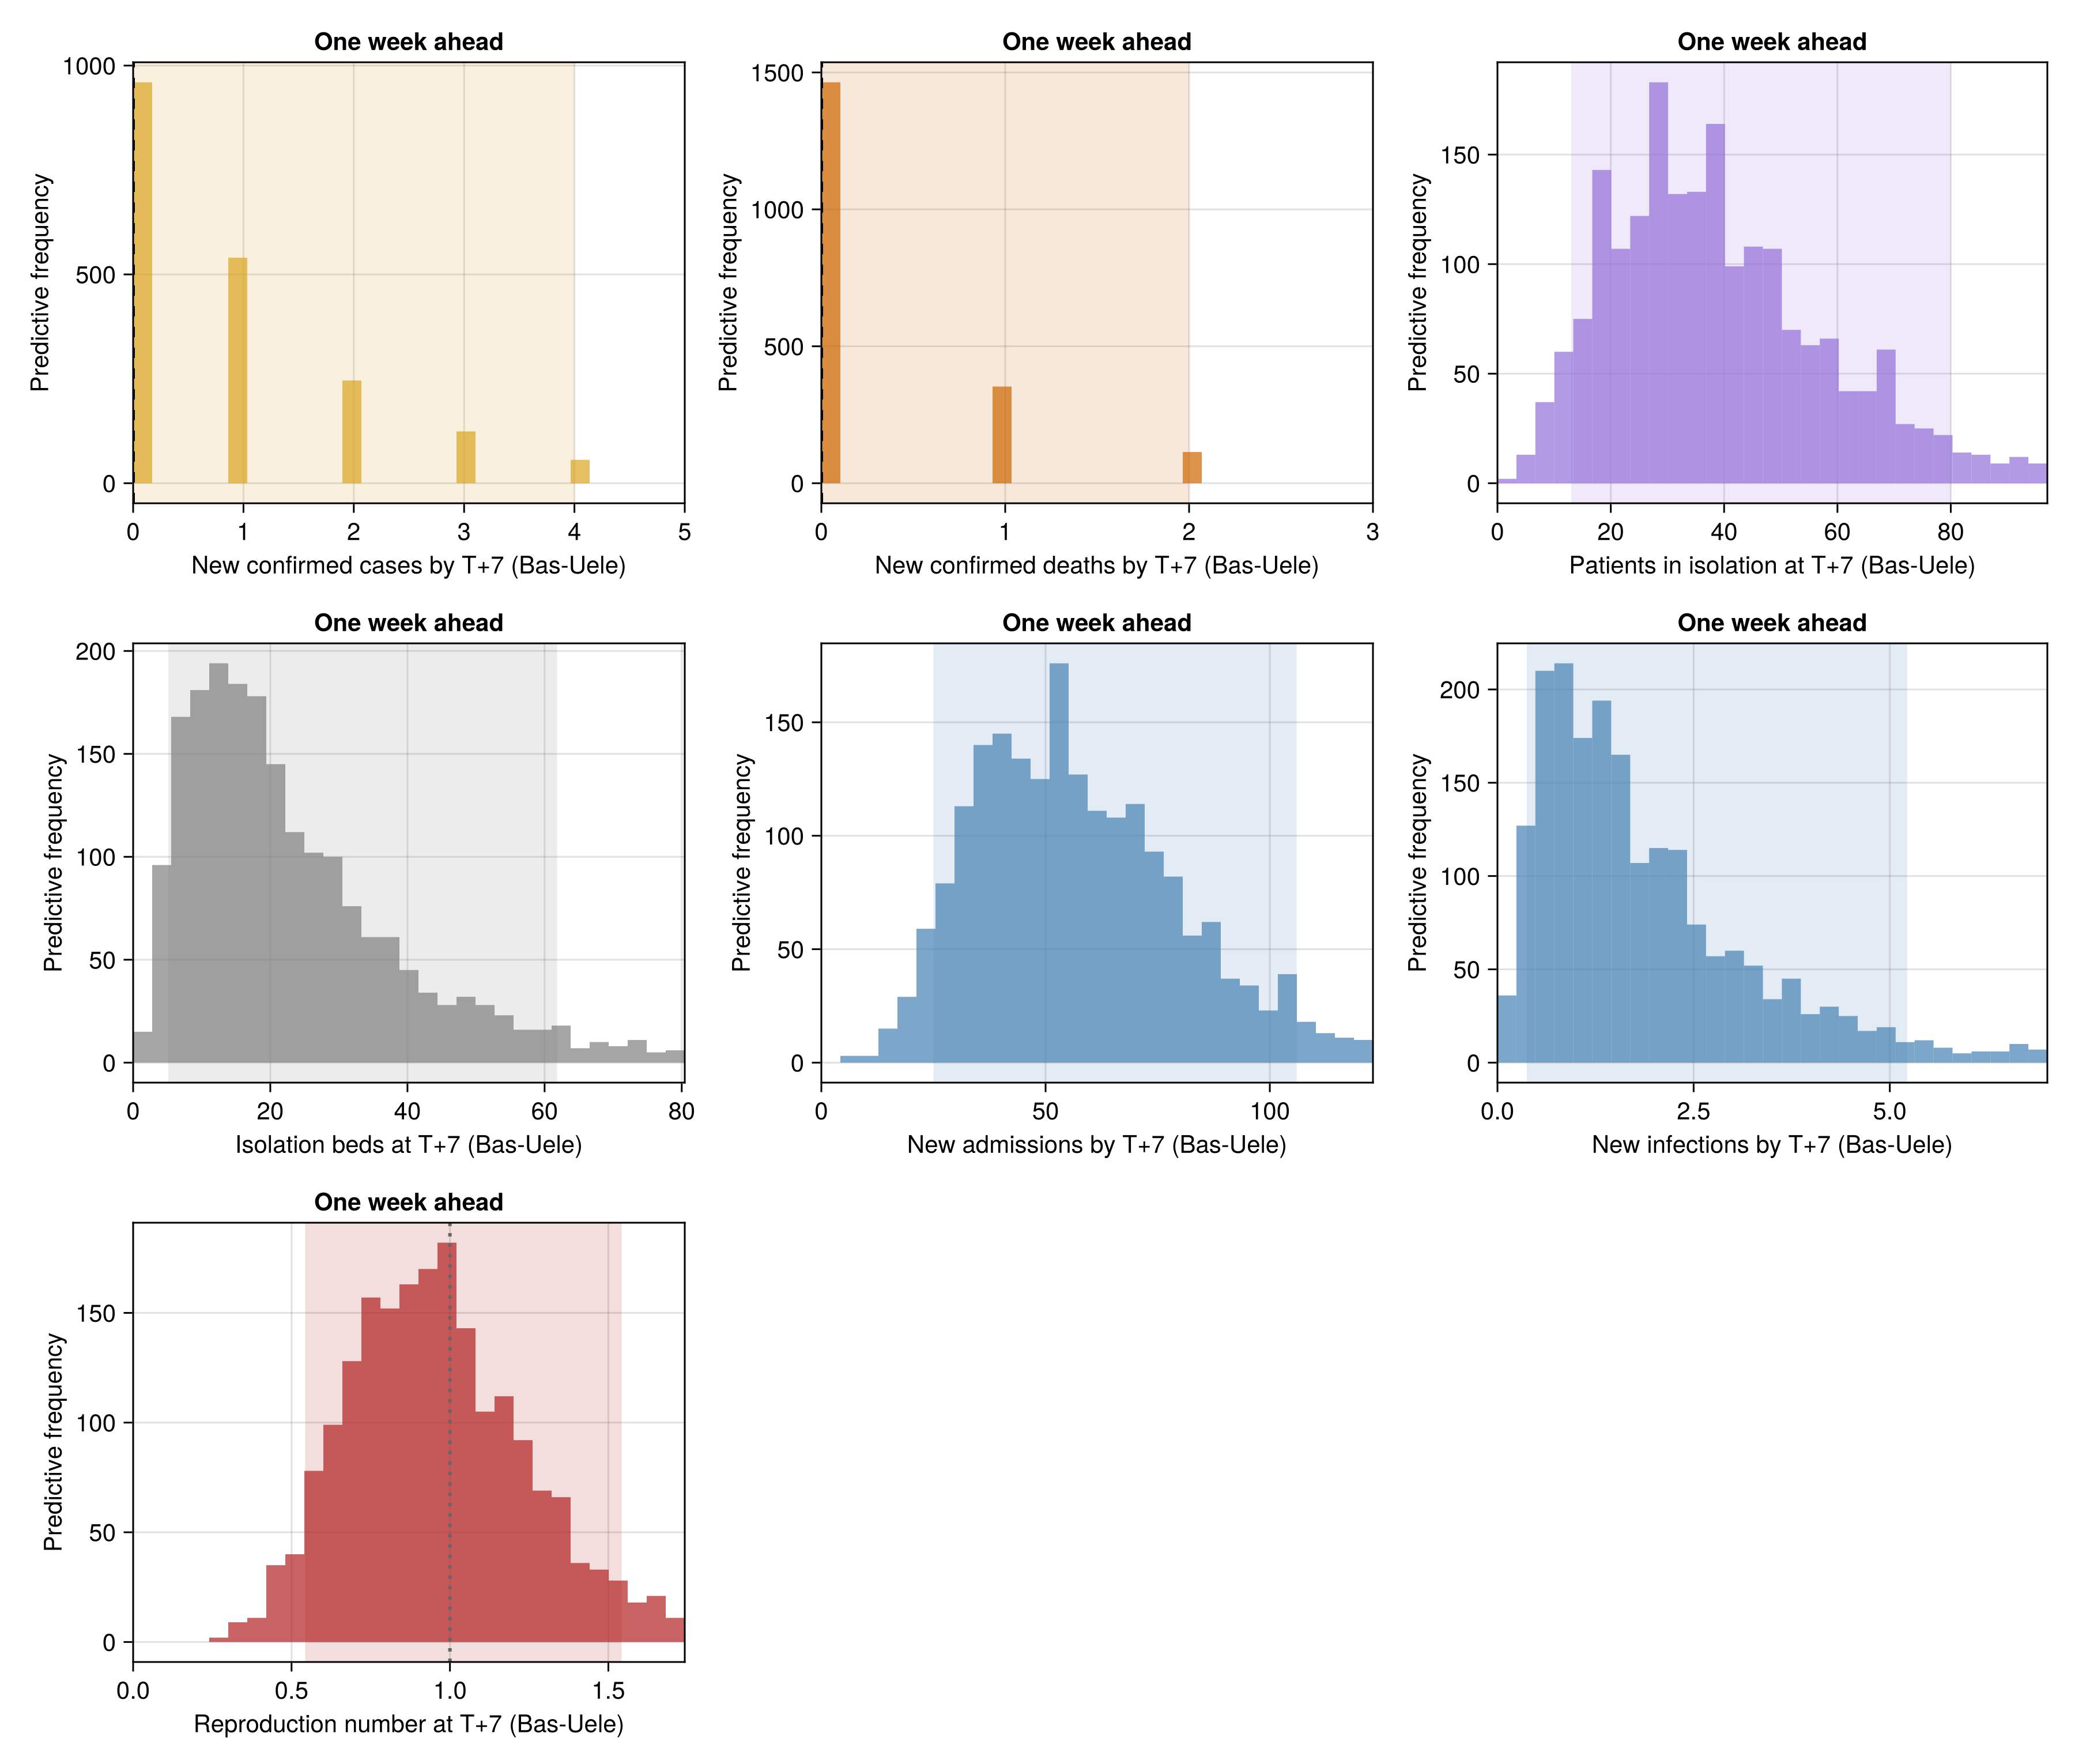
| Bas-Uele | 0–4 | 0–2 | 13–80 | 5–62 | 25–106 | 0–5 | 0.54–1.54 | 42% |
| Sud-Ubangi | 0–1 | 0–1 | 0–16 | 3–33 | 0–24 | 0–2 | 0.53–1.59 | 44% |
| Nord-Ubangi | 0–6 | 0–2 | 0–5 | 0–6 | 0–5 | 1–20 | 0.78–2.57 | 82% |
Most new confirmed cases: Nord-Kivu, with probability 50%.
Most new confirmed deaths: Nord-Kivu, with probability 56%.
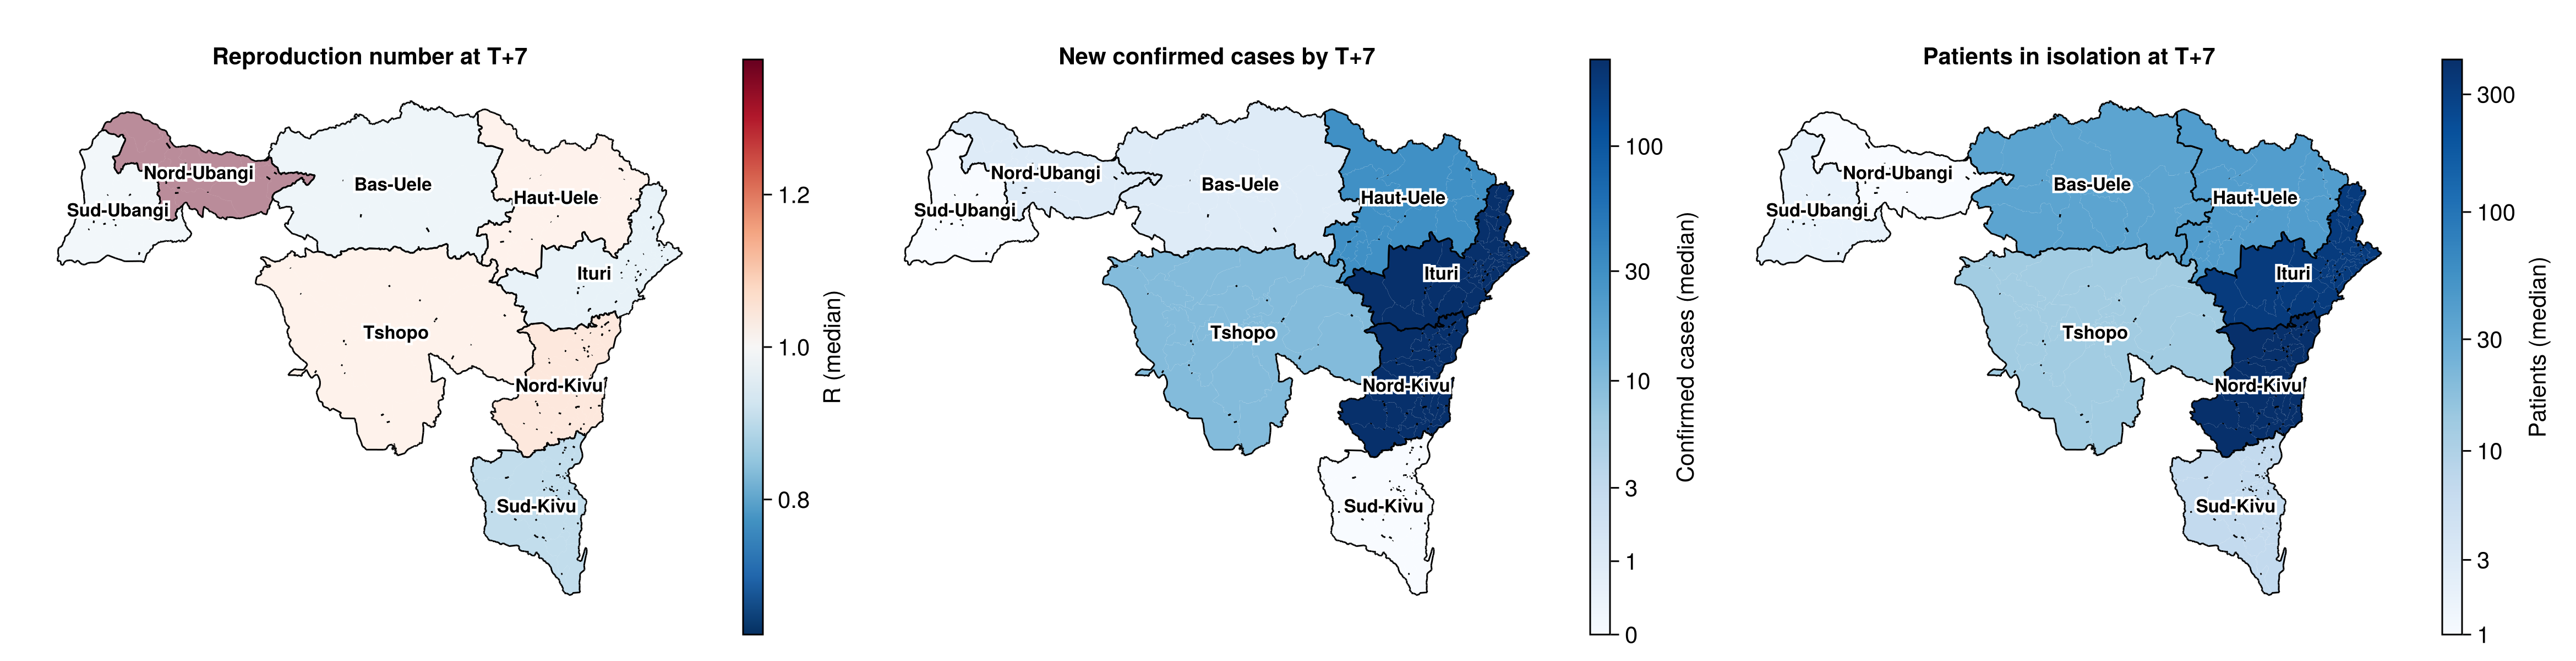
Growing at T+7: 4 of 8 provinces are more likely than not to be growing (Nord-Kivu, Haut-Uele, Tshopo, Nord-Ubangi).
Beds full at T+7: Bas-Uele is more likely than not to be at or above its beds.
One-week-ahead forecast by province
Build the forecast maps
province_forecast_draws(col) = [
    float.(province_projection[province_projection.patch .== p, col])
        for p in 1:N_PATCHES
]
province_forecast_map = plot_province_map(
    filter(
        !isnothing,
        [
            (;
                province_map_summary(province_forecast_draws(:rt_forecast))...,
                title = "Reproduction number at T+7", diverging_at = 1.0,
                colorbar_label = "R (median)",
            ),
            (;
                values = province_map_summary(
                    province_forecast_draws(:confirmed_new)
                ).values,
                title = "New confirmed cases by T+7",
                scale = CairoMakie.Makie.pseudolog10,
                colorbar_label = "Confirmed cases (median)",
            ),
            :isolation_level in propertynames(province_projection) ? (;
                    values = province_map_summary(
                        province_forecast_draws(:isolation_level)
                    ).values,
                    title = "Patients in isolation at T+7",
                    scale = CairoMakie.Makie.pseudolog10,
                    colorbar_label = "Patients (median)",
                ) : nothing,
        ]
    )
);
| Province | Quantity | Lower 90% | Lower 60% | Lower 30% | Upper 30% | Upper 60% | Upper 90% |
|---|---|---|---|---|---|---|---|
| Ituri | New confirmed cases by T+7 | 129 | 175 | 200 | 254 | 289 | 359 |
| Ituri | New confirmed deaths by T+7 | 60 | 81 | 97 | 124 | 142 | 175 |
| Ituri | Patients in isolation at T+7 | 188 | 255 | 293 | 364 | 410 | 500 |
| Ituri | Isolation beds at T+7 | 392 | 597 | 752 | 1096 | 1347 | 2036 |
| Ituri | New admissions by T+7 | 241 | 305 | 347 | 423 | 479 | 586 |
| Ituri | New infections by T+7 | 176 | 259 | 318 | 446 | 543 | 805 |
| Ituri | Reproduction number at T+7 | 0.6 | 0.76 | 0.84 | 1 | 1.11 | 1.37 |
| Nord-Kivu | New confirmed cases by T+7 | 134 | 175 | 203 | 254 | 293 | 366 |
| Nord-Kivu | New confirmed deaths by T+7 | 69 | 92 | 107 | 134 | 151 | 182 |
| Nord-Kivu | Patients in isolation at T+7 | 261 | 333 | 372 | 453 | 503 | 609 |
| Nord-Kivu | Isolation beds at T+7 | 204 | 315 | 392 | 576 | 704 | 1066 |
| Nord-Kivu | New admissions by T+7 | 365 | 435 | 484 | 581 | 646 | 786 |
| Nord-Kivu | New infections by T+7 | 230 | 336 | 412 | 598 | 744 | 1106 |
| Nord-Kivu | Reproduction number at T+7 | 0.73 | 0.91 | 1.01 | 1.19 | 1.33 | 1.69 |
| Haut-Uele | New confirmed cases by T+7 | 10 | 17 | 23 | 37 | 47 | 75 |
| Haut-Uele | New confirmed deaths by T+7 | 2 | 6 | 9 | 16 | 21 | 35 |
| Haut-Uele | Patients in isolation at T+7 | 16 | 28 | 35 | 50 | 62 | 88 |
| Haut-Uele | Isolation beds at T+7 | 55 | 84 | 106 | 155 | 191 | 284 |
| Haut-Uele | New admissions by T+7 | 24 | 36 | 44 | 59 | 71 | 99 |
| Haut-Uele | New infections by T+7 | 23 | 38 | 49 | 77 | 104 | 168 |
| Haut-Uele | Reproduction number at T+7 | 0.62 | 0.82 | 0.94 | 1.18 | 1.38 | 1.81 |
| Sud-Kivu | New confirmed cases by T+7 | 0 | 0 | 0 | 0 | 0 | 1 |
| Sud-Kivu | New confirmed deaths by T+7 | 0 | 0 | 0 | 0 | 0 | 1 |
| Sud-Kivu | Patients in isolation at T+7 | 0 | 2 | 4 | 10 | 16 | 38 |
| Sud-Kivu | Isolation beds at T+7 | 7 | 12 | 15 | 22 | 28 | 45 |
| Sud-Kivu | New admissions by T+7 | 1 | 3 | 6 | 15 | 24 | 53 |
| Sud-Kivu | New infections by T+7 | 0 | 0 | 0 | 0 | 1 | 1 |
| Sud-Kivu | Reproduction number at T+7 | 0.43 | 0.6 | 0.72 | 0.95 | 1.08 | 1.41 |
| Tshopo | New confirmed cases by T+7 | 2 | 5 | 7 | 13 | 18 | 28 |
| Tshopo | New confirmed deaths by T+7 | 0 | 1 | 2 | 5 | 7 | 12 |
| Tshopo | Patients in isolation at T+7 | 3 | 7 | 10 | 16 | 21 | 30 |
| Tshopo | Isolation beds at T+7 | 13 | 21 | 26 | 38 | 47 | 72 |
| Tshopo | New admissions by T+7 | 6 | 10 | 13 | 19 | 23 | 34 |
| Tshopo | New infections by T+7 | 8 | 12 | 16 | 24 | 31 | 52 |
| Tshopo | Reproduction number at T+7 | 0.67 | 0.84 | 0.95 | 1.16 | 1.31 | 1.65 |
| Bas-Uele | New confirmed cases by T+7 | 0 | 0 | 0 | 1 | 2 | 4 |
| Bas-Uele | New confirmed deaths by T+7 | 0 | 0 | 0 | 0 | 1 | 2 |
| Bas-Uele | Patients in isolation at T+7 | 13 | 22 | 30 | 44 | 56 | 80 |
| Bas-Uele | Isolation beds at T+7 | 5 | 10 | 15 | 26 | 35 | 62 |
| Bas-Uele | New admissions by T+7 | 25 | 37 | 46 | 65 | 78 | 106 |
| Bas-Uele | New infections by T+7 | 0 | 1 | 1 | 2 | 3 | 5 |
| Bas-Uele | Reproduction number at T+7 | 0.54 | 0.72 | 0.84 | 1.05 | 1.21 | 1.54 |
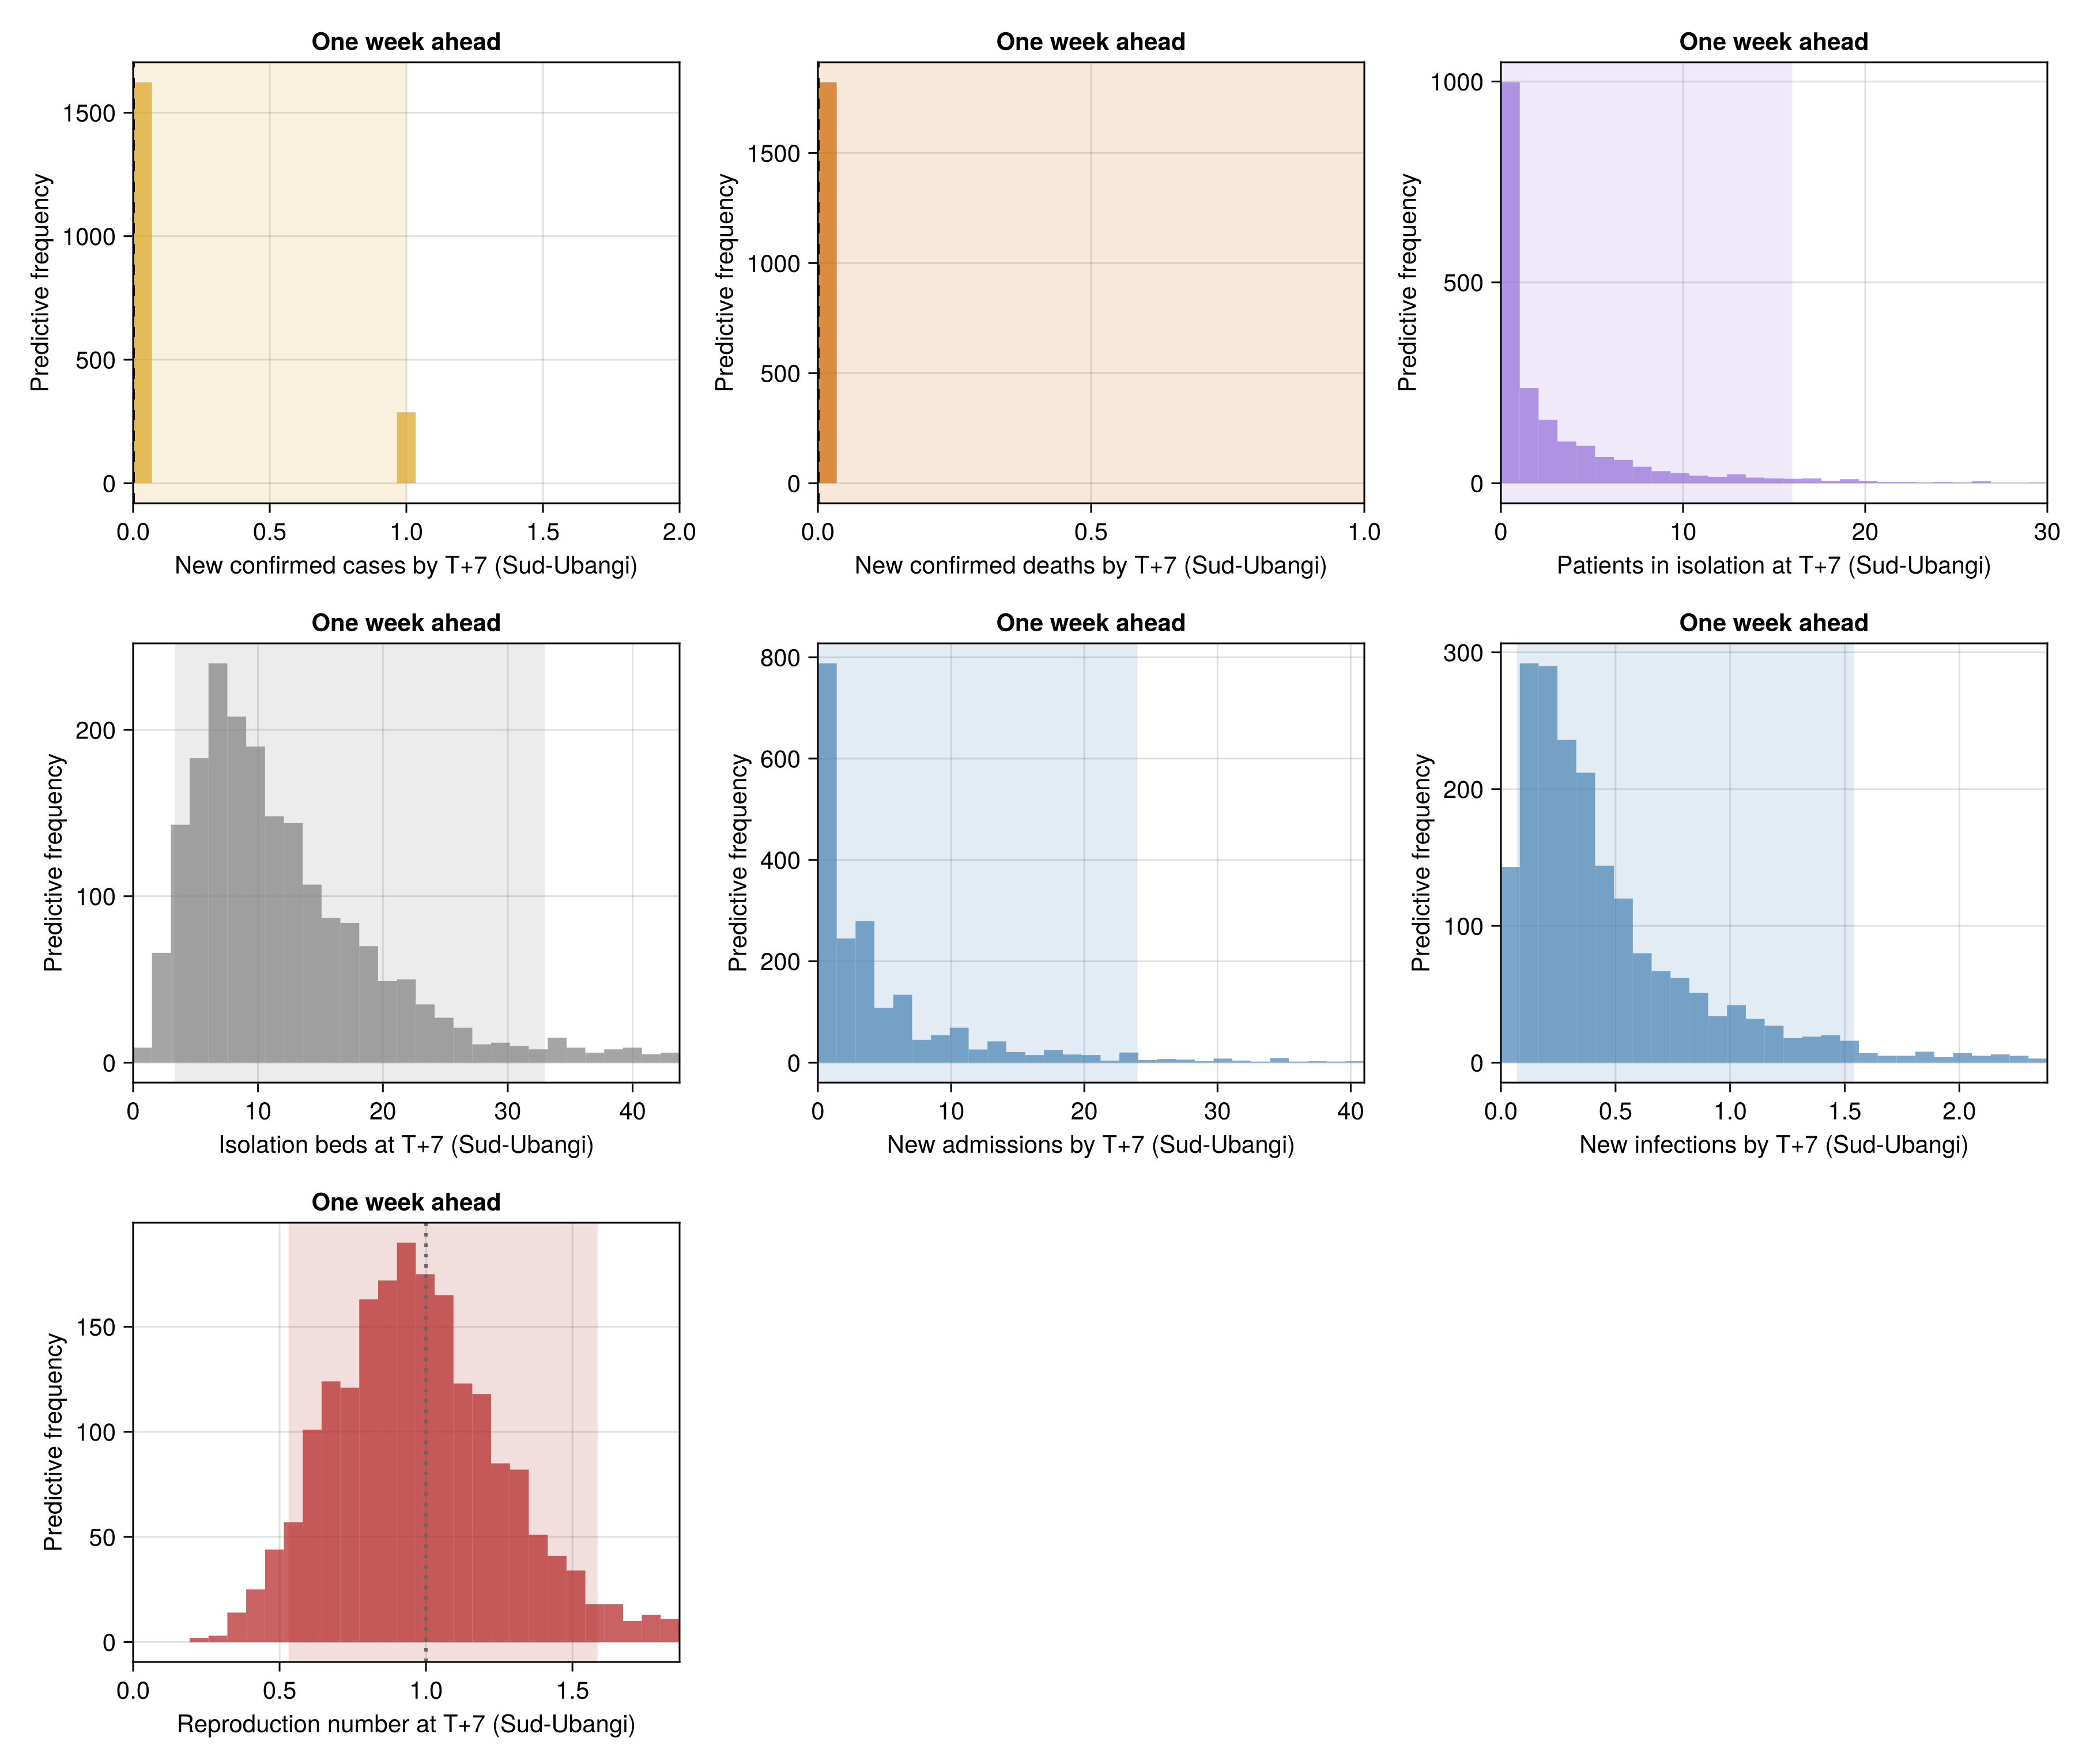
| Sud-Ubangi | New confirmed cases by T+7 | 0 | 0 | 0 | 0 | 0 | 1 |
| Sud-Ubangi | New confirmed deaths by T+7 | 0 | 0 | 0 | 0 | 0 | 1 |
| Sud-Ubangi | Patients in isolation at T+7 | 0 | 0 | 1 | 3 | 6 | 16 |
| Sud-Ubangi | Isolation beds at T+7 | 3 | 6 | 8 | 13 | 18 | 33 |
| Sud-Ubangi | New admissions by T+7 | 0 | 0 | 1 | 4 | 9 | 24 |
| Sud-Ubangi | New infections by T+7 | 0 | 0 | 0 | 0 | 1 | 2 |
| Sud-Ubangi | Reproduction number at T+7 | 0.53 | 0.73 | 0.86 | 1.07 | 1.23 | 1.59 |
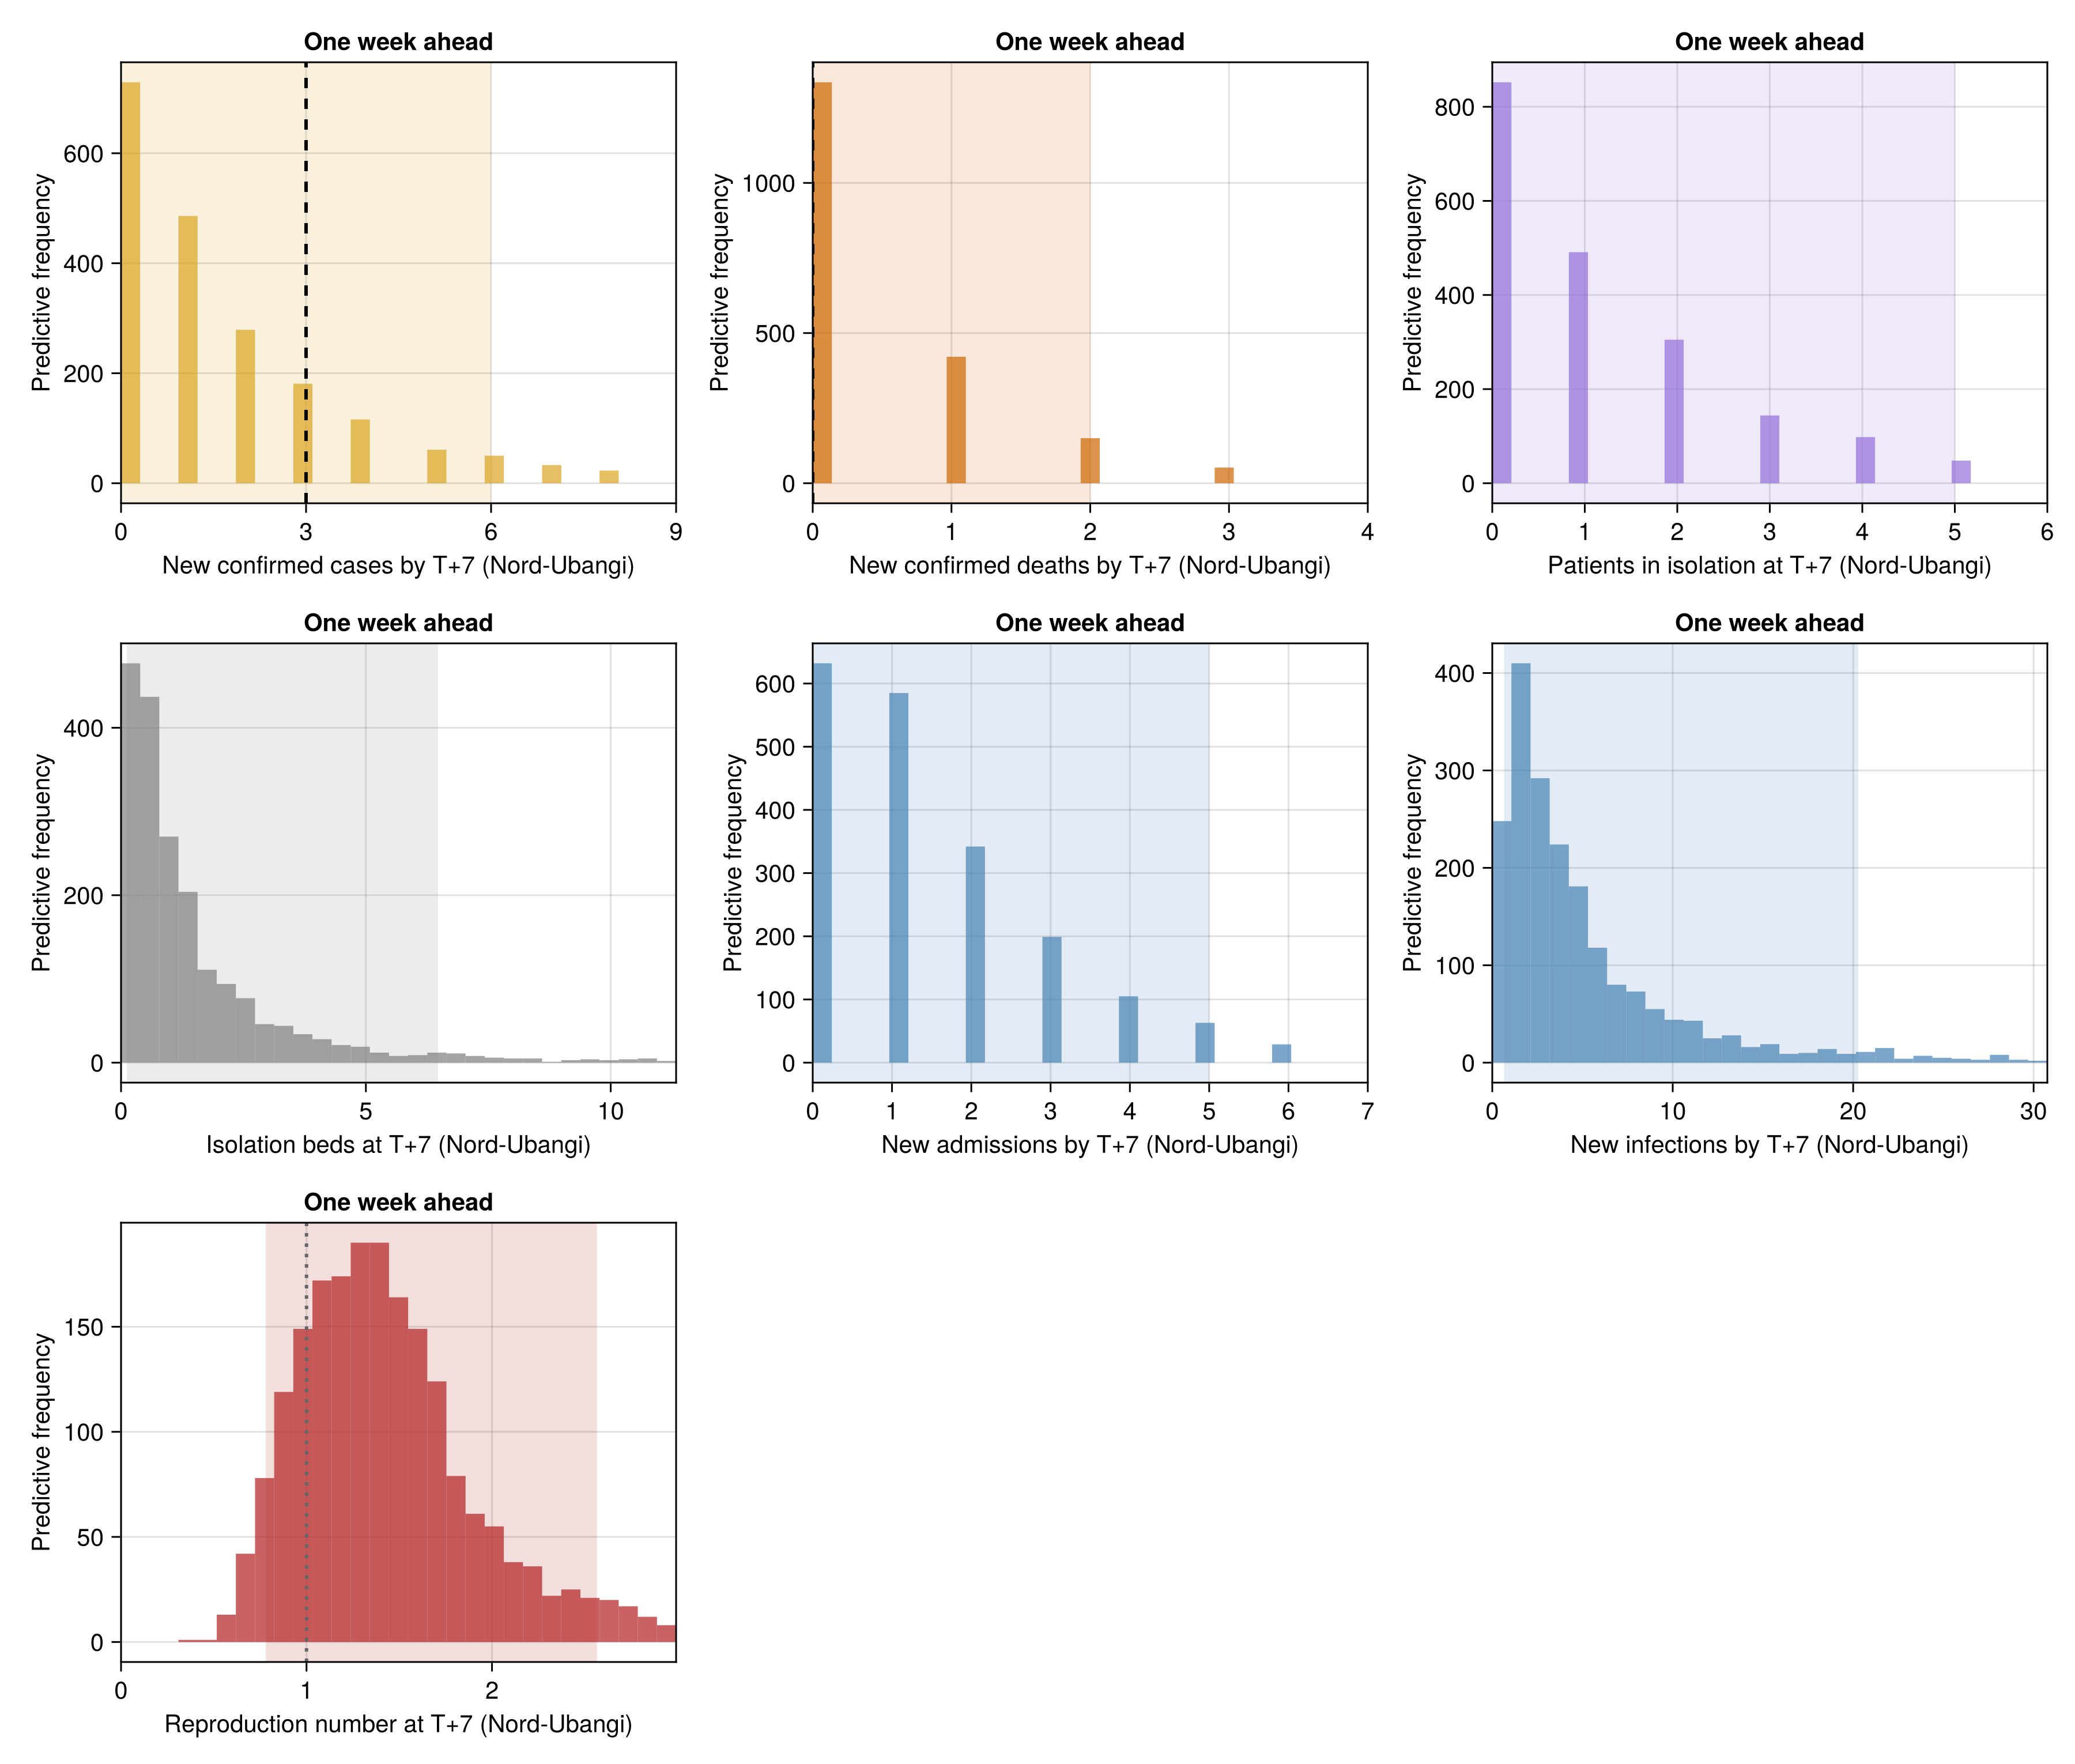
| Nord-Ubangi | New confirmed cases by T+7 | 0 | 0 | 0 | 2 | 3 | 6 |
| Nord-Ubangi | New confirmed deaths by T+7 | 0 | 0 | 0 | 0 | 1 | 2 |
| Nord-Ubangi | Patients in isolation at T+7 | 0 | 0 | 0 | 1 | 2 | 5 |
| Nord-Ubangi | Isolation beds at T+7 | 0 | 0 | 1 | 1 | 2 | 6 |
| Nord-Ubangi | New admissions by T+7 | 0 | 0 | 1 | 2 | 3 | 5 |
| Nord-Ubangi | New infections by T+7 | 1 | 1 | 2 | 5 | 8 | 20 |
| Nord-Ubangi | Reproduction number at T+7 | 0.78 | 1.03 | 1.21 | 1.55 | 1.8 | 2.57 |
Forecast for each province
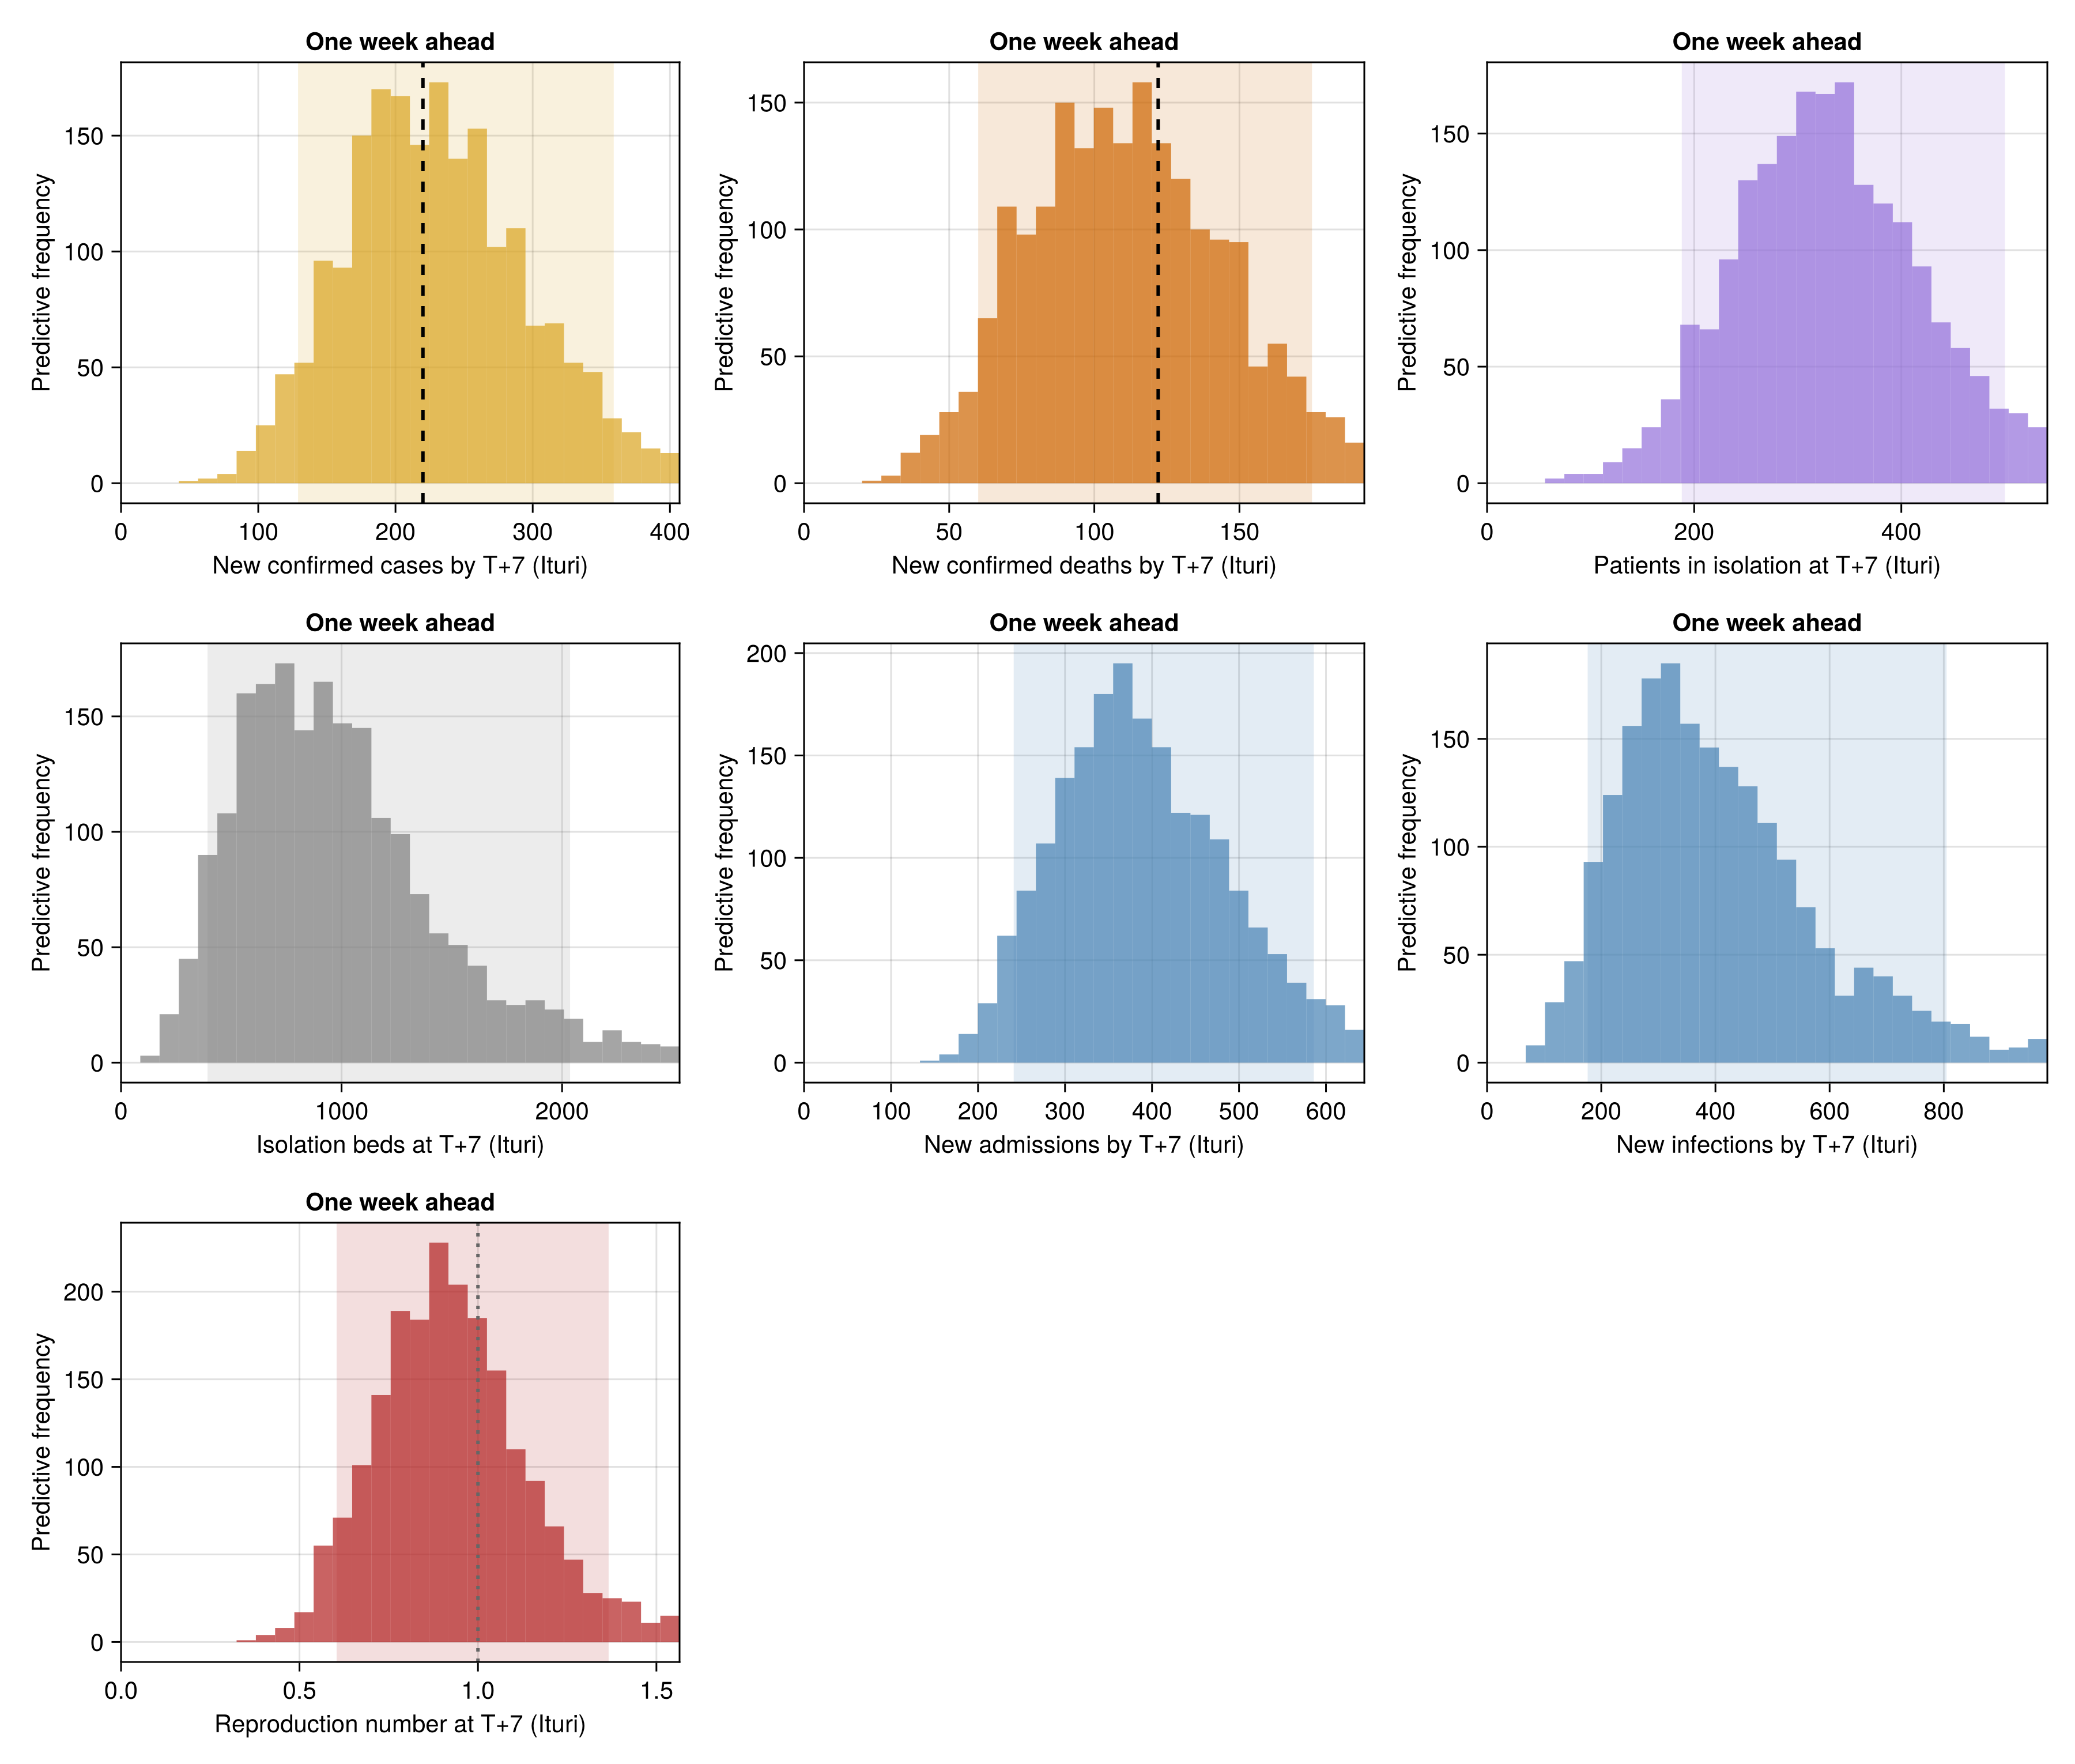
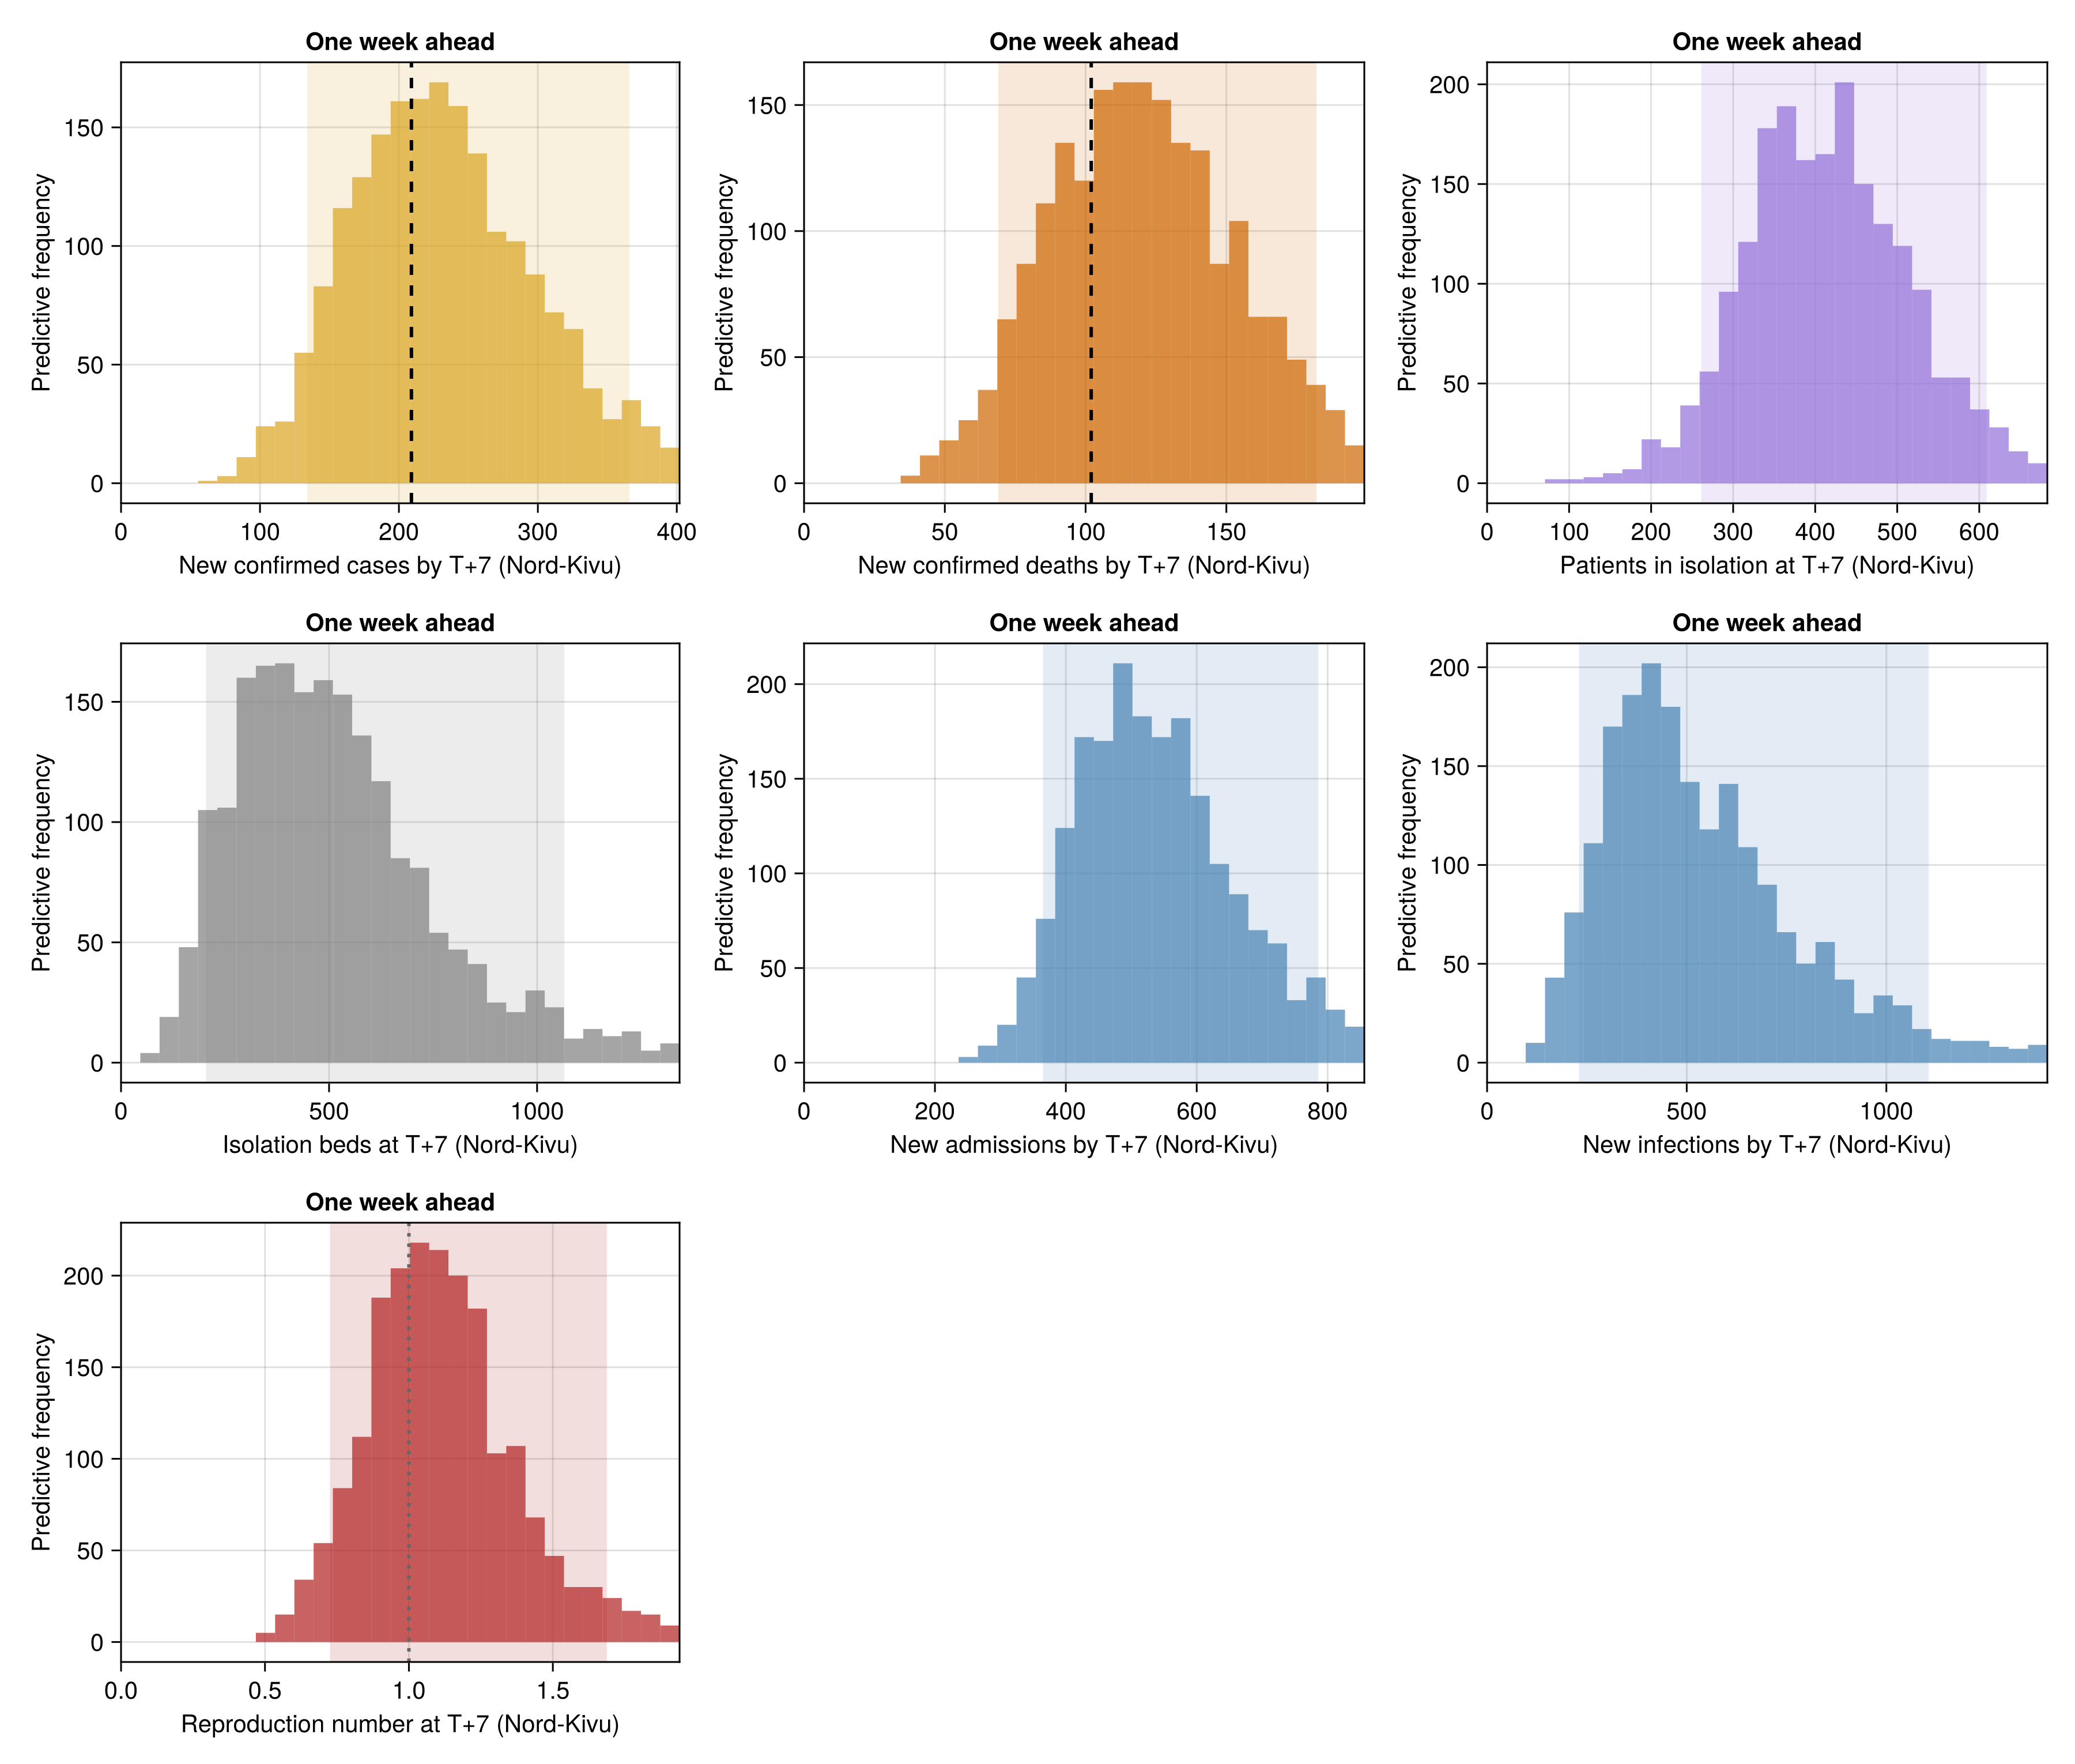
Each province's figure has one histogram per target with its 90% predictive interval shaded. The dashed rule on the case and death panels is the count the province reported over its most recent week.
Build the per-province figures
# The spatial tables' most recent week in each province, clamped as the
# compositions are, so a downward revision reads as no new cases.
recent_cases = province_recent_counts(
    obs.province_confirmed_history, PROVINCE_NAMES, N_PATCHES
)
recent_deaths = province_recent_counts(
    obs.province_death_history, PROVINCE_NAMES, N_PATCHES
)
function forecast_province_observed(p)
    o = (;)
    recent_cases === nothing ||
        (o = merge(o, (; confirmed_new = recent_cases.counts[p])))
    recent_deaths === nothing ||
        (o = merge(o, (; confirmed_deaths_new = recent_deaths.counts[p])))
    return o
end
forecast_province_fig(p) = plot_province_forecast_detail(
    province_draws, province_projection;
    province = p, n_patches = N_PATCHES,
    observed = forecast_province_observed(p)
)
# The province blocks below are written out one per patch.
@assert N_PATCHES == 8 && PROVINCE_LABELS[1:8] == [
    "Ituri", "Nord-Kivu", "Haut-Uele",
    "Sud-Kivu", "Tshopo", "Bas-Uele", "Sud-Ubangi", "Nord-Ubangi",
]
# Cases and deaths come from separate tables, so each stream's observed
# week is stated on its own.
function forecast_province_recent_week(r, stream)
    r === nothing &&
        return "The spatial tables carry no recent week of $(stream)."
    return string(
        "The observed week of $(stream) runs from ",
        grid_date(r.start_day), " to ", grid_date(r.last_day), "."
    )
end
recent_note = join(
    [
        forecast_province_recent_week(recent_cases, "confirmed cases"),
        forecast_province_recent_week(recent_deaths, "confirmed deaths"),
        "Each ends at its last spatial vintage, which can be earlier than " *
            "the cut-off.",
    ], " "
);
The observed week of confirmed cases runs from 2026-10-25 to 2026-11-01. The observed week of confirmed deaths runs from 2026-10-25 to 2026-11-01. Each ends at its last spatial vintage, which can be earlier than the cut-off.
Ituri
Nord-Kivu
Haut-Uele
Sud-Kivu
Tshopo
Bas-Uele
Sud-Ubangi
Nord-Ubangi
Saving province map assets
The dashboard map's province layer and its detail column read the per-province and national estimates and time series written here.
Write the province map estimates and time series
# The national row reads the joint's national reproduction number and
# case-fatality ratio and the provinces' summed forecasts, patients in
# isolation and beds.
province_map_dir = joinpath(
    pkgdir(BVDOutbreakSize), "docs", "src", "summary_assets"
)
mkpath(province_map_dir)
has_death_forecast = :confirmed_deaths_new in propertynames(province_projection)
has_care_forecast = :isolation_level in propertynames(province_projection) &&
    :bed_capacity in propertynames(province_projection)
has_care = BVDOutbreakSize._has_key(chn_joint, :province_bed_capacity)
# Patients in isolation over beds, draw by draw.
care_ratio(iso, beds) = [i ./ b for (i, b) in zip(iso, beds)]
province_care_forecast = has_care_forecast ? (;
        isolation_forecast = province_forecast_draws(:isolation_level),
        beds_forecast = province_forecast_draws(:bed_capacity),
        bed_use_forecast = care_ratio(
            province_forecast_draws(:isolation_level),
            province_forecast_draws(:bed_capacity)
        ),
    ) : (;)
CSV.write(
    joinpath(province_map_dir, "province_estimates.csv"),
    province_map_estimates(
        chn_joint, province_forecast_draws(:confirmed_new);
        n_patches = N_PATCHES,
        deaths_forecast = has_death_forecast ?
            province_forecast_draws(:confirmed_deaths_new) : nothing,
        confirmed_history = obs.province_confirmed_history,
        death_history = obs.province_death_history, cutoff = obs.cutoff,
        isolation_history = obs.province_isolation_history,
        bed_history = obs.province_bed_capacity_history, n = obs.n,
        province_care_forecast...
    )
);
national_forecast_draws(col) = let d = province_projection
    [float(sum(d[d.draw .== i, col])) for i in sort(unique(d.draw))]
end
# The provinces' cut-off draws summed into one national draw vector.
national_care_draws(key) = let v = BVDOutbreakSize._per_patch(
        chn_joint, key, N_PATCHES
    )
    [sum(x[i] for x in v) for i in eachindex(first(v))]
end
national_care = has_care ? (;
        isolation = [national_care_draws(:province_expected_isolation)],
        beds = [national_care_draws(:province_bed_capacity)],
        bed_use = care_ratio(
            [national_care_draws(:province_expected_isolation)],
            [national_care_draws(:province_bed_capacity)]
        ),
    ) : (;)
national_care_forecast = has_care_forecast ? (;
        isolation_forecast = [national_forecast_draws(:isolation_level)],
        beds_forecast = [national_forecast_draws(:bed_capacity)],
        bed_use_forecast = care_ratio(
            [national_forecast_draws(:isolation_level)],
            [national_forecast_draws(:bed_capacity)]
        ),
    ) : (;)
CSV.write(
    joinpath(province_map_dir, "national_estimates.csv"),
    province_map_estimates(
        [vec(Array(chn_joint[:R_T]))],
        [national_forecast_draws(:confirmed_new)];
        deaths_forecast = has_death_forecast ?
            [national_forecast_draws(:confirmed_deaths_new)] : nothing,
        cfr = [vec(Array(chn_joint[:CFR]))],
        confirmed_history = Dict("national" => obs.confirmed_history),
        death_history = Dict("national" => obs.confirmed_deaths_history),
        cutoff = obs.cutoff, patch_names = ["national"],
        patch_labels = ["National"],
        members = Dict("national" => ["national"]),
        isolation_history = Dict("national" => obs.isolation_history),
        bed_history = Dict("national" => obs.bed_capacity_history),
        n = obs.n, national_care..., national_care_forecast...
    )
);
# The daily reproduction number, the weekly confirmed cases and deaths and
# their posterior predictive, of each patch and of the country, keyed by
# the patch label, and the
# reported patients in isolation and beds over the same eight weeks, keyed
# by source province.
province_ts_rt_args = (;
    n = obs.n, breakpoint = _BREAKPOINT, rt_start = _rt_start_plot,
    rt_walk_start = clamp(_BREAKPOINT - RT_WALK_LEAD, _rt_start_plot, obs.n),
    ramp = RT_INTERVENTION_RAMP,
)
province_ts_inc = province_increment_matrix(
    obs.province_confirmed_history, PROVINCE_NAMES, N_PATCHES
)
province_ts_deaths = province_increment_matrix(
    obs.province_death_history, PROVINCE_NAMES, N_PATCHES
)
national_increments(c) = isempty(c) ? zeros(Int, 1, 0) :
    reshape([c[1]; max.(diff(c), 0)], 1, :)
# Each patch's and the country's weekly counts from their increments.
function province_weekly(inc, national)
    return vcat(
        weekly_count_table(
            inc.days, inc.increments, PROVINCE_LABELS[1:N_PATCHES];
            cutoff = obs.cutoff, n = obs.n
        ),
        weekly_count_table(
            national.days, national_increments(national.counts),
            ["National"]; cutoff = obs.cutoff, n = obs.n
        )
    )
end
# The joint's posterior predictive of the same weekly counts, binned into
# the same windows (see `joint_count_replicates` in `docs/pages/_setup.jl`).
# The country is left out, with a warning, when its replicates sit on
# other vintage days than its observed series over those weeks, since they
# would then be binned differently.
function province_weekly_fit(stream::Symbol, inc, national_days)
    r = getproperty(joint_count_replicates(), stream)
    as_matrix(reps) = permutedims(reduce(hcat, reps))
    t = weekly_quantile_table(
        inc.days, [as_matrix(p.replicates) for p in r.panels],
        PROVINCE_LABELS[1:N_PATCHES]; cutoff = obs.cutoff, n = obs.n
    )
    recent(d) = filter(>(obs.n - 7 * 8), d)
    if recent(r.national_days) != recent(national_days)
        @warn "National $(stream) fit left out of the province time series: " *
            "its replicates and observed counts are on different vintage days" replicated = recent(r.national_days) observed = recent(national_days)
        return t
    end
    return vcat(
        t, weekly_quantile_table(
            r.national_days, [as_matrix(r.national)], ["National"];
            cutoff = obs.cutoff, n = obs.n
        )
    )
end
# Tag a long table with the series it holds.
_with_series(t, s) = (t[!, :series] .= s; t)
CSV.write(
    joinpath(province_map_dir, "province_timeseries.csv"),
    vcat(
        _with_series(
            rt_quantile_table(
                [
                    reconstruct_patch_rt(
                        chn_joint; n_patches = N_PATCHES,
                        province_ts_rt_args...
                    );
                    [reconstruct_rt(chn_joint; province_ts_rt_args...)]
                ],
                [PROVINCE_LABELS[1:N_PATCHES]; "National"];
                cutoff = obs.cutoff, n = obs.n, from = _rt_start_plot
            ), "rt"
        ),
        _with_series(
            province_weekly(province_ts_inc, obs.confirmed_history), "cases"
        ),
        _with_series(
            province_weekly(province_ts_deaths, obs.confirmed_deaths_history),
            "deaths"
        ),
        _with_series(
            province_weekly_fit(
                :cases, province_ts_inc, obs.confirmed_history.days
            ), "cases_fit"
        ),
        _with_series(
            province_weekly_fit(
                :deaths, province_ts_deaths, obs.confirmed_deaths_history.days
            ), "deaths_fit"
        ),
        _with_series(
            reported_level_table(
                merge(
                    obs.province_isolation_history,
                    Dict("National" => obs.isolation_history)
                ); cutoff = obs.cutoff, n = obs.n, from = obs.n - 55
            ), "isolation"
        ),
        _with_series(
            reported_level_table(
                merge(
                    obs.province_bed_capacity_history,
                    Dict("National" => obs.bed_capacity_history)
                ); cutoff = obs.cutoff, n = obs.n, from = obs.n - 55
            ), "beds"
        );
        cols = :union
    )
);
# The same three tables into the release outputs, so each results release
# carries the dashboard map's province and national inputs at its cut-off.
output_dir = get(
    ENV, "BVD_OUTPUT_DIR",
    joinpath(pkgdir(BVDOutbreakSize), "output")
)
mkpath(output_dir)
for f in (
        "province_estimates.csv", "national_estimates.csv",
        "province_timeseries.csv",
    )
    cp(joinpath(province_map_dir, f), joinpath(output_dir, f); force = true)
end
The full analysis code, data and model definitions are in the epiforecasts/BVDOutbreakSize repository.