Methods
The data the estimates are built from, the model fitted to them, and how it is fitted and evaluated. The estimates themselves are on the other pages.
This page is generated from docs/pages/methods.jl. The model code it describes is in src/. See aim and origins and limitations.
Load packages, data and fitted chains
# Shared setup: packages, observations and the fit registry. See
# `docs/pages/_setup.jl`.
using BVDOutbreakSize
include(joinpath(pkgdir(BVDOutbreakSize), "docs", "pages", "_setup.jl"))validation_forecast_from (generic function with 1 method)Data
The DRC data come from the situation reports of the Institut National de Santé Publique (INSP, 2026). The early reports give the national cumulative suspected cases and deaths, laboratory-confirmed cases and deaths, and the specimens received and analysed by the laboratory, at the report date. The national cumulative suspected and laboratory totals stop at SitRep 016 (30 May). INSP began reclassifying suspects at SitRep 013 (27 May), so the cumulative suspected count falls. We freeze it at its last stable vintage (26 May). Where the cumulative series stop, we fit the daily new-suspect count ("nouveaux cas suspects du jour", from 4 June) and the daily new suspected-death count ("cas suspects du jour N (M deces)", from 7 June) as daily incidence.
The daily "Patients en isolement" count is the number of patients, confirmed plus suspected, in an isolation or treatment bed at the end of the day. We fit it from 1 June (SitRep 018), where the column becomes the all-patients "Patients en isolement - hospitalisation", as the running balance of modelled admissions and discharges. The suspects-only count in SitReps 016-017 is a different quantity and is left out. The cumulative "cumul guéris" total of confirmed cases recorded as recovered starts on 6 June, and we fit it as survivors among the modelled confirmed cases. From 13 June a Tableau 6 patient-movement table gives the daily admissions, in-care deaths, rule-outs and absconded flows, which we fit as four count streams of the same treatment-centre model. Its "dont confirmés (NC+AC)" and "dont suspects" sub-rows split the occupancy into two census streams that sum to the total each day.
We extracted these figures from the INSP PDFs with a language model and a second reading pass. The per-zone CSVs of the INRB-UMIE mirror (INRB-UMIE, 2026) serve only as a cross-check, because their zone sums drop counts not yet attributed to a zone and so understate the national totals.
The Uganda data are the cases and the one death exported across the border, from the WHO situation reports and Disease Outbreak News (World Health Organization, 2026). The cross-border traveller volume and source population come from McCabe and others (2026).
Province populations are 2019 figures from the DRC's Institut National de la Statistique, Annuaire statistique RDC 2020 (March 2021), as tabulated on the Wikipedia page for the provinces of the DRC (accessed 20 October 2026). Their relative sizes set the importation kernel and centre the background share, and their absolute sizes are the susceptible pools the renewal depletes. The kernel distances are between provincial population centres, the mean of each province's health-zone centroids weighted by WorldPop population (WorldPop, 2025), from the INRB-UMIE health-zone map (INRB-UMIE, 2026).
From SitRep 059 (12 July) the analytique-format reports also carry a raster figure of confirmed cases by symptom-onset date, split alive/deceased ("courbe épidémique par date de début des symptômes"). It has no data table, so we digitise it, and the symptom-onset reporting delay submodel accounts for the read error.
The first table lists each figure at the cut-off, or at the date reporting stopped for that stream. The second gives the per-date history of each situation-report stream, whose between-report increments the model fits.
Loading observations and building the data table
observations_table = DataFrame(
field = [
"exported_cases",
"exports_deaths",
"suspected_deaths",
"suspected_cases",
"confirmed_cases",
"confirmed_deaths",
"onset_curve_reported",
"specimens_analysed",
"treatment_admissions",
"treatment_deaths",
"treatment_ruleouts",
"treatment_absconded",
"genetic_tmrca_bound",
"daily_outbound_travellers (prior mean)",
"daily_outbound_travellers_sd (prior SD)",
"source_population",
],
date = [
history_last_date(grid_date, (; days = obs.export_case_days)),
history_last_date(grid_date, (; days = obs.export_death_days)),
hist_last_date(obs.deaths_history),
hist_last_date(obs.reported_history),
hist_last_date(obs.confirmed_history),
hist_last_date(obs.confirmed_deaths_history),
history_last_date(
grid_date, (; days = obs.onset_curve_history.report_days)
),
hist_last_date(obs.lab_history),
hist_last_date(obs.treatment_admissions_history),
hist_last_date(obs.treatment_deaths_history),
hist_last_date(obs.treatment_ruleout_history),
hist_last_date(obs.treatment_absconded_history),
grid_date(obs.n - obs.tmrca_days),
missing,
missing,
missing,
],
value = [
obs.exported_cases,
obs.exports_deaths,
obs.total_deaths,
obs.reported_cases,
obs.confirmed_cases,
obs.confirmed_deaths,
obs.onset_curve_history.last_total,
obs.tests_analysed,
isempty(obs.treatment_admissions_history.counts) ? missing :
obs.treatment_admissions_history.counts[end],
isempty(obs.treatment_deaths_history.counts) ? missing :
obs.treatment_deaths_history.counts[end],
isempty(obs.treatment_ruleout_history.counts) ? missing :
obs.treatment_ruleout_history.counts[end],
isempty(obs.treatment_absconded_history.counts) ? missing :
obs.treatment_absconded_history.counts[end],
obs.tmrca_days,
ITURI_DAILY_TRAVEL,
ITURI_DAILY_TRAVEL_SD,
ITURI_POPULATION,
]
);| field | date | value |
|---|---|---|
| exported_cases | 2026-05-23 | 3 |
| exports_deaths | 2026-05-14 | 1 |
| suspected_deaths | 2026-05-26 | 246 |
| suspected_cases | 2026-05-26 | 1077 |
| confirmed_cases | 2026-11-01 | 10532 |
| confirmed_deaths | 2026-11-01 | 5126 |
| onset_curve_reported | 2026-10-21 | 7715 |
| specimens_analysed | 2026-05-28 | 755 |
| treatment_admissions | 2026-08-02 | 147 |
| treatment_deaths | 2026-08-02 | 22 |
| treatment_ruleouts | 2026-08-02 | 93 |
| treatment_absconded | 2026-08-02 | 2 |
| genetic_tmrca_bound | 2026-03-15 | 231 |
| daily_outbound_travellers (prior mean) | 1871 | |
| daily_outbound_travellers_sd (prior SD) | 200 | |
| source_population | 4392200 |
Building the per-date time-series table
vintage_table = let
# Each history carries grid day-indices and counts; key the counts
# by calendar date so every stream lines up in one table.
bydate(h) = Dict(grid_date(d) => c for (d, c) in zip(h.days, h.counts))
streams = (
suspected_cases = bydate(obs.reported_history),
suspected_new_daily = bydate(obs.suspected_daily_history),
suspected_new_daily_deaths = bydate(obs.suspected_daily_deaths_history),
patients_isolated = bydate(obs.isolation_history),
suspected_deaths = bydate(obs.deaths_history),
confirmed_cases = bydate(obs.confirmed_history),
confirmed_deaths = bydate(obs.confirmed_deaths_history),
recovered_confirmed = bydate(obs.recovered_history),
specimens_received = bydate(obs.tests_received_history),
specimens_analysed = bydate(obs.lab_history),
)
dates = sort(collect(union((keys(s) for s in streams)...)))
at(s) = [haskey(s, d) ? s[d] : missing for d in dates]
DataFrame(
date = dates,
suspected_cases = at(streams.suspected_cases),
suspected_new_daily = at(streams.suspected_new_daily),
suspected_new_daily_deaths = at(streams.suspected_new_daily_deaths),
patients_isolated = at(streams.patients_isolated),
suspected_deaths = at(streams.suspected_deaths),
confirmed_cases = at(streams.confirmed_cases),
confirmed_deaths = at(streams.confirmed_deaths),
recovered_confirmed = at(streams.recovered_confirmed),
specimens_received = at(streams.specimens_received),
specimens_analysed = at(streams.specimens_analysed)
)
end;Per-date situation-report data table
| date | suspected_cases | suspected_new_daily | suspected_new_daily_deaths | patients_isolated | suspected_deaths | confirmed_cases | confirmed_deaths | recovered_confirmed | specimens_received | specimens_analysed |
|---|---|---|---|---|---|---|---|---|---|---|
| 2026-05-14 | 8 | 4 | ||||||||
| 2026-05-17 | 13 | 4 | ||||||||
| 2026-05-18 | 516 | 131 | 33 | 4 | ||||||
| 2026-05-19 | 575 | 148 | 51 | 4 | ||||||
| 2026-05-20 | 672 | 160 | 64 | 6 | ||||||
| 2026-05-21 | 745 | 175 | 83 | 9 | ||||||
| 2026-05-22 | 872 | 204 | 91 | 10 | ||||||
| 2026-05-23 | 904 | 220 | 101 | 10 | 418 | 211 | ||||
| 2026-05-24 | 906 | 223 | 105 | 10 | 431 | 295 | ||||
| 2026-05-25 | 998 | 238 | 106 | 12 | 431 | 295 | ||||
| 2026-05-26 | 1077 | 246 | 121 | 17 | 662 | 403 | ||||
| 2026-05-27 | 125 | 17 | 774 | 648 | ||||||
| 2026-05-28 | 210 | 17 | 883 | 755 | ||||||
| 2026-05-29 | 263 | 42 | ||||||||
| 2026-05-30 | 282 | 42 | ||||||||
| 2026-05-31 | 321 | 48 | ||||||||
| 2026-06-01 | 173 | 344 | 60 | |||||||
| 2026-06-02 | 206 | 363 | 62 | |||||||
| 2026-06-03 | 233 | 381 | 64 | |||||||
| 2026-06-04 | 153 | 258 | 452 | 82 | ||||||
| 2026-06-05 | 119 | 267 | 488 | 86 | ||||||
| 2026-06-06 | 117 | 283 | 515 | 91 | 12 | |||||
| 2026-06-07 | 94 | 35 | 309 | 550 | 101 | 19 | ||||
| 2026-06-08 | 138 | 41 | 297 | 598 | 115 | 22 | ||||
| 2026-06-09 | 119 | 30 | 260 | 635 | 127 | 30 | ||||
| 2026-06-10 | 119 | 50 | 262 | 676 | 136 | 32 | ||||
| 2026-06-11 | 168 | 64 | 315 | 689 | 139 | 32 | ||||
| 2026-06-13 | 136 | 49 | 359 | 782 | 181 | 40 | ||||
| 2026-06-14 | 165 | 54 | 363 | 808 | 192 | 48 | ||||
| 2026-06-15 | 235 | 61 | 376 | 837 | 196 | 49 | ||||
| 2026-06-16 | 192 | 46 | 379 | 875 | 202 | 67 | ||||
| 2026-06-17 | 151 | 35 | 383 | 896 | 232 | 78 | ||||
| 2026-06-18 | 238 | 54 | 416 | 933 | 245 | 80 | ||||
| 2026-06-19 | 162 | 47 | 361 | 956 | 247 | 92 | ||||
| 2026-06-20 | 201 | 30 | 365 | 1003 | 254 | 100 | ||||
| 2026-06-21 | 202 | 60 | 371 | 1048 | 267 | 112 | ||||
| 2026-06-22 | 131 | 44 | 387 | 1094 | 277 | 115 | ||||
| 2026-06-23 | 138 | 45 | 408 | 1118 | 291 | 122 | ||||
| 2026-06-24 | 154 | 40 | 385 | 1155 | 304 | 138 | ||||
| 2026-06-25 | 265 | 77 | 419 | 1203 | 321 | 148 | ||||
| 2026-06-27 | 239 | 70 | 502 | 1274 | 360 | 178 | ||||
| 2026-06-29 | 309 | 90 | 609 | 1333 | 399 | 189 | ||||
| 2026-06-30 | 301 | 77 | 1406 | 438 | 208 | |||||
| 2026-07-01 | 150 | 41 | 641 | 1460 | 452 | 213 | ||||
| 2026-07-02 | 213 | 63 | 628 | 1502 | 473 | 229 | ||||
| 2026-07-03 | 185 | 67 | 1528 | 492 | 239 | |||||
| 2026-07-04 | 354 | 110 | 1561 | 506 | 254 | |||||
| 2026-07-05 | 135 | 23 | 646 | 1624 | 521 | 273 | ||||
| 2026-07-06 | 237 | 70 | 680 | 1708 | 580 | 280 | ||||
| 2026-07-07 | 304 | 92 | 750 | 1759 | 600 | 285 | ||||
| 2026-07-08 | 227 | 60 | 764 | 1792 | 625 | 295 | ||||
| 2026-07-09 | 284 | 81 | 780 | 1830 | 648 | 300 | ||||
| 2026-07-10 | 299 | 91 | 763 | 1873 | 672 | 306 | ||||
| 2026-07-11 | 299 | 91 | 753 | 1926 | 702 | 318 | ||||
| 2026-07-12 | 268 | 736 | 1963 | 719 | 333 | |||||
| 2026-07-13 | 268 | 753 | 2011 | 754 | 366 | |||||
| 2026-07-14 | 418 | 736 | 2073 | 796 | 377 | |||||
| 2026-07-15 | 389 | 725 | 2124 | 828 | 390 | |||||
| 2026-07-17 | 236 | 722 | 2267 | 893 | 412 | |||||
| 2026-07-18 | 192 | 724 | 2344 | 930 | 466 | |||||
| 2026-07-19 | 252 | 734 | 2423 | 967 | 469 | |||||
| 2026-07-20 | 322 | 737 | 2473 | 999 | 482 | |||||
| 2026-07-21 | 306 | 738 | 2536 | 1033 | 506 | |||||
| 2026-07-22 | 318 | 722 | 2905 | 1269 | 519 | |||||
| 2026-07-23 | 315 | 766 | 2973 | 1309 | 540 | |||||
| 2026-07-24 | 274 | 755 | 3075 | 1354 | 556 | |||||
| 2026-07-25 | 340 | 773 | 3200 | 1405 | 571 | |||||
| 2026-07-26 | 326 | 723 | 3262 | 1437 | 583 | |||||
| 2026-07-27 | 321 | 733 | 3360 | 1487 | 597 | |||||
| 2026-07-30 | 374 | 748 | 3605 | 1587 | 651 | |||||
| 2026-07-31 | 321 | 760 | 3674 | 1621 | 666 | |||||
| 2026-08-01 | 227 | 690 | 3748 | 1657 | 708 | |||||
| 2026-08-02 | 275 | 707 | 3802 | 1707 | 727 | |||||
| 2026-08-03 | 289 | 717 | 3874 | 1751 | 749 | |||||
| 2026-08-04 | 267 | 674 | 3973 | 1801 | 776 | |||||
| 2026-08-05 | 282 | 694 | 4053 | 1851 | 793 | |||||
| 2026-08-06 | 721 | 4120 | 1887 | 810 | ||||||
| 2026-08-07 | 443 | 4209 | 1916 | 828 | ||||||
| 2026-08-08 | 258 | 722 | 4294 | 1960 | 849 | |||||
| 2026-08-09 | 242 | 704 | 4381 | 2011 | 869 | |||||
| 2026-08-10 | 389 | 716 | 4449 | 2061 | 886 | |||||
| 2026-08-11 | 325 | 570 | 4567 | 2128 | 918 | |||||
| 2026-08-12 | 328 | 634 | 4665 | 2184 | 965 | |||||
| 2026-08-13 | 330 | 749 | 4727 | 2214 | 976 | |||||
| 2026-08-14 | 403 | 777 | 4843 | 2272 | 1006 | |||||
| 2026-08-15 | 380 | 730 | 4945 | 2325 | 1040 | |||||
| 2026-08-16 | 272 | 751 | 5021 | 2378 | 1061 | |||||
| 2026-08-17 | 394 | 782 | 5105 | 2420 | 1091 | |||||
| 2026-08-18 | 389 | 730 | 5208 | 2476 | 1115 | |||||
| 2026-08-19 | 366 | 837 | 5290 | 2516 | 1152 | |||||
| 2026-08-20 | 301 | 737 | 5375 | 2557 | 1167 | |||||
| 2026-08-21 | 345 | 798 | 5458 | 2606 | 1182 | |||||
| 2026-08-22 | 212 | 808 | 5514 | 2642 | 1200 | |||||
| 2026-08-23 | 277 | 846 | 5584 | 2680 | 1215 | |||||
| 2026-08-24 | 311 | 792 | 5656 | 2715 | 1245 | |||||
| 2026-08-25 | 390 | 770 | 5713 | 2744 | 1269 | |||||
| 2026-08-26 | 431 | 843 | 5794 | 2786 | 1293 | |||||
| 2026-08-27 | 400 | 795 | 5863 | 2824 | 1318 | |||||
| 2026-08-28 | 395 | 896 | 5945 | 2862 | 1327 | |||||
| 2026-08-29 | 320 | 6041 | 2911 | 1366 | ||||||
| 2026-08-30 | 258 | 814 | 6100 | 2950 | 1383 | |||||
| 2026-08-31 | 454 | 830 | 6186 | 3007 | 1409 | |||||
| 2026-09-01 | 348 | 869 | 6250 | 3039 | 1439 | |||||
| 2026-09-02 | 433 | 770 | 6342 | 3072 | 1475 | |||||
| 2026-09-03 | 345 | 738 | 6436 | 3095 | 1495 | |||||
| 2026-09-04 | 399 | 817 | 6522 | 3134 | 1516 | |||||
| 2026-09-05 | 286 | 851 | 6604 | 3175 | 1548 | |||||
| 2026-09-06 | 215 | 819 | 6686 | 3226 | 1563 | |||||
| 2026-09-07 | 329 | 813 | 6757 | 3267 | 1590 | |||||
| 2026-09-08 | 408 | 833 | 6843 | 3310 | 1611 | |||||
| 2026-09-09 | 386 | 823 | 6942 | 3349 | 1647 | |||||
| 2026-09-10 | 429 | 837 | 7022 | 3398 | 1671 | |||||
| 2026-09-11 | 372 | 855 | 7113 | 3437 | 1692 | |||||
| 2026-09-12 | 445 | 923 | 7200 | 3475 | 1712 | |||||
| 2026-09-13 | 351 | 905 | 7258 | 3510 | 1726 | |||||
| 2026-09-14 | 413 | 938 | 7345 | 3545 | 1753 | |||||
| 2026-09-15 | 423 | 930 | 7404 | 3577 | 1776 | |||||
| 2026-09-16 | 417 | 905 | 7475 | 3605 | 1798 | |||||
| 2026-09-17 | 1329 | 930 | 7541 | 3639 | 1823 | |||||
| 2026-09-18 | 360 | 909 | 7614 | 3676 | 1864 | |||||
| 2026-09-19 | 427 | 886 | 7672 | 3699 | 1879 | |||||
| 2026-09-20 | 318 | 821 | 7733 | 3732 | 1902 | |||||
| 2026-09-21 | 359 | 839 | 7773 | 3759 | 1935 | |||||
| 2026-09-22 | 449 | 885 | 7820 | 3779 | 1951 | |||||
| 2026-09-23 | 353 | 893 | 7890 | 3799 | 1966 | |||||
| 2026-09-24 | 300 | 848 | 7946 | 3833 | 2001 | |||||
| 2026-09-25 | 321 | 828 | 7989 | 3852 | 2033 | |||||
| 2026-09-26 | 355 | 773 | 8067 | 3901 | 2070 | |||||
| 2026-09-27 | 283 | 803 | 8116 | 3924 | 2088 | |||||
| 2026-09-28 | 420 | 8171 | 3954 | 2105 | ||||||
| 2026-09-29 | 347 | 851 | 8224 | 3982 | 2121 | |||||
| 2026-09-30 | 425 | 842 | 8300 | 4018 | 2162 | |||||
| 2026-10-01 | 514 | 869 | 8376 | 4042 | 2182 | |||||
| 2026-10-02 | 405 | 846 | 8442 | 4080 | 2213 | |||||
| 2026-10-04 | 256 | 896 | 8603 | 4148 | 2235 | |||||
| 2026-10-05 | 498 | 890 | 8665 | 4178 | 2259 | |||||
| 2026-10-06 | 494 | 1066 | 8728 | 4205 | 2269 | |||||
| 2026-10-07 | 506 | 980 | 8787 | 4242 | 2292 | |||||
| 2026-10-08 | 950 | 8845 | 4275 | 2320 | ||||||
| 2026-10-09 | 473 | 946 | 8914 | 4315 | 2338 | |||||
| 2026-10-10 | 945 | 8978 | 4336 | 2356 | ||||||
| 2026-10-11 | 334 | 895 | 9066 | 4381 | 2389 | |||||
| 2026-10-12 | 522 | 899 | 9144 | 4410 | 2418 | |||||
| 2026-10-13 | 513 | 903 | 9212 | 4441 | 2448 | |||||
| 2026-10-14 | 612 | 924 | 9277 | 4478 | 2486 | |||||
| 2026-10-15 | 545 | 916 | 9348 | 4510 | 2507 | |||||
| 2026-10-16 | 530 | 9415 | 4536 | 2522 | ||||||
| 2026-10-17 | 458 | 925 | 9455 | 4561 | 2530 | |||||
| 2026-10-18 | 474 | 937 | 9552 | 4602 | 2550 | |||||
| 2026-10-19 | 556 | 1029 | 9637 | 4646 | 2574 | |||||
| 2026-10-20 | 663 | 1041 | 9704 | 4687 | 2595 | |||||
| 2026-10-21 | 481 | 1091 | 9765 | 4727 | 2618 | |||||
| 2026-10-22 | 451 | 1130 | 9816 | 4757 | 2635 | |||||
| 2026-10-23 | 549 | 1018 | 9876 | 4803 | 2646 | |||||
| 2026-10-24 | 1008 | 9964 | 4841 | 2670 | ||||||
| 2026-10-25 | 10060 | 4887 | 2684 | |||||||
| 2026-10-26 | 581 | 999 | 10141 | 4928 | 2708 | |||||
| 2026-10-27 | 632 | 936 | 10193 | 4960 | 2749 | |||||
| 2026-10-28 | 611 | 1052 | 10274 | 4992 | 2766 | |||||
| 2026-10-29 | 413 | 1101 | 10351 | 5026 | 2788 | |||||
| 2026-10-30 | 465 | 1002 | 10414 | 2803 | ||||||
| 2026-10-31 | 506 | 980 | 10467 | 5103 | 2824 | |||||
| 2026-11-01 | 342 | 961 | 10532 | 5126 | 2834 |
Model
Model overview
We fit one joint model to every national data stream and the provincial tables, on a daily grid from a seeding date to the cut-off (day
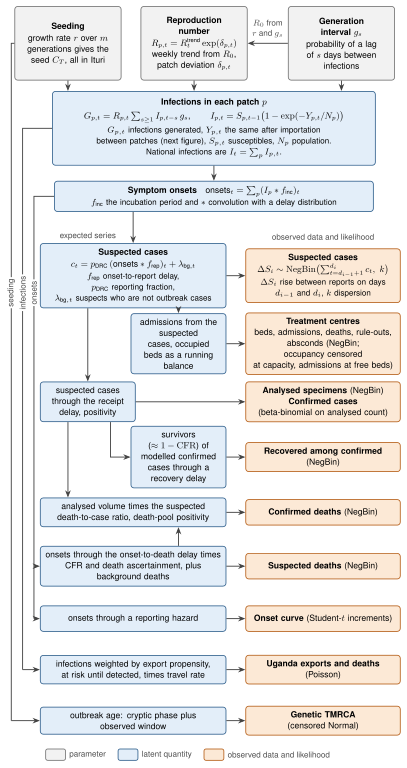
Importation couples the patches by moving a share of each day's new infections from one patch to another. The share follows a gravity kernel on population and distance, scaled by a partially pooled intensity for each origin patch that changes at detection. The outbreak starts from one unobserved seed growing exponentially in Ituri. The other patches start empty and grow their arrivals at their own reproduction number. The provincial confirmed cases, confirmed deaths, analysed specimens, isolation counts, beds and admissions enter only as splits of national or printed totals, so they inform only the split across patches.
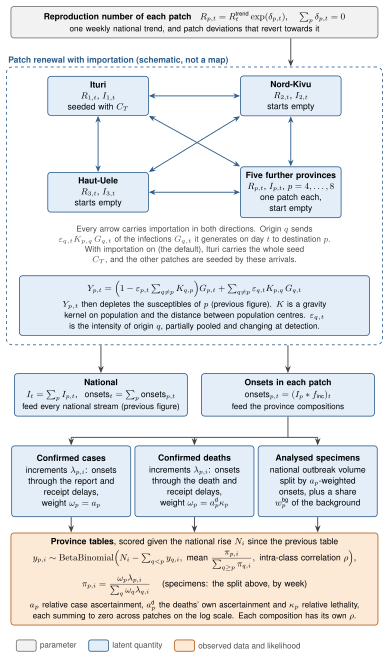
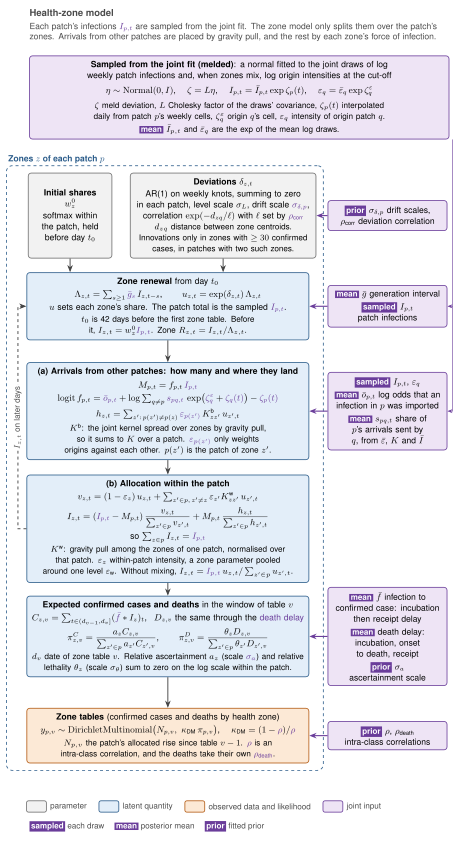
A health-zone model then splits each patch's infections across its zones without feeding back into the joint fit. It samples the weekly patch infections, the origin importation intensities and the generation-interval and delay parameters from a multivariate normal fitted to the log joint draws. We call this melding, since the joint posterior becomes the prior for these quantities. Five parameters shared by both levels, among them the drift scale and the composition overdispersions, take priors fitted to the joint draws.
Within each patch every zone runs its own renewal equation, with a transmission deviation that sums to zero over the patch. The zones share the infections their patch generated locally in proportion to their force of infection after movement between zones. Arrivals from other patches land in proportion to the force of infection in the sending zones, weighted by a gravity pull. The zone confirmed cases and deaths enter as compositions of the patch counts, so they inform only the split within each patch.
The model is built from Turing (Ge et al., 2018) submodels, one for each part of the generative process. We describe them in generative order, with each submodel's source in a collapsible block beneath its prose. The implementation uses Mooncake (Tebbutt and Ge, 2024) reverse-mode automatic differentiation, CensoredDistributions for delay discretisation, FlexiChains for chain handling, and PairPlots (Thompson, 2024) with AlgebraOfGraphics (Danisch and Krumbiegel, 2021) for the figures.
| Parameter | Exports | Deaths | Cases | Analysed | Confirmed | Conf. deaths | Export deaths |
|---|---|---|---|---|---|---|---|
| Reproduction number | ● | ● | ● | ● | ● | ● | ● |
| Generation interval | ● | ● | ● | ● | ● | ● | ● |
| Incubation period | ● | ● | ● | ● | ● | ● | ● |
| Cryptic-phase seed | ● | ● | ● | ● | ● | ● | ● |
| Onset-to-death delay | ● | ● | ● | ||||
| Case-fatality ratio | ● | ● | ● | ||||
| Death ascertainment | ● | ● | |||||
| Background CFR | ● | ● | |||||
| Onset-to-report delay | ● | ● | ● | ● | |||
| Receipt delay | ● | ● | ● | ||||
| Onset-to-hospitalisation delay | ● | ● | |||||
| Assay sensitivity / specificity | ● | ● | |||||
| Severity enrichment | ● | ||||||
| Death testing scaling | ● | ||||||
| Testing fraction | ● | ● | ● | ||||
| Background rate | ● | ● | ● | ● | ● | ||
| Surveillance dispersion | ● | ● | ● | ● | ● | ||
| Ascertainment | ● | ● | ● | ● | ● | ||
| Traveller volume | ● | ● |
Infections
Reproduction number
The reproduction number is the average number of further infections caused by each infection, and a value above one means infections are growing. Each patch's daily reproduction number combines a shared trend
The trend is held at the established reproduction number
The prior on
Daily
with
We sample each knot after the first as its total log reproduction number,
The deviations sit on the trend's weekly knots
with
sets the shape of the innovation covariance and
We report the per-patch innovation standard deviations
Submodel: patch_rt_model
@model function patch_rt_model(
n::Integer, n_patches::Integer,
log_R0_base::Real;
breakpoint::Union{Missing, Real} = missing,
week::Integer = 7,
rt_start::Integer = 1,
rt_walk_start::Integer = rt_start,
rt = rt_walk_model,
region_sd_prior = truncated(Normal(0, 0.15); lower = 0),
region_drift_sd_prior = truncated(Normal(0, 0.05); lower = 0),
region_halflife_prior = LogNormal(log(42), 0.6),
region_offset_prior = Normal(0, 1),
basis = sum_to_zero_basis(n_patches),
forecast::Union{Nothing, ForecastHorizon} = nothing
)
## Common national trend, the single-patch walk unchanged.
## `rt_walk_start` maps to `rt_start` in the inner model, matching the
## convention in [`infection_model`](@ref). Attached prefixed (no
## `false`), so the walk's parameters reach the chain as
## `rt_state.sigma_rw`, `rt_state.log_R0`, `rt_state.log_Rt_knots` and
## `rt_state.intervention_effect`, the names the analysis and sensitivity
## pages read. Attaching it unprefixed surfaces them bare and fails at
## render time on a KeyError.
fkw = forecast === nothing ? (;) : (; forecast)
rt_state ~ to_submodel(
rt(n, log_R0_base; breakpoint, rt_start = rt_walk_start, fkw...)
)
Rt_national = rt_state.Rt
## The deviations live on the same weekly knots as the national walk, so
## both processes are described at the same resolution.
days = knot_days(n; week, start = rt_walk_start)
nb = length(days)
## Grid length, past the cut-off when forecasting.
ng = length(Rt_national)
## Single patch. The deviations are sum-to-zero across the patches, so
## with one patch delta is identically zero and the patch Rt is the
## national walk. Sampling the deviation machinery would then add
## prior-only dimensions the likelihood never touches, so it is skipped
## entirely and `n_patches = 1` collapses this model exactly onto the
## single-population one.
if n_patches == 1
Tp1 = eltype(Rt_national)
δ_patch1 = zeros(Tp1, 1, ng)
Rt_matrix1 = zeros(Tp1, 1, ng)
@inbounds for t in 1:ng
Rt_matrix1[1, t] = Rt_national[t]
end
return (;
Rt_matrix = Rt_matrix1, Rt_national,
δ_patch = δ_patch1, δ_knots = zeros(Tp1, 1, nb),
σ_level = zero(Tp1), σ_δ = zeros(Tp1, 1),
Ω = ones(Tp1, 1, 1), drift_factor = zeros(Tp1, 1, 0),
δ_halflife = zero(Tp1),
sigma_rw = rt_state.sigma_rw,
log_R0 = rt_state.log_R0,
intervention_effect = rt_state.intervention_effect,
)
end
## Mean reversion. The deviations are an AR(1) toward zero on the knots,
## parameterised by the half-life of a provincial divergence in days,
## which is the elicitable quantity. The per-knot retention is
## `phi = 2^(-week / halflife)`, so a half-life far longer than the
## window recovers the random walk and a short one pulls each province
## back to the national trend between knots. One half-life is shared
## across provinces, not one each: the retention multiplies the whole
## deviation vector, and a sum-to-zero vector scaled by a scalar still
## sums to zero.
σ_level ~ region_sd_prior
δ_halflife ~ region_halflife_prior
φ = exp2(-week / δ_halflife)
## Loading matrices from the `n_patches - 1` sum-to-zero directions to
## the patches: a Bartlett factor of a Wishart covariance on the
## directions, whose prior treats every patch alike, gives the shape.
## The factor is rescaled to trace `n_patches - 1`, so `σ_drift` alone
## sets the size of the innovations and can shrink them to zero. With
## two patches there is one direction and no lower entry to draw.
nd = n_patches - 1
σ_drift ~ region_drift_sd_prior
bartlett_diag ~ product_distribution([Chi(nd - j + 1) for j in 1:nd])
if nd > 1
bartlett_lower ~ product_distribution(
fill(Normal(0, 1), nd * (nd - 1) ÷ 2)
)
else
bartlett_lower = Float64[]
end
A = bartlett_factor(bartlett_diag, bartlett_lower)
shape_scale = sqrt(nd / sum(abs2, A))
F_drift = sum_to_zero_factor(basis, σ_drift * shape_scale, A)
F_level = sum_to_zero_factor(basis, shape_scale, A)
## The level is drawn on the `n_patches - 1` directions at its own
## scale, centred: the province data pin the first knot, and a
## standard-normal draw times `σ_level` would leave the two on a curved
## ridge. Each later knot's innovation is a standard-normal draw.
u_level ~ product_distribution(fill(Normal(0, σ_level), nd))
z_drift ~ product_distribution(
fill(region_offset_prior, max(nd * (nb - 1), 1))
)
## One innovation column per knot after the first.
Z = nb > 1 ? reshape(z_drift, nd, nb - 1) : zeros(eltype(z_drift), nd, 0)
δ_knots = sum_to_zero_knots(F_level, F_drift, u_level, Z, φ)
## Interpolate each patch's deviation to the daily grid and build Rt.
## Past the cut-off the deviations carry on reverting on knots a week
## apart, with fresh standard-normal draws `z_drift_future` through the
## same fitted loading, so the future innovations keep the fitted
## sum-to-zero correlation. The fitted knots are kept as they are.
if forecast !== nothing
fdays = future_knot_days(n, horizon_days(forecast); week)
nf = length(fdays)
z_drift_future ~ product_distribution(
fill(region_offset_prior, nd * nf)
)
Tf = promote_type(eltype(δ_knots), eltype(z_drift_future))
knots_all = zeros(Tf, n_patches, nb + nf)
knots_all[:, 1:nb] .= δ_knots
sum_to_zero_ar1!(
knots_all, F_drift, reshape(z_drift_future, nd, nf), φ, nb
)
days_all = vcat(days, fdays)
else
knots_all = δ_knots
days_all = days
end
Rt_matrix = patch_rt_matrix(Rt_national, knots_all, days_all)
δ_patch = _detached(_daily_deviations, δ_knots, days, n)
drift_moments = _detached(sum_to_zero_moments, F_drift)
σ_δ = drift_moments.sd
Ω = drift_moments.cor
return (;
Rt_matrix, Rt_national, δ_patch, δ_knots,
σ_level, σ_δ, Ω, drift_factor = F_drift, δ_halflife,
sigma_rw = rt_state.sigma_rw, log_R0 = rt_state.log_R0,
intervention_effect = rt_state.intervention_effect,
)
endSubmodel: rt_walk_model
@model function rt_walk_model(
n::Integer, log_R0_base::Real;
week::Integer = 7,
breakpoint::Union{Missing, Real} = missing,
rt_start::Integer = 1,
ramp::Real = RT_INTERVENTION_RAMP,
sigma_prior = truncated(Normal(0, 0.1); lower = 0),
effect_prior = truncated(Normal(0, 0.4); upper = 0),
forecast::Union{Nothing, ForecastHorizon} = nothing
)
days = knot_days(n; week, start = rt_start)
nb = length(days)
## The established `R0` at the genetic bound is the base the walk grows
## from. It is derived and passed in, not sampled here, and tracked as a
## deterministic so it stays available on the chain.
log_R0 := log_R0_base
sigma_rw ~ sigma_prior
intervention_effect ~ effect_prior
ng = n + horizon_days(forecast)
ramp_shape = sigmoid_ramp(ng, breakpoint; ramp)
## The total log-Rt on the knot days after the first, ramp included. A
## single knot still draws one value so the chain key exists; it is
## unused.
shift = intervention_effect .* ramp_shape[days[min(2, nb):nb]]
log_Rt_knots ~ RandomWalkVector(log_R0, sigma_rw, shift)
log_R = vcat(log_R0, log_Rt_knots[1:(nb - 1)] .- shift[1:(nb - 1)])
## Past the cut-off the walk continues from its last fitted knot, one
## knot a week, with innovations of its own step size. They are a new
## variable, so the fitted knots and their density are untouched.
if forecast !== nothing
fdays = future_knot_days(n, horizon_days(forecast); week)
z_future ~ product_distribution(fill(Normal(0, 1), length(fdays)))
log_R = vcat(log_R, log_R[end] .+ cumsum(sigma_rw .* z_future))
days = vcat(days, fdays)
end
log_Rt = interpolate_knots(log_R, days, ng)
log_Rt = log_Rt .+ intervention_effect .* ramp_shape
Rt = exp.(log_Rt)
return (; Rt, log_R, days, sigma_rw, log_R0, intervention_effect)
endGeneration interval
The generation interval
both truncated below at one day. That puts 95% of the prior mean between 13.4 and 17.2 d and of the prior SD between 7.3 and 11.3 d. The Gamma shape is
Submodel: generation_interval_model
@model function generation_interval_model(
nmax::Integer;
mean_prior = truncated(Normal(15.3, 0.97); lower = 1),
sd_prior = truncated(Normal(9.3, 1.0); lower = 1)
)
gi_mean ~ mean_prior
gi_sd ~ sd_prior
α = (gi_mean / gi_sd)^2
θ = gi_sd^2 / gi_mean
## Unchecked, so a proposal that overflows `gi_mean` (as the step-size
## search at the start of warm-up can) gives a non-finite density the
## sampler rejects rather than a `DomainError` at `θ = 0`.
dist = Gamma(α, θ; check_args = false)
pmf = discretise_censored(dist, nmax)
g = pmf[2:end] ./ sum(pmf[2:end])
return (; g, gi_mean, gi_sd, gi_alpha = α, gi_theta = θ)
endSeeding and growth
We assume the outbreak began with a zoonotic spillover and grew deterministically through an unobserved cryptic exponential phase of
The traced 25 January death sits near the 87th percentile of this prior.
The BEAST X reanalysis of 139 Bundibugyo virus (BDBV) genomes (Mbala-Kingebeni and others, 2026) reports an Exponential-growth doubling time of 11.7 d (95% HPD 6.8–17.5). The prior on the growth rate
The outbreak is assumed to have begun in Ituri, the first patch:
with
Submodel: exponential_growth_model
@model function exponential_growth_model(
g::AbstractVector;
r_prior = LogNormal(log(log(2) / M_PRIOR_DOUBLING_DAYS), 0.3),
m_prior = truncated(Normal(2.75, 1.2); lower = 0)
)
r ~ r_prior
m ~ m_prior
## Mean generation interval, the unit `m` is counted in. `g` is indexed
## from one day, so the mean is `Σ i·g[i]`.
G := sum(i * g[i] for i in eachindex(g))
τ := log(2) / r
## Outbreak age is generations times the generation interval, so it does
## not depend on `r`.
T := m * G
## Daily incidence at the renewal start, grown from one infection per day
## at the origin over `T` days at the cryptic rate.
C_T := exp(r * T)
return (; τ, r, m, T, C_T, G)
endGenetic bound on outbreak age
The BEAST X analysis of 139 BDBV genomes from 16 health zones (Mbala-Kingebeni and others, 2026) places the TMRCA, the age of the oldest internal node of the tree, at a mean of 15 March 2026 (95% HPD 9 February to 12 April). It uses a strict molecular clock at an outbreak-specific rate of about
We treat the TMRCA day as a right-censored, noisy reading of the total outbreak age
The renewal starts, and sustained transmission is treated as established, 14 days after the TMRCA day (Equation (17)). The observed window from the renewal start to the cut-off is then shorter than the TMRCA age, so the bound informs the cryptic duration and places the origin at or before the most recent common ancestor. We take the TMRCA mean as given and carry its uncertainty only through
Submodel: genetic_seeding_model
@model function genetic_seeding_model(
T::Real,
tmrca_days::Union{Missing, Real}; tmrca_days_sd::Real = 16.0
)
if !ismissing(tmrca_days)
tmrca_days ~ censored(Normal(T, tmrca_days_sd); upper = tmrca_days)
end
return (; T, tmrca_days_sd)
endMixing and importation
We model connectivity between provinces as a gravity kernel, proportional to destination population and inverse to the distance between provincial population centres. Each origin column is scaled so that the share of its transmission that leaves is the population share of the rest of the country,
The intensity is one level per origin, partially pooled, and it changes at detection on the logistic ramp
with
The log flows
The renewal uses the flows with each origin's column rescaled to its gravity total, so the outflow and
A shift shared within an origin's column cancels in
The first term of
Each flow then has unit variance under
We draw the deviation in non-centred form,
with the rows of the flows
We use priors of
Submodel: province_importation_kernel
function province_importation_kernel(
pops::AbstractVector = PROVINCE_POPULATIONS;
distances::AbstractMatrix = province_distance_matrix(
PROVINCE_CENTRES[1:min(length(pops), end)]
),
decay::Real = PROVINCE_DISTANCE_DECAY
)
np = length(pops)
size(distances) == (np, np) || error(
"province_importation_kernel: `distances` is $(size(distances)) " *
"but there are $np provinces."
)
tot = sum(pops)
pull = gravity_pull(pops; distances, decay)
K = zeros(Float64, np, np)
@inbounds for q in 1:np
s = sum(@view pull[:, q])
s > 0 || continue
## Hold the column total at the pre-distance value, so the distance
## redistributes a province's exports without changing their volume.
outflow = 1 - pops[q] / tot
for p in 1:np
K[p, q] = outflow * pull[p, q] / s
end
end
return K
endInfection process
The renewal start and observed window from the genetic bound above are
The cryptic seeds fill the grid days before the renewal start, giving the recursion a full generation interval of history. Each patch then runs its own renewal with importation and depletion of its susceptible pool:
This is the population adjustment of Bhatt et al. (2023), as used in EpiNow2 (Abbott et al., 2020), with
The national reproduction number inverts the renewal equation on the summed infections:
is the headline
The headline outbreak size is the cumulative national infections at the cut-off. The total outbreak age is
The current growth rate is the exponential growth implied by the cut-off reproduction number and the generation interval through forward Euler–Lotka. The current doubling time is
Submodel: patch_infection_model
@model function patch_infection_model(
n::Integer, n_patches::Integer;
breakpoint::Union{Missing, Real} = missing,
rt_start::Integer = 1,
rt_walk_start::Integer = rt_start,
rt = patch_rt_model,
gi = generation_interval_model,
growth = exponential_growth_model,
gi_nmax::Integer = cdf_nmax(Gamma(2.71, 5.65)),
importation_kernel::AbstractMatrix = province_importation_kernel(
PROVINCE_POPULATIONS[1:min(n_patches, end)]
),
importation_epsilon_prior = Beta(1, 100),
importation_sd_prior = truncated(Normal(0, 0.5); lower = 0),
importation_effect_prior = Normal(0, 0.5),
importation_destination_sd_prior = truncated(Normal(0, 1); lower = 0),
importation_flow_sd_prior = truncated(Normal(0, 0.5); lower = 0),
importation_correlation_prior = Beta(2, 2),
seed_fraction_prior = LogNormal(log(0.05), 1.0),
basis = sum_to_zero_basis(n_patches),
flow_basis = flow_pair_basis(n_patches),
incubation = (nmax) -> censored_delay_model(
nmax;
mean_prior = truncated(Normal(6.3, 0.54); lower = 1),
sd_prior = truncated(Normal(3.5, 0.8); lower = 1)
),
incubation_nmax::Integer = cdf_nmax(lognormal_meansd(6.3, 3.5)),
populations::AbstractVector{<:Real} = n_patches == 1 ?
[float(sum(PROVINCE_POPULATIONS))] :
float.(PROVINCE_POPULATIONS[1:n_patches]),
forecast::Union{Nothing, ForecastHorizon} = nothing
)
## Grid length, past the cut-off `n` when forecasting.
ng = n + horizon_days(forecast)
fkw = forecast === nothing ? (;) : (; forecast)
## 1. Shared generation interval.
gi_state ~ to_submodel(gi(gi_nmax))
g = gi_state.g
## 2. One growth source, as in [`infection_model`](@ref). The prior is on
## the cryptic growth rate `r`, and the established `R0` (the walk
## base) is derived forward from it through Euler-Lotka.
growth_state ~ to_submodel(growth(g))
r_clock = growth_state.r
R0 = r_to_R0(r_clock, g)
## 3. Per-patch Rt: national trend plus per-patch deviations.
rt_state ~ to_submodel(
rt(
n, n_patches, log(R0);
breakpoint, rt_start, rt_walk_start, fkw...
), false
)
Rt_matrix = rt_state.Rt_matrix
δ_patch = rt_state.δ_patch
## 4. Per-patch seeds. The primary patch takes the cryptic exponential.
## Each secondary patch takes a fraction of that seed, which is the
## scale the data speak to. With importation off the relative seed
## sets the level of the provincial case split, leaving `δ_p` to be
## identified by its time trend. An absolute seed prior pinned far
## below the primary's `C_T` would force `δ_p` to absorb the whole
## level difference, making the reported provincial Rt gap an artefact
## of the seed prior.
renewal_start = clamp(rt_start, 1, n)
τ_obs = n - renewal_start
seed0_total = seed_at_renewal_start(growth_state.C_T)
## The outbreak is assumed to have begun in Ituri, so the primary patch
## takes the whole cryptic seed and the others are seeded by importation
## from it. An
## all-zero kernel leaves a secondary patch no route to infections at
## all, so the uncoupled path keeps the sampled fractions. With one patch
## there is nothing to seed and the fraction would be a prior-only
## dimension either way.
coupled = any(!iszero, importation_kernel)
if n_patches > 1 && !coupled
seed_fraction ~ product_distribution(
fill(seed_fraction_prior, n_patches - 1)
)
else
seed_fraction = Float64[]
end
Tp = promote_type(
eltype(Rt_matrix), eltype(g), typeof(float(r_clock)),
eltype(seed_fraction), typeof(float(seed0_total))
)
## The fractions partition the national cryptic seed, they do not add to
## it. `growth_state.C_T` is `exp(r·m·G)` and the `m` prior is
## elicited as a national quantity, so it is the national daily
## incidence at the renewal start.
## Dividing through by `(1 + Σf)` keeps the national seed at `C_T` for any
## number of patches, so `C_T` stays comparable across `n_patches` and the
## genetic prior keeps its meaning.
seed_shares = zeros(Tp, n_patches)
if isempty(seed_fraction)
seed_shares[1] = one(Tp)
else
seed_denom = one(Tp) + sum(seed_fraction)
seed_shares[1] = one(Tp) / seed_denom
@inbounds for p in 2:n_patches
seed_shares[p] = seed_fraction[p - 1] / seed_denom
end
end
seeds_matrix = zeros(Tp, n_patches, renewal_start)
@inbounds for p in 1:n_patches
## A scaled copy of the same cryptic curve: each province is a share
## of one epidemic, so it grows at the same clock rate `r` over the
## cryptic window.
s_p = seed_infections(
seed_shares[p] * seed0_total, r_clock, renewal_start
)
for j in 1:renewal_start
seeds_matrix[p, j] = s_p[j]
end
end
## 5. Importation intensity: one level per origin, partially pooled, and
## a common change at detection on the ramp the reproduction number
## already uses. Only sampled when the kernel couples the patches,
## since against an all-zero kernel it would be a prior-only dimension.
## Per origin because the provinces do not export alike and the kernel
## only carries size and distance. Pooled because the small provinces
## export too little for their own level to be identified, so
## `σ_ε → 0` recovers one shared intensity and a province the data say
## nothing about sits at the pooled mean. The deviations sum to zero,
## so `ε_bar` stays the overall level. They are drawn on the
## `n_patches - 1` sum-to-zero directions ([`sum_to_zero_basis`](@ref)),
## which gives the distribution of `n_patches` independent
## `N(0, σ_ε²)` draws with their mean subtracted, with no direction
## the likelihood cannot see. Time-varying because the
## outbreak being known changes movement, and the provinces that arrive
## either side of the breakpoint are what separates `β_ε`.
ε_matrix = zeros(Tp, n_patches, ng)
if coupled
ε_bar ~ importation_epsilon_prior
σ_ε ~ importation_sd_prior
z_ε ~ product_distribution(fill(Normal(0, 1), n_patches - 1))
β_ε ~ importation_effect_prior
log_ε_dev = sum_to_zero(sum_to_zero_factor(basis, σ_ε), z_ε)
ramp = sigmoid_ramp(ng, breakpoint)
## The prior sits four orders of magnitude below the cap at one, so
## the cap binds only in the far tail.
ε_matrix = importation_epsilon_matrix(ε_bar, log_ε_dev, β_ε, ramp)
importation_epsilon := ε_bar
importation_epsilon_sd := σ_ε
importation_epsilon_effect := β_ε
importation_epsilon_patch := ε_matrix[:, n]
## The log flows `log K + W` have a multivariate normal prior whose
## mean is the log gravity kernel, so gravity is the prior and `W` is
## the data's departure from it. `W = L ζ` is non-centred on the
## factor `L` of [`importation_flow_factor`](@ref), with `Σ = L Lᵀ`
## the sum of a destination effect and a flow term.
##
## The destination draws correlate `ρ_od` with each province's origin
## deviation and stay standard normal.
σ_dest ~ importation_destination_sd_prior
z_dest ~ product_distribution(fill(Normal(0, 1), n_patches - 1))
ρ_od_unit ~ importation_correlation_prior
ρ_od = _unit_to_correlation(ρ_od_unit)
z_od = ρ_od .* z_ε .+ sqrt(1 - ρ_od^2) .* z_dest
dest_dev = sum_to_zero(sum_to_zero_factor(basis, σ_dest), z_od)
## The flow term's correlation matrix gives each flow correlation
## `ρ_flow` with its reverse.
n_sym = size(flow_basis.symmetric, 2)
n_flow = n_sym + size(flow_basis.antisymmetric, 2)
if n_flow > 0
σ_flow ~ importation_flow_sd_prior
z_flow ~ product_distribution(fill(Normal(0, 1), n_flow))
if n_sym > 0
ρ_flow_unit ~ importation_correlation_prior
ρ_flow = _unit_to_correlation(ρ_flow_unit)
else
ρ_flow = -one(Tp)
end
flow_sd = σ_flow
ζ = vcat(z_od, z_flow)
importation_flow_sd := σ_flow
importation_reciprocity := ρ_flow
else
flow_sd = zero(Tp)
ρ_flow = -one(Tp)
ζ = z_od
end
L_flow = importation_flow_factor(
basis, flow_basis, σ_dest, flow_sd, ρ_flow
)
log_weight = reshape(L_flow * ζ, n_patches, n_patches)
weighted = destination_weighted_kernel(importation_kernel, log_weight)
importation_destination_sd := σ_dest
importation_destination_effect := dest_dev
importation_origin_destination_correlation := ρ_od
importation_flow_effect := vec(log_weight)
end
## 6. Multi-patch renewal. Each province runs its own renewal at its own
## reproduction number and the national trajectory is their sum. There
## is no separate national process and nothing rescales the patches to
## match one. `mu(t)` is a central trend the provinces pool toward, and
## the reproduction number the country actually ran at is read back off
## the summed infections in step 9.
renewal_state = patch_infections(
Rt_matrix, g, seeds_matrix, coupled ? weighted : importation_kernel,
ε_matrix, populations
)
infections_matrix = renewal_state.infections
importation_matrix = renewal_state.importation
## 7. National totals and headline quantities, which the fit reports and
## no likelihood reads.
headlines = _detached(_patch_headlines, infections_matrix, g, n)
## 8. Per-patch onsets through the shared incubation PMF.
inc_state ~ to_submodel(incubation(incubation_nmax))
onsets_matrix = convolve_rows(infections_matrix, inc_state.pmf)
## 9. Headline quantities, mirroring [`infection_model`](@ref) so a
## patch chain summarises exactly like a single-patch one.
T_total = growth_state.T + τ_obs
return (;
infections_matrix, onsets_matrix,
Rt_matrix, importation_matrix,
δ_patch, δ_knots = rt_state.δ_knots,
σ_level = rt_state.σ_level,
σ_δ = rt_state.σ_δ,
δ_halflife = rt_state.δ_halflife,
Ω = rt_state.Ω,
Rt_national = rt_state.Rt_national,
g, R0, r0 = r_clock,
m = growth_state.m, τ = growth_state.τ,
T = T_total,
seed_at_renewal_start = seed0_total, seed_fraction,
incubation_pmf = inc_state.pmf, populations,
headlines...,
)
endSubmodel: infection_model
@model function infection_model(
n::Integer;
breakpoint::Union{Missing, Real} = missing,
rt_start::Integer = 1,
rt_walk_start::Integer = rt_start,
rt = rt_walk_model,
gi = generation_interval_model,
growth = exponential_growth_model,
gi_nmax::Integer = cdf_nmax(Gamma(2.71, 5.65)),
population::Real = float(sum(PROVINCE_POPULATIONS)),
forecast::Union{Nothing, ForecastHorizon} = nothing
)
gi_state ~ to_submodel(gi(gi_nmax))
g = gi_state.g
## One growth source. The prior is on the cryptic exponential growth rate
## `r`, and the established reproduction number `R0` (the walk base) is
## derived forward from it through Euler–Lotka.
growth_state ~ to_submodel(growth(g))
r_clock = growth_state.r
R0 = r_to_R0(r_clock, g)
## The random walk's first knot sits at `rt_walk_start`, decoupled from
## the renewal start. The renewal seeds and grows from the genetic-TMRCA
## renewal start, but `R_t` is held flat at `R0` until the first
## situation report, because before any case or death surveillance the
## dynamics are unidentified and a free walk there only adds unsupported
## drift. `rt_walk_start` defaults to `rt_start`.
fkw = forecast === nothing ? (;) : (; forecast)
rt_state ~ to_submodel(
rt(n, log(R0); breakpoint, rt_start = rt_walk_start, fkw...)
)
Rt = rt_state.Rt
## The renewal-start seed is the daily incidence `C_T = exp(r·T)` reached
## after the cryptic phase's `m` generations. Grid days
## `1…renewal_start` are filled with the cryptic exponential curve at
## rate `r` ending at that seed, a full generation interval of history,
## and the renewal then runs forward from `renewal_start+1`.
renewal_start = clamp(rt_start, 1, n)
τ_obs = n - renewal_start
seed0 = seed_at_renewal_start(growth_state.C_T)
seed_vec = seed_infections(seed0, r_clock, renewal_start)
infections = renewal_infections(Rt, g, seed_vec, population)
cumulative = cumsum(infections)
## Total outbreak age: cryptic duration (m generations) plus the span.
T_total = growth_state.T + τ_obs
## Current growth rate at the cut-off, derived from the cut-off
## reproduction number net of depletion and the generation interval
## through forward Euler–Lotka, the inverse of the `r_to_R0` above. This
## makes the reported growth rate consistent with the adjusted `R_T` by
## construction, so `r < 0` iff `R_T < 1`. The realised last-two-days
## slope is not used: the intervention ramp depresses the final renewal
## step, so that slope can disagree in sign with `R_T`. Only `:=`
## quantities read it, so the gradient does not tape it.
r = _detached(_cutoff_growth_rate, Rt, cumulative, population, g, n)
return (;
infections, cumulative, Rt, g, seed_at_renewal_start = seed0,
population,
m = growth_state.m, τ = growth_state.τ, R0, r0 = r_clock, r,
doubling_time_initial = doubling_time(r_clock),
T = T_total, C_T = cumulative[n],
C_T_prior = growth_state.C_T, doubling_time = doubling_time(r),
seeding_age = seeding_age(upto(cumulative, n), n),
)
endEpidemiological process models
Incubation period
Each patch's infections are convolved with the incubation-period PMF to give its daily symptom-onset incidence. We use the Bundibugyo virus incubation-period estimate from the 2007 Uganda outbreak (mean 6.3 d, 95% CI 5.2-7.3,
both truncated below at one day.
Every delay is discretised to a daily PMF over lags
The primary event (the onset, say) is taken uniform over its day and the secondary event (the report) is interval-censored to its day, giving the daily PMF
which is then renormalised over lags
The incubation period also enters the infection-to-detection and infection-to-death delays for the export streams, where the survival clock runs from infection.
Submodel: onset_incidence_model
@model function onset_incidence_model(
infections::AbstractVector;
incubation = (nmax) -> censored_delay_model(
nmax;
mean_prior = truncated(Normal(6.3, 0.54); lower = 1),
sd_prior = truncated(Normal(3.5, 0.8); lower = 1)
),
incubation_nmax::Integer = cdf_nmax(lognormal_meansd(6.3, 3.5))
)
inc_state ~ to_submodel(incubation(incubation_nmax))
onsets = convolve_delay(infections, inc_state.pmf)
return (;
onsets, incubation_pmf = inc_state.pmf,
incubation_mean = inc_state.mean, incubation_sd = inc_state.sd,
)
endSubmodel: censored_delay_model
@model function censored_delay_model(nmax::Integer; mean_prior, sd_prior)
delay_mean ~ mean_prior
delay_sd ~ sd_prior
dist = lognormal_meansd(delay_mean, delay_sd)
return (;
pmf = discretise_censored(dist, nmax), dist,
mean = delay_mean, sd = delay_sd,
)
endOnset-to-report delay
The onset-to-report delay runs from symptom onset to a suspected case being detected and reported into surveillance. It is the onset-to-admission delay of a Bayesian reanalysis (Funk and Abbott, 2026) of the 2012 Isiro Bundibugyo virus outbreak line list (Rosello and others, 2015), with an implied mean of about 4 d. The onset-to-admission delay is used as a proxy for onset-to-report on the assumption that a case enters surveillance when first formally seen at a health facility. Its shape and scale take LogNormal priors centred on the reanalysis posterior, with the reported uncertainty carried to the log scale:
This delay drives the suspected-case, laboratory, treatment-centre and confirmed-death streams.
Onset-to-death delay
Following the line-list reanalysis (Funk and Abbott, 2026), the onset-to-death delay convolves two Gamma components, onset to admission and admission to death, each sampled on its natural shape and scale with priors centred on the reanalysis posteriors:
The admission-to-death shape is truncated below at 0.01 and its scale at 0.1. The onset-to-death PMF is the convolution of the two discretised components (implied mean about 13 d). Its source is shown with the deaths submodel.
Onset-to-hospitalisation delay (exports)
Detection at a point of entry abroad is the same event as a domestic suspected-case report, so the export model uses the onset-to-admission delay (Funk and Abbott, 2026) with the same priors as the onset-to-report delay:
It drives the exports streams, and its source is shown with the exports submodel.
Report-to-analysed delay
The report-to-analysed delay runs from a suspected case being reported to its specimen being analysed by the laboratory. Its prior is our own choice, a short turnaround with a heavy right tail for shipment to a confirmatory laboratory and the analysis queue:
both truncated below at one day. It drives the laboratory analysed-specimen volume, the confirmed cases and the confirmed deaths, and its source is shown with the laboratory submodel. The onset-to-sample cohort of (Akilimali et al., 2026) grounds the sum of the onset-to-report and report-to-analysed delays. Its reported mean (7.4 d, 95% CrI 5.3 to 13.5) and median (4.8 d, 3.46 to 7.84) enter as Normal terms on the mean and median of the summed delay, each with SD the CrI half-width over 1.96.
Case-fatality ratio
The US Centers for Disease Control and Prevention (CDC) summary for the two previous BVD outbreaks is
with mean
Submodel: cfr_model
@model function cfr_model(; cfr_prior = Beta(6.6, 13.4))
CFR ~ cfr_prior
return (; CFR)
end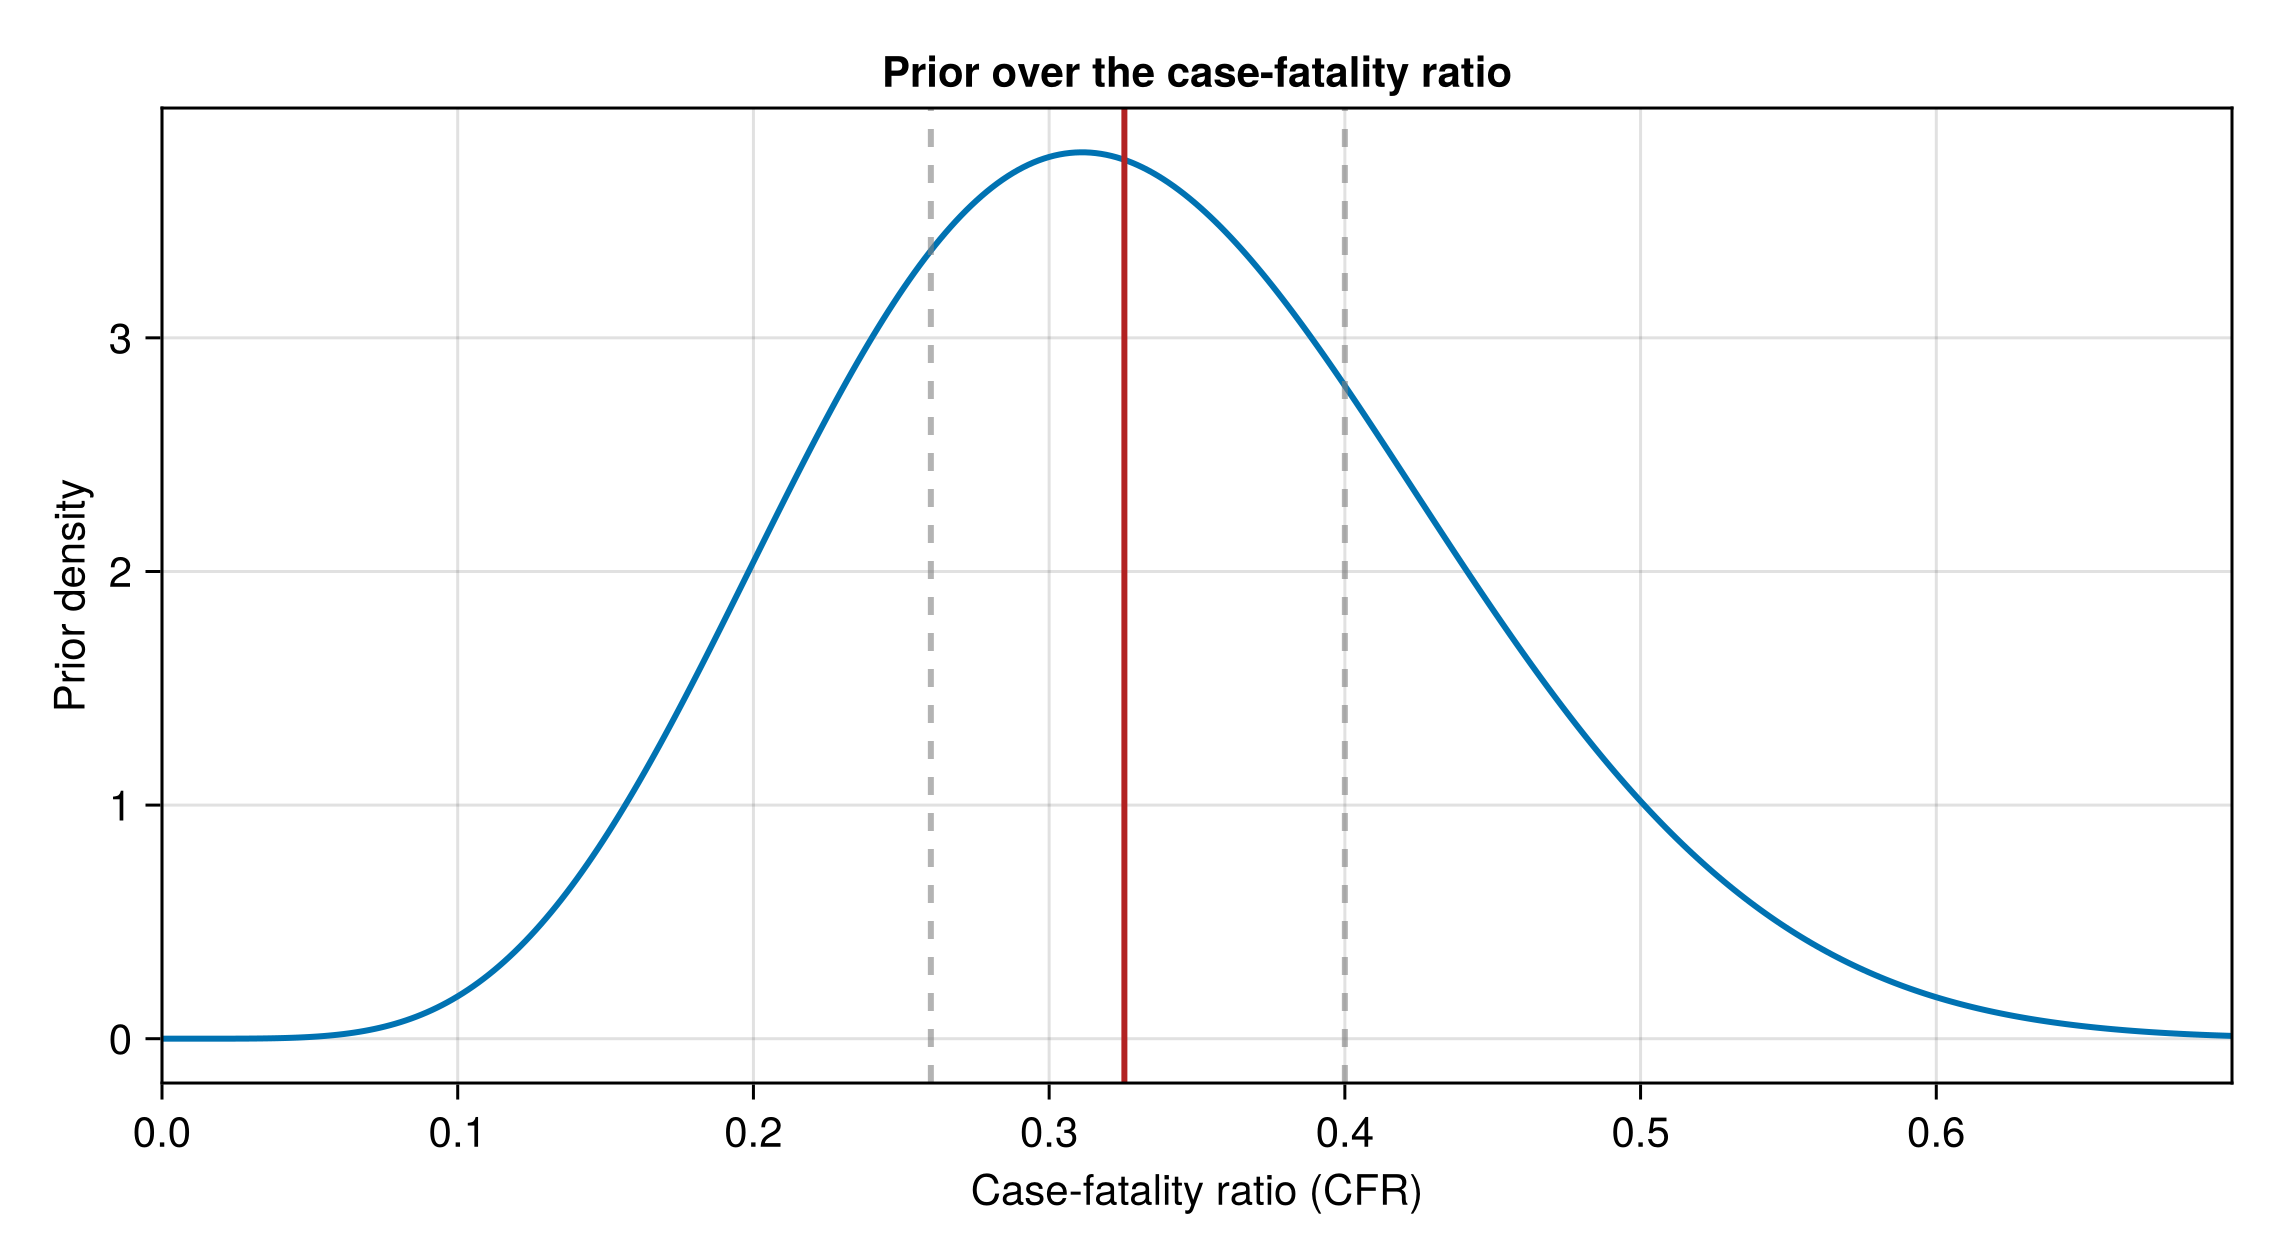
Observation models
Each observation submodel takes the shared daily onset incidence, convolves it with a sampled onset-to-event delay, and scales it by the relevant ascertainment, case-fatality ratio or positivity factor. It then reads the modelled count off the daily series at each vintage day. Likelihoods score the between-vintage increments.
Shared observation submodels
The streams share the surveillance dispersion, the ascertainment fractions, the laboratory priors and the traveller volume.
Surveillance dispersion
Each passive-surveillance count stream has its own negative-binomial dispersion, partially pooled across the streams. Following Stan prior-choice recommendations (Stan Development Team, 2024), the dispersion is sampled on the
for each of the six count streams
Submodel: pooled_dispersion_model
@model function pooled_dispersion_model(
n_streams::Integer;
mean_prior = Normal(log(0.6), 0.33),
sd_prior = truncated(Normal(0, 0.6); lower = 0),
centred::Bool = true
)
μ_log ~ mean_prior
τ ~ sd_prior
m = max(n_streams, 1)
if centred
## Draw each stream's `log(1/sqrt(k))` directly from the population.
## `eps` floors the SD so a `τ ≈ 0` draw stays a proper distribution.
log_isk ~ product_distribution(
fill(Normal(μ_log, τ + eps(typeof(τ))), m)
)
inv_sqrt_k = exp.(log_isk[1:n_streams])
else
z ~ product_distribution(fill(Normal(0, 1), m))
inv_sqrt_k = exp.(μ_log .+ τ .* z[1:n_streams])
end
k = 1.0 ./ (inv_sqrt_k .^ 2 .+ eps(eltype(inv_sqrt_k)))
k_pop = 1.0 / (exp(μ_log)^2 + eps(typeof(float(μ_log))))
return (; k, inv_sqrt_k, k_pop, μ_log, τ)
endAscertainment
Two surveillance systems each detect a fraction of the true cases, DRC passive community surveillance (the suspected cases) and Uganda's point-of-entry and hospital surveillance (the exported cases). The two ascertainment fractions
Submodel: pooled_ascertainment_model
@model function pooled_ascertainment_model(;
mu_prior = Normal(logit(0.75), 1.0),
tau_prior = truncated(Normal(0, 0.5); lower = 1.0e-4)
)
μ_logit ~ mu_prior
τ_logit ~ tau_prior
z_drc ~ Normal(0, 1)
z_uganda ~ Normal(0, 1)
logit_p_drc = μ_logit + τ_logit * z_drc
logit_p_uganda = μ_logit + τ_logit * z_uganda
p_drc := logistic(logit_p_drc)
p_uganda := logistic(logit_p_uganda)
return (; μ_logit, τ_logit, p_drc, p_uganda)
endLaboratory priors
The testing fraction
We assume more severe cases, which are more likely to be BVD, are tested preferentially. An enrichment factor
The non-BVD background rate
Submodel: test_positivity_model
@model function test_positivity_model(;
lambda_prior = truncated(Normal(0.0, 1.0); lower = 0),
fraction_tested_prior = Beta(5.0, 2.0)
)
λ_bg ~ lambda_prior
τ_test ~ fraction_tested_prior
return (; λ_bg, τ_test)
endSubmodel: test_sensitivity_model
@model function test_sensitivity_model(;
sensitivity_prior = Beta(38.0, 2.0)
)
s_test ~ sensitivity_prior
return (; s_test)
endSubmodel: test_specificity_model
@model function test_specificity_model(; specificity_prior = Beta(60.0, 2.0))
spec ~ specificity_prior
return (; spec)
endSubmodel: severity_enrichment_model
@model function severity_enrichment_model(;
logodds_prior = truncated(Normal(1.5, 0.75); lower = 0),
decay_prior = truncated(Normal(0.0, 200.0); lower = 0.0)
)
δ0 ~ logodds_prior
decay_scale ~ decay_prior
return (; δ0, decay_scale)
endSubmodel: death_testing_scaling_model
@model function death_testing_scaling_model(;
scaling_prior = LogNormal(0.0, 0.25)
)
scaling ~ scaling_prior
return (; scaling)
endSubmodel: specimen_intensity_model
@model function specimen_intensity_model(;
intensity_prior = LogNormal(0.0, 0.25)
)
κ ~ intensity_prior
return (; κ)
endSubmodel: death_ascertainment_model
@model function death_ascertainment_model(;
ascertainment_prior = Normal(logit(0.9), 0.5)
)
logit_p_death ~ ascertainment_prior
p_death := logistic(logit_p_death)
return (; p_death, logit_p_death)
endSubmodel: background_cfr_model
@model function background_cfr_model(; cfr_prior = Beta(2.0, 18.0))
cfr_bg ~ cfr_prior
return (; cfr_bg)
endTraveller volume
The number of people crossing from the source area to Uganda each day sets the travel rate in the exports likelihood, and we estimate it. McCabe et al. Table 3 records mean weekly passenger counts across seven points of entry. The Ituri-side daily total of
Submodel: traveller_volume_model
@model function traveller_volume_model(;
mean::Real = ITURI_DAILY_TRAVEL,
sd::Real = ITURI_DAILY_TRAVEL_SD
)
daily_travellers ~ truncated(Normal(mean, sd); lower = 0)
return (; daily_travellers)
endReported cases
Reported suspected cases are a BVD component plus a non-BVD background. The BVD component is the daily onsets convolved with the onset-to-report delay
used for every delay below. We write the BVD onset-to-report series at unit ascertainment as
The background is a per-day rate
The rate is zero before the surveillance onset, a report-to-receipt lead before the first suspected-case report. It ramps in linearly over the first seven days after the onset. It is shared, with one innovation SD
Each patch
in every stream below that reads the BVD suspected cases, and
The per-vintage increments are scored with a NegBinomial with the suspected-case dispersion
The cumulative suspected total is frozen at 26 May (see Data). From 4 June to the cut-off the daily new-suspect count
The suspected deaths are fitted the same way. Their cumulative total freezes at 26 May, and the daily new suspected-death count from 7 June to 11 July is scored against the modelled daily suspected deaths with a NegBinomial with dispersion
Submodel: reported_cases_model
@model function reported_cases_model(
reported_history,
reported_cases::Union{Missing, Integer},
onsets::AbstractVector, k::Real, p_drc::Real;
suspected_daily_history = (; days = Int[], counts = Int[]),
positivity = test_positivity_model(),
background_re = nothing,
## Onset to a suspected case being detected/reported, from the
## line-list onset→admission delay (d_oa, ~4 d): a case enters
## surveillance when first formally seen, so one delay serves both the
## suspect-case and export streams. The line-list onset→notification
## delay (~20 d) is not used: it is assumed to reflect a longer
## pathway (likely confirmation and administrative processing),
## though what it captures is uncertain.
onset_to_report = gamma_delay_model(
cdf_nmax(Gamma(1.178, 3.694));
alpha_prior = LogNormal(log(1.178), 0.25),
theta_prior = ONSET_ADMISSION_THETA_PRIOR
),
cutoff::Union{Nothing, Integer} = nothing,
simulated = nothing
)
pos_state ~ to_submodel(positivity)
report_state ~ to_submodel(onset_to_report)
λ_bg = pos_state.λ_bg
τ_test = pos_state.τ_test
report_pmf = report_state.pmf
## Unit-ascertainment BVD onset-to-report daily series, reused by the
## confirmed stream.
bvd_reports_daily = convolve_delay(onsets, report_pmf)
n = length(bvd_reports_daily)
nc = something(cutoff, n)
vobs = vintage_obs(reported_history, reported_cases, nc)
## Daily non-BVD background. `nothing` (the renewal default) holds it at
## the constant scalar `λ_bg` over the grid. An injected `background_re`
## is the smooth daily random walk ([`background_walk_model`](@ref)),
## whose level `λ_mu` then overrides `λ_bg` from `positivity`.
if background_re === nothing
λ_bg_base = λ_bg
bg_sigma = zero(λ_bg)
bg_daily = fill(λ_bg, n)
else
bg_state ~ to_submodel(
cutoff === nothing ? background_re(n) : background_re(n; cutoff)
)
λ_bg_base = bg_state.λ_mu
bg_sigma = bg_state.σ_bg
bg_daily = bg_state.λ
end
reports_daily = p_drc .* bvd_reports_daily .+ bg_daily
modelled_increments = bin_increments(reports_daily, vobs.days)
reported_increments ~ to_submodel(
vintage_increments_model(
modelled_increments,
_sim_obs(simulated, :reported_increments, vobs.obs_increments), k
)
)
## The mean for day `d` is the single-day `reports_daily[d]`, not a
## between-vintage increment: this is a genuine daily incidence, so it
## never differences a falling cumulative.
sd_days = suspected_daily_history.days
sd_modelled = [reports_daily[clamp(Int(d), 1, n)] for d in sd_days]
sd_obs = isempty(suspected_daily_history.counts) ? missing :
collect(Int.(suspected_daily_history.counts))
suspected_daily ~ to_submodel(
vintage_increments_model(
sd_modelled, _sim_obs(simulated, :suspected_daily, sd_obs), k
)
)
raw_total = sum(upto(reports_daily, nc))
expected_reports := safe_rate(raw_total)
## Implied per-suspected positivity at the cut-off: the BVD share of the
## expected suspected total.
bvd_total = p_drc * sum(upto(bvd_reports_daily, nc))
positivity := safe_rate(bvd_total) / expected_reports
bg_total = sum(upto(bg_daily, nc))
return (;
p_drc, λ_bg = λ_bg_base, τ_test, report_pmf,
report_mean = report_state.mean, report_sd = report_state.sd,
bvd_reports_daily,
reports_daily, expected_reports, positivity, bg_daily, bg_sigma,
bg_total,
)
endTreatment-centre flow
The treatment-centre stream models the occupied beds, the daily admissions and the daily discharges by outcome (in-care deaths, rule-outs and absconds) of the isolation and treatment centres. The occupancy is the page-one "Patients en isolement - hospitalisation" count from 1 June. The flows and the confirmed and suspected sub-stocks are read from the Tableau 6 patient-movement table from 13 June.
Each patient follows two parallel processes, a clinical course and a laboratory label. The clinical course sets how long a patient occupies a bed and how they leave it, and so sets the total occupancy and every discharge flow. The laboratory label only relabels a patient from suspected to confirmed, which sets the suspected and confirmed split of the census. Death is clinical and happens under either label, so a true case may die before its test confirms it.
A proportion
each carried through a short suspected-to-admission delay that captures triage, transport and the wait for a bed. A BVD true case leaves by dying at the in-care case-fatality ratio
Each day's occupancy is the previous day's bed stock plus the day's admissions, less its deaths, recoveries, rule-outs and absconds. The abscond outflow drains the suspected pool at a small daily fraction
and the total bed demand is
with
Absconding competes with the clinical exits, so each discharge flow is thinned by the abscond survival over the stay, written here for deaths,
and likewise for recoveries and rule-outs. Only the suspected pool absconds.
The death flow is the in-care fatality applied to the BVD inflow over the admission-to-death stay, scored against the reported in-care deaths of both labels together. The in-care fatality is a sampled log-odds modifier
It is the case-fatality ratio conditional on admission, below the infection case-fatality ratio where care lowers mortality. We report it with
Confirmation moves a true case already in a bed from the suspected to the confirmed sub-stock at the daily hazard
The confirmed-in-care stock is tracked by admission cohort. Each true-case admission carries two clocks from the day it enters a bed, a confirmation clock and a clinical-stay clock. It counts toward the confirmed census only once it has been confirmed and while it is still in a bed,
with
and
the probability an admitted case is still in a bed after
Carrying the confirmation and stay clocks separately keeps cases that die before their test returns out of the confirmed pool. The suspected sub-stock is the remainder
Capacity enters only as a censored observation, and the latent demand is uncapped. The log bed capacity is a local linear trend on weekly knots whose weekly growth follows a random walk. The growth starts at
The occupied beds are scored as the latent demand right-censored at the recorded implied capacity, or at the observed count where that is higher. The occupancy and a flow stream are scored as
with
Here
The bed shortfall above capacity comes from the demand model and its priors. The model exposes the cut-off occupancy on the reported scale (the demand plus the reclassification offset, floored at zero) and the cut-off bed demand (the need under unconstrained supply). It also exposes the bed shortfall (the bed demand above the national beds) and the utilisation (the modelled occupancy over the beds). The utilisation can exceed 100%, since the modelled occupancy is uncapped.
Each province's cut-off beds are its share of the capacity walk, and its occupancy is its demand share of the national occupancy. The national beds and occupancy are the sums over the provinces. A province's patients above its beds are its occupancy above its own beds.
The total occupancy is fitted from 1 June (SitRep 018). From 13 June the report adds a two-row breakdown into confirmed and suspected beds that sums to the total each day. The daily flows and the confirmed and suspected census are scored on the days they exist, with each day scored on either the total or the split. The split is scored only where the laboratory pipeline supplies a non-zero confirmation hazard.
An overnight reclassification of the total is modelled on break days. The break days are listed by hand where the published start-of-day in-bed count differs from the previous report day's occupancy by more than a threshold. One step is fitted per listed day, with a prior centred on zero with SD 25 beds. The steps accumulate into a persistent additive offset
The reports also print the patients in isolation and the beds by province, for whichever provinces report that day. Both enter as splits of the printed sum of the provinces present. Each patch's BVD admissions are its detected BVD suspects through the admission delay, and together they are the national BVD admissions:
We assume a province's admission of non-BVD suspects can differ from its share of them and can change as treatment centres open. Each patch takes a daily share
normalised over the patches each day, with
The walk
Each patch's approximate stock is its BVD admissions through the clinical-stay survival plus its non-BVD admissions through the rule-out stay, and the national demand
is the rule-out cohort's exact survival under the running balance of Equation (36), absconding included. The confirmation relabelling and the absconding of unconfirmed cases are shared across patches, so they cancel from the shares only approximately. Each patch's capacity on day
normalised over the patches each day. The floor
with
Submodel: treatment_flow_model
@model function treatment_flow_model(
isolation_history,
bvd_reports_daily::AbstractVector,
bg_daily::AbstractVector,
p_drc::Real,
CFR::Real;
capacity_history = (; days = Int[], counts = Int[]),
admissions_history = (; days = Int[], counts = Int[]),
deaths_history = (; days = Int[], counts = Int[]),
ruleout_history = (; days = Int[], counts = Int[]),
absconded_history = (; days = Int[], counts = Int[]),
## Tableau 6 occupancy split (`dont confirmés` / `dont suspects`): two
## census series scored in place of the total occupancy on the days
## they are present, only when the confirmation hazard is non-zero.
confirmed_incare_history = (; days = Int[], counts = Int[]),
suspect_incare_history = (; days = Int[], counts = Int[]),
## Daily in-care confirmation hazard `τ_test · p_pos` borrowed from
## the lab pipeline ([`confirmed_cases_model`](@ref)). `nothing`
## (standalone, no lab stream) gives a zero hazard, so the confirmed
## sub-stock stays empty and the suspect sub-stock carries the whole
## occupancy.
conf_hazard_daily::Union{Nothing, AbstractVector} = nothing,
## The priors and delay submodels the keywords below default to.
defaults = treatment_flow_defaults(),
admission = defaults.admission,
severity = defaults.severity,
capacity = bed_capacity_walk_model,
dispersion = defaults.dispersion,
## Dispersion of the stocks (occupancy, beds and the in-care census),
## injected from the joint composer's pooled set (`k_external`).
## Standalone it samples its own.
k_external::Union{Nothing, Real} = nothing,
## Dispersion of the four daily flows (admissions, in-care deaths,
## rule-outs and absconds), drawn about `k` with SD
## `flow_dispersion_sd` unless injected as `k_flow_external`.
flow_dispersion_sd::Real = defaults.flow_dispersion_sd,
k_flow_external::Union{Nothing, Real} = nothing,
cfr_modifier_prior = defaults.cfr_modifier_prior,
abscond_prior = defaults.abscond_prior,
incare_confirm_log_prior = defaults.incare_confirm_log_prior,
admission_delay = defaults.admission_delay,
death_los = defaults.death_los,
recovery_los = defaults.recovery_los,
ruleout_los = defaults.ruleout_los,
## Opt-in occupancy reclassification-break days (grid indices). A level
## step is fitted into the modelled total at each, absorbing a
## measurement-basis discontinuity in the isolation series. See
## `cumulative_occupancy_offset`.
occupancy_break_days::AbstractVector{<:Integer} = Int[],
## Prior sd of each occupancy break step (beds), centred on zero.
occupancy_break_sd::Real = 25.0,
## Per-patch BVD reports `(n_patches × n)`, the rows summing to
## `bvd_reports_daily`. `nothing` is one patch.
bvd_reports_matrix::Union{Nothing, AbstractMatrix} = nothing,
## Share of the non-BVD background in each patch, summing to one
## ([`background_split_model`](@ref)).
background_split::AbstractVector{<:Real} = [1.0],
## Relative ascertainment by patch, which re-splits the national BVD
## admissions. `nothing` leaves the split on the reports alone, as
## [`bvd_joint`](@ref) passes when each patch's reports already
## carry its suspected-case detection.
patch_ascertainment::Union{Nothing, AbstractVector{<:Real}} = nothing,
## Province occupancy, bed and 24h admission rows,
## `(; days, patches, counts)` from `province_care_observations`, or
## `nothing`. Scored as splits of the printed sum of the provinces
## present each day.
province_isolation = nothing,
province_capacity = nothing,
province_admissions = nothing,
patch_capacity = patch_capacity_share_model,
## Daily shares of the background admissions by patch, given the
## background suspect shares, the grid length and the province
## admission days. Sampled only when the province admissions are
## scored; otherwise the shares are `background_split`.
background_admission = background_admission_share_model,
province_split_rho_prior = truncated(
Normal(0, 0.1); lower = 0, upper = 1
),
cutoff::Union{Nothing, Integer} = nothing,
simulated = nothing
)
adm_state ~ to_submodel(admission)
p_iso = adm_state.p_iso
sev_state ~ to_submodel(severity)
## BVD suspects are admitted at a higher rate than non-BVD rule-outs,
## skewed up from `p_iso` by the severity log-odds `δ_iso`.
p_iso_bvd = logistic(logit(p_iso) + sev_state.δ_iso)
if k_external === nothing
disp_state ~ to_submodel(dispersion)
k = disp_state.k
else
k = k_external
end
if k_flow_external === nothing
log_inv_sqrt_k_flow ~ Normal(-log(k) / 2, flow_dispersion_sd)
k_flow = exp(-2 * log_inv_sqrt_k_flow)
else
k_flow = k_flow_external
end
n = length(bvd_reports_daily)
nc = something(cutoff, n)
## `β_iso` is identified by the in-care death flow (Tableau 6 décédés)
## relative to admissions and occupancy. The recovered-among-confirmed
## ("cumul guéris") stream is modelled separately off the confirmed cases
## ([`recovered_model`](@ref)), since guéris is the
## confirmed-and-discharged subset, not all in-care recoveries.
β_iso ~ cfr_modifier_prior
CFR_iso = logistic(logit(CFR) + β_iso)
## Time-varying bed capacity `C(t)` (a random walk), started at the first
## day with occupancy or capacity data.
cap_obs_days = vcat(
Int.(isolation_history.days),
Int.(capacity_history.days)
)
cap_start = isempty(cap_obs_days) ? 1 : minimum(cap_obs_days)
np = bvd_reports_matrix === nothing ? 1 : size(bvd_reports_matrix, 1)
length(background_split) == np || error(
"treatment_flow_model: $(length(background_split)) background " *
"shares for $(np) patches."
)
## The per-patch demand and capacity shares are built only when a
## province split scores them; without province rows the stream is the
## national one whatever the patch count.
split_occ = np > 1 && province_isolation !== nothing &&
!isempty(province_isolation.days)
split_cap = np > 1 && province_capacity !== nothing &&
!isempty(province_capacity.days)
split_adm = np > 1 && province_admissions !== nothing &&
!isempty(province_admissions.days)
by_patch = split_occ || split_cap || split_adm
cap_state ~ to_submodel(
cutoff === nothing ? capacity(n; start = cap_start) :
capacity(n; start = cap_start, cutoff)
)
C = cap_state.C
adm_delay_state ~ to_submodel(admission_delay)
death_los_state ~ to_submodel(death_los)
recovery_los_state ~ to_submodel(recovery_los)
ruleout_los_state ~ to_submodel(ruleout_los)
## Abscond (loss-to-follow-up) drains the suspect pool at a small daily
## fraction κ of the previous-day suspect occupancy.
abscond_frac ~ abscond_prior
κ = abscond_frac
## Opt-in reclassification-break offset Δ(t), absorbing the `au-lit-J-1`
## versus `Fin-J` discontinuity in the observed isolation series. Each
## step is sampled non-centred around zero, so the fit partitions it into
## reporting artefact and real demand. Only break days on or before an
## observed occupancy day can move the likelihood, so later ones are
## dropped rather than sampling an inert step.
iso_last = isempty(isolation_history.days) ? 0 :
maximum(Int.(isolation_history.days))
brk_days = [Int(d) for d in occupancy_break_days if Int(d) <= iso_last]
if isempty(brk_days)
b = Float64[]
else
occupancy_step ~ product_distribution(
fill(Normal(0, 1), length(brk_days))
)
b = occupancy_break_sd .* occupancy_step
end
break_grid_days = brk_days
occ_break_offset = cumulative_occupancy_offset(1:n, break_grid_days, b)
## Admission inflow through the suspected→admission delay, split into BVD
## true-case (`p_iso_bvd`) and non-BVD (`p_iso`) inflows. Uncapped latent
## demand. Capacity enters only as a censoring bound below.
A_bvd = convolve_delay(
p_iso_bvd .* p_drc .* bvd_reports_daily,
adm_delay_state.pmf
)
A_bg = convolve_delay(p_iso .* bg_daily, adm_delay_state.pmf)
if eltype(A_bvd) === Any
A_bvd = convert(Vector{eltype(C)}, A_bvd)
A_bg = convert(Vector{eltype(C)}, A_bg)
end
admit_daily = A_bvd .+ A_bg
## Community confirmation hazard `τ_test · p_pos` borrowed from the lab
## pipeline. `nothing` (standalone) gives a zero hazard.
borrowed_hazard = if conf_hazard_daily === nothing
zeros(eltype(A_bvd), n)
elseif eltype(conf_hazard_daily) === Any
convert(Vector{eltype(C)}, conf_hazard_daily)
else
conf_hazard_daily
end
## The split census is identified only when the borrowed hazard is
## non-zero (a lab stream supplies it). With a structural zero the
## confirmed sub-stock is empty, so the split likelihood no-ops and
## those days stay on the total.
split_active = any(
>(zero(eltype(borrowed_hazard))), upto(borrowed_hazard, nc)
)
## In-care confirmation-rate modifier ρ = exp(γ_conf) on the borrowed
## hazard. Sampled only when the hazard is non-zero, so no unidentified
## dimension is added when the split is absent.
if split_active
incare_confirm_log ~ incare_confirm_log_prior
else
incare_confirm_log = zero(eltype(borrowed_hazard))
end
ρ_conf = exp(incare_confirm_log)
conf_hazard = ρ_conf .* borrowed_hazard
## Label-independent clinical discharge events. Deaths and recoveries
## split `A_bvd` by `CFR_iso`, and rule-outs discharge `A_bg`. Each
## schedule is thinned by the abscond survival so absconding competes with
## the clinical exits instead of adding to them. True cases stop being at
## risk once confirmed, so theirs carry the confirmation hazard
## ([`abscond_thinned_flow`](@ref)). Background admissions are never
## confirmed, so a flat cohort-age thinning is exact for the rule-outs
## ([`abscond_thinned`](@ref)).
deaths_daily, recover_daily = abscond_thinned_flows(
CFR_iso .* A_bvd, death_los_state.pmf,
(one(CFR_iso) - CFR_iso) .* A_bvd, recovery_los_state.pmf,
κ, conf_hazard
)
ruleout_daily = convolve_delay(
A_bg,
abscond_thinned(ruleout_los_state.pmf, κ)
)
## Still-in-a-bed survival for the two-clock confirmed sub-stock below.
## `two_clock_confirmed` takes one schedule for every cohort, so it cannot
## carry the admission-day-dependent abscond survival the flows above use.
## The flat cohort-age thinning over-discounts by the confirmed share,
## second order against the confirmation hazard the sub-stock is built
## from.
dpmf = abscond_thinned(death_los_state.pmf, κ)
rpmf = abscond_thinned(recovery_los_state.pmf, κ)
## Forward running-balance occupancy: total demand and the BVD/non-case
## stocks. The scored abscond flow is recomputed below off the two-clock
## suspect stock.
acc = accumulate_occupancy(
A_bvd, A_bg, deaths_daily, recover_daily,
ruleout_daily, κ, conf_hazard
)
demand_raw = acc.demand
O_bvd = acc.O_bvd
## Two-clock confirmed-in-care sub-stock: cohort-tracked
## confirmed-and-present prevalence, exact in the fast-death tail where
## the running balance's proportional drain is only mean-field. Demand
## and `O_bvd` stay as `accumulate_occupancy` built them, while `O_conf`
## (and `O_susp = D − O_conf`) is replaced.
S_clin = clinical_stay_survival(dpmf, rpmf, CFR_iso)
O_conf_raw = two_clock_confirmed(A_bvd, conf_hazard, S_clin)
demand = _typed_as(demand_raw, C)
## Per-patch admissions, bed demand and capacity for the province
## splits and the province forecast. The
## demand is the national demand shared out by each patch's stock of
## admissions through the stays. The capacity is the national walk times
## a daily share centred on each patch's cumulative admissions
## ([`patch_capacity_share_model`](@ref)). The stock falls as patients
## leave; the cumulative admissions never fall. With one patch both are
## the national series as one row.
if by_patch
A_bvd_patch = _patch_bvd_admissions(
bvd_reports_matrix, patch_ascertainment, p_iso_bvd, p_drc,
adm_delay_state.pmf
)
## The background admissions are shared by a daily walk where the
## province admissions are scored, so a move in a province's share
## of them has a province term and need not move the national ratio
## of BVD to background admissions.
if split_adm
bg_adm_state ~ to_submodel(
background_admission(
background_split, n, Int.(province_admissions.days);
patches = Int.(province_admissions.patches)
)
)
bg_adm_share = bg_adm_state.W
bg_adm_level_sd = bg_adm_state.level_sd
bg_adm_walk_sd = bg_adm_state.walk_sd
else
bg_adm_share = background_split
bg_adm_level_sd = zero(eltype(C))
bg_adm_walk_sd = zero(eltype(C))
end
demand_patch = _patch_demand(
A_bvd_patch, A_bg, bg_adm_share, S_clin,
ruleout_los_state.pmf, κ, demand
)
admit_patch = _patch_admissions(A_bvd_patch, A_bg, bg_adm_share)
cap_share_state ~ to_submodel(patch_capacity(admit_patch))
cap_shares = cap_share_state.s
cap_pooling_sd = cap_share_state.pooling_sd
else
demand_patch = reshape(demand, 1, :)
admit_patch = reshape(admit_daily, 1, :)
bg_adm_level_sd = zero(eltype(C))
bg_adm_walk_sd = zero(eltype(C))
cap_shares = ones(eltype(C), 1, n)
cap_pooling_sd = zero(eltype(C))
end
C_patch = cap_shares .* reshape(C, 1, :)
## Reclassification offset Δ(t), added to the modelled census total only.
## Demand (the diagnostic) stays the un-offset latent stock.
occ_offset = _typed_as(occ_break_offset, C)
## `O_conf ≤ O_bvd` holds by construction; the census clamps it to guard
## any prior draw. Absconds drain the two-clock suspect stock, and the
## confirmed and suspect census means sum to the offset total.
census = incare_census(
demand, _typed_as(O_bvd, C), _typed_as(O_conf_raw, C), κ,
occ_offset
)
abscond_daily = census.abscond
occ_obs_total = census.total
conf_split = census.confirmed
susp_split = census.suspect
## Occupancy likelihood: NegativeBinomial around the latent demand,
## right-censored at the implied-capacity bound. Days with a published
## split are scored as the two sub-stocks below instead, so the total and
## its parts are never both scored on one day.
split_days = split_active ? Set(Int.(confirmed_incare_history.days)) :
Set{Int}()
iso_all_days = isolation_history.days
iso_keep = [!(Int(d) in split_days) for d in iso_all_days]
iso_days = iso_all_days[iso_keep]
iso_obs = isempty(isolation_history.counts) ? missing :
collect(Int.(isolation_history.counts))[iso_keep]
iso_means = [occ_obs_total[clamp(Int(d), 1, n)] for d in iso_days]
iso_ceil = censoring_cap(iso_days, iso_obs, capacity_history)
isolation ~ to_submodel(
censored_occupancy_model(
iso_means, iso_ceil, _sim_obs(simulated, :isolation, iso_obs), k
)
)
## Capacity likelihood: the implied bed count is a noisy observation of
## C(t).
cap_days = capacity_history.days
cap_modelled = [C[clamp(Int(d), 1, n)] for d in cap_days]
cap_obs = isempty(capacity_history.counts) ? missing :
collect(Int.(capacity_history.counts))
bed_capacity ~ to_submodel(
vintage_increments_model(
cap_modelled, _sim_obs(simulated, :bed_capacity, cap_obs), k
)
)
## Province splits of the occupancy and of the beds, conditional on the
## printed sum of the provinces present each day. The national tile and
## the national implied capacity above keep their likelihoods, so these
## add only the spatial split. Occupancy is split on the uncapped
## per-patch demand: the printed bed counts do not cover every structure
## patients are held in, so a province can print more patients than
## beds (Nord-Kivu from SitRep 124, 376 in-patients against 228 normed
## beds), and a cap at the walk would read that as a smaller share.
## Saturation is reported through the per-patch utilisation and
## shortfall instead.
occupancy_split_rho = 0.0
if split_occ
occupancy_split_rho ~ province_split_rho_prior
occupancy_split ~ to_submodel(
province_split_model(
merge(
province_isolation,
(;
counts = _sim_obs(
simulated, :occupancy_split,
province_isolation.counts
),
)
),
demand_patch, occupancy_split_rho
)
)
end
capacity_split_rho = 0.0
if split_cap
capacity_split_rho ~ province_split_rho_prior
capacity_split ~ to_submodel(
province_split_model(
merge(
province_capacity,
(;
counts = _sim_obs(
simulated, :capacity_split,
province_capacity.counts
),
)
),
C_patch, capacity_split_rho
)
)
end
## Admissions are a flow, so every day is scored.
admissions_split_rho = 0.0
if split_adm
admissions_split_rho ~ province_split_rho_prior
admissions_split ~ to_submodel(
province_split_model(
merge(
province_admissions,
(;
counts = _sim_obs(
simulated, :admissions_split,
province_admissions.counts
),
)
),
admit_patch, admissions_split_rho
)
)
end
## Split likelihoods, guarded by `split_active` so they no-op when the
## hazard is structurally zero.
ci_days = split_active ? confirmed_incare_history.days : Int[]
ci_obs = (!split_active || isempty(confirmed_incare_history.counts)) ?
missing : collect(Int.(confirmed_incare_history.counts))
confirmed_incare_obs ~ to_submodel(
vintage_increments_model(
[conf_split[clamp(Int(d), 1, n)] for d in ci_days],
_sim_obs(simulated, :confirmed_incare_obs, ci_obs), k
)
)
si_days = split_active ? suspect_incare_history.days : Int[]
si_obs = (!split_active || isempty(suspect_incare_history.counts)) ?
missing : collect(Int.(suspect_incare_history.counts))
suspect_incare_obs ~ to_submodel(
vintage_increments_model(
[
max(susp_split[clamp(Int(d), 1, n)], zero(eltype(susp_split)))
for d in si_days
], _sim_obs(simulated, :suspect_incare_obs, si_obs), k
)
)
## Optional daily Tableau 6 flow likelihoods, each a no-op on empty history.
dth_days = deaths_history.days
dth_obs = isempty(deaths_history.counts) ? missing :
collect(Int.(deaths_history.counts))
incare_deaths ~ to_submodel(
vintage_increments_model(
[deaths_daily[clamp(Int(d), 1, n)] for d in dth_days],
_sim_obs(simulated, :incare_deaths, dth_obs), k_flow
)
)
ro_days = ruleout_history.days
ro_obs = isempty(ruleout_history.counts) ? missing :
collect(Int.(ruleout_history.counts))
ruleouts ~ to_submodel(
vintage_increments_model(
[ruleout_daily[clamp(Int(d), 1, n)] for d in ro_days],
_sim_obs(simulated, :ruleouts, ro_obs), k_flow
)
)
adm_h_days = admissions_history.days
adm_h_obs = isempty(admissions_history.counts) ? missing :
collect(Int.(admissions_history.counts))
admissions ~ to_submodel(
vintage_increments_model(
[admit_daily[clamp(Int(d), 1, n)] for d in adm_h_days],
_sim_obs(simulated, :admissions, adm_h_obs), k_flow
)
)
ab_days = absconded_history.days
ab_obs = isempty(absconded_history.counts) ? missing :
collect(Int.(absconded_history.counts))
absconded ~ to_submodel(
vintage_increments_model(
[abscond_daily[clamp(Int(d), 1, n)] for d in ab_days],
_sim_obs(simulated, :absconded, ab_obs), k_flow
)
)
## Cut-off reported quantities, by patch and summed to national. Each
## patch's beds are its modelled capacity. Its occupancy is its demand
## share of the mean the reported occupancy is scored around (the demand
## plus the reclassification offset, floored at zero), and its
## patients above beds the part of that over its beds. Bed demand is the
## latent stock.
z0 = zero(eltype(C))
dem_T = isempty(demand) ? z0 : demand[nc]
cut = cutoff_occupancy(
isempty(occ_obs_total) ? z0 : occ_obs_total[nc],
demand_patch[:, nc], C_patch[:, nc]
)
beds_T = sum(cut.beds)
occ_T = sum(cut.occupancy)
overall_los = CFR_iso * death_los_state.mean +
(one(CFR_iso) - CFR_iso) * recovery_los_state.mean
## Each cut-off quantity below is both `:=`-tracked onto the chain and
## returned, so it is bound once and used twice. Computing it twice puts
## the work on the gradient path twice, and lets an edit to one copy
## leave the chain and the returned value disagreeing.
isolation_T = safe_rate(occ_T)
bed_demand_T = safe_rate(dem_T)
expected_isolation := isolation_T
expected_bed_demand := bed_demand_T
## Cut-off daily flows: each modelled daily series on the cut-off day,
## for admissions, in-care deaths and rule-outs.
admissions_T = safe_rate(isempty(admit_daily) ? z0 : admit_daily[nc])
incare_deaths_T = safe_rate(
isempty(deaths_daily) ? z0 :
deaths_daily[nc]
)
ruleouts_T = safe_rate(isempty(ruleout_daily) ? z0 : ruleout_daily[nc])
expected_admissions := admissions_T
expected_incare_deaths := incare_deaths_T
expected_ruleouts := ruleouts_T
## The national shortfall is the bed demand above the national beds. The
## patches' occupancy above their own beds (`cut.shortfall`) is reported
## by patch, not summed into this figure: a patch over its beds counts
## there even when another has beds free.
shortfall_T = safe_rate(max(dem_T - beds_T, z0))
bed_shortfall := shortfall_T
bed_utilisation := isolation_T / safe_rate(beds_T)
isolation_severity := sev_state.δ_iso
isolation_bvd_admission := p_iso_bvd
incare_cfr := CFR_iso
incare_cfr_modifier := β_iso
treatment_overall_los := overall_los
conf_incare_T = isempty(conf_split) ? z0 : conf_split[nc]
susp_incare_T = isempty(susp_split) ? z0 : max(susp_split[nc], z0)
conf_incare_rate = safe_rate(conf_incare_T)
susp_incare_rate = safe_rate(susp_incare_T)
expected_confirmed_incare := conf_incare_rate
expected_suspect_incare := susp_incare_rate
incare_confirmed_share := conf_incare_rate / bed_demand_T
## Raw, since ρ can exceed one. ρ < 1 means occupied suspects are
## confirmed slower than the borrowed community hazard, held for repeated
## exclusion testing.
incare_confirm_modifier := ρ_conf
## How much of the observed reclassification the model absorbed as a
## reporting artefact, the rest carried by real demand. Fitted and
## possibly negative, so reported raw rather than through `safe_rate`.
break_T = isempty(occ_break_offset) ? z0 : occ_break_offset[nc]
occupancy_break := break_T
return (;
p_iso, p_iso_bvd, δ_iso = sev_state.δ_iso,
CFR_iso, β_iso, capacity = beds_T,
beds_patch_T = cut.beds, occupancy_patch_T = cut.occupancy,
shortfall_patch_T = cut.shortfall,
death_los_mean = death_los_state.mean,
recovery_los_mean = recovery_los_state.mean,
ruleout_los_mean = ruleout_los_state.mean,
admission_delay_mean = adm_delay_state.mean,
overall_los, abscond_frac, k_isolation = k, k_flow,
demand, isolation, C,
occupancy_mean = occ_obs_total,
demand_patch, admit_patch, capacity_patch = C_patch,
capacity_series = C,
capacity_shares = cap_shares, capacity_pooling_sd = cap_pooling_sd,
occupancy_split_rho, capacity_split_rho, admissions_split_rho,
background_admission_level_sd = bg_adm_level_sd,
background_admission_walk_sd = bg_adm_walk_sd,
deaths_daily, recover_daily, ruleout_daily, admit_daily,
abscond_daily,
break_steps = b, break_offset = occ_break_offset,
break_grid_days,
occupancy_break = break_T,
confirmed_incare = conf_split, suspect_incare = susp_split,
incare_confirm_modifier = ρ_conf,
expected_confirmed_incare = conf_incare_rate,
expected_suspect_incare = susp_incare_rate,
expected_isolation = isolation_T,
expected_bed_demand = bed_demand_T,
bed_shortfall = shortfall_T,
expected_admissions = admissions_T,
expected_incare_deaths = incare_deaths_T,
expected_ruleouts = ruleouts_T,
)
endSubmodel: patch_capacity_share_model
@model function patch_capacity_share_model(
admissions::AbstractMatrix{<:Real};
admission_floor::Real = 1.0,
pooling_sd_prior = truncated(Normal(0, 1); lower = 0),
basis = sum_to_zero_basis(max(size(admissions, 1), 1))
)
np, n = size(admissions)
if np <= 1
return (; s = ones(Float64, max(np, 1), n), pooling_sd = 0.0)
end
admission_floor > 0 || error(
"patch_capacity_share_model: admission_floor must be positive, " *
"got $(admission_floor)."
)
τ_cap ~ pooling_sd_prior
## Each basis coordinate is drawn centred, on the scale `τ_cap`. `eps`
## floors the SD so a `τ_cap ≈ 0` draw stays a proper distribution.
y_cap ~ product_distribution(
fill(Normal(0, τ_cap + eps(typeof(float(τ_cap)))), np - 1)
)
dev = basis * y_cap
s = _admission_centred_shares(admissions, dev, admission_floor)
return (; s, pooling_sd = τ_cap)
endSuspected deaths
Suspected deaths are the ascertained, CFR-weighted convolution of the daily onsets with the onset-to-death PMF
The per-vintage increments are scored with a NegBinomial with the suspected-death dispersion
Submodel: deaths_model
@model function deaths_model(
deaths_history,
total_deaths::Union{Missing, Integer},
onsets::AbstractVector, k::Real;
suspected_daily_deaths_history = (; days = Int[], counts = Int[]),
cfr = cfr_model(),
ascertainment = death_ascertainment_model(),
case_bg_daily = nothing,
background_cfr = background_cfr_model(),
## nmax covers 98% of the convolved onset->death sum (the two atomic
## Gammas moment-matched to a single Gamma only for the truncation).
onset_to_death = onset_to_death_model(
cdf_nmax(Gamma(3.33, 3.83));
oa_alpha_prior = LogNormal(log(1.178), 0.25),
oa_theta_prior = ONSET_ADMISSION_THETA_PRIOR,
ad_alpha_prior = truncated(Normal(2.151, 0.604); lower = 0.01),
ad_theta_prior = truncated(Normal(3.906, 1.381); lower = 0.1)
),
cutoff::Union{Nothing, Integer} = nothing,
simulated = nothing
)
cfr_state ~ to_submodel(cfr)
od_state ~ to_submodel(onset_to_death)
asc_state ~ to_submodel(ascertainment)
CFR = cfr_state.CFR
p_death = asc_state.p_death
bvd_deaths_daily = convolve_delay(onsets, (p_death * CFR) .* od_state.pmf)
n = length(bvd_deaths_daily)
nc = something(cutoff, n)
vobs = vintage_obs(deaths_history, total_deaths, nc)
## `λ_bg_death` is the mean daily background death rate.
if case_bg_daily !== nothing
bgcfr_state ~ to_submodel(background_cfr)
cfr_bg = bgcfr_state.cfr_bg
bg_death_daily = convolve_delay(case_bg_daily, cfr_bg .* od_state.pmf)
λ_bg_death = sum(upto(bg_death_daily, nc)) / nc
bg_death_sigma = zero(CFR)
else
cfr_bg = zero(CFR)
λ_bg_death = zero(CFR)
bg_death_sigma = zero(CFR)
bg_death_daily = fill(zero(CFR), n)
end
deaths_daily = bvd_deaths_daily .+ bg_death_daily
modelled_increments = bin_increments(deaths_daily, vobs.days)
death_increments ~ to_submodel(
vintage_increments_model(
modelled_increments,
_sim_obs(simulated, :death_increments, vobs.obs_increments), k
)
)
## The mean for day `d` is the single-day `deaths_daily[d]`, not a
## between-vintage increment: this is a genuine daily count, so it never
## differences a falling cumulative.
sdd_days = suspected_daily_deaths_history.days
sdd_modelled = [deaths_daily[clamp(Int(d), 1, n)] for d in sdd_days]
sdd_obs = isempty(suspected_daily_deaths_history.counts) ? missing :
collect(Int.(suspected_daily_deaths_history.counts))
suspected_daily_deaths ~ to_submodel(
vintage_increments_model(
sdd_modelled,
_sim_obs(simulated, :suspected_daily_deaths, sdd_obs), k
)
)
raw_total = sum(upto(deaths_daily, nc))
expected_deaths_T := safe_rate(raw_total)
bg_death_total = sum(upto(bg_death_daily, nc))
return (;
CFR, p_death, cfr_bg, od_pmf = od_state.pmf, deaths_daily,
bvd_deaths_daily, expected_deaths_T, λ_bg_death, bg_death_sigma,
bg_death_daily, bg_death_total,
)
endLaboratory pipeline
The laboratory pipeline fits one analysed-specimen volume, the suspected daily pipeline (
also counts the specimens from repeat exclusion testing, swabbed community deaths and screened contacts, so it can exceed one. Its prior is
The analysed volume is zero before the testing onset. The first confirmed vintage is treated as the baseline and the early confirmed increments are scored from it. The testing-onset gate applies to the analysed volume alone.
The per-vintage increments are scored against the cumulative analysed series with a NegBinomial with the confirmed-stream dispersion
Where INSP publishes a 24h analysed count after the cumulative series stops, that count is scored as a NegBinomial of the modelled volume
The confirmed positives in each laboratory window
The tested BVD share
Here
where the beta-binomial has mean
On a listed harmonisation day, when the confirmed increment is mostly a backfill of provincial records, the day is scored against the modelled volume. Its mean adds a step centred on the increment less the printed 24h count, with SD 25.
Submodel: lab_delay_model (receipt delay)
@model function lab_delay_model(
nmax::Integer = cdf_nmax(lognormal_meansd(4.5, 4.0));
mean_prior = truncated(Normal(4.5, 1.0); lower = 1),
sd_prior = truncated(Normal(4.0, 0.75); lower = 1)
)
d ~ to_submodel(censored_delay_model(nmax; mean_prior, sd_prior))
return (; pmf = d.pmf, dist = d.dist, mean = d.mean, sd = d.sd)
endSubmodel: confirmed_cases_model
@model function confirmed_cases_model(
confirmed_history,
confirmed_cases::Union{Missing, Integer},
onsets::AbstractVector, k::Real, p_drc::Real,
bg_daily::AbstractVector, τ_test::Real,
bvd_reports_daily::AbstractVector;
lab_history = (; days = Int[], counts = Int[]),
lab_daily_history = (; days = Int[], counts = Int[]),
tests_analysed::Union{Missing, Integer} = missing,
receipt = lab_delay_model(),
## Specimens analysed per suspect sampled
## ([`specimen_intensity_model`](@ref)). `nothing` leaves `τ_test`
## alone capping the volume below the suspect inflow.
specimen_intensity = nothing,
severity_enrichment = severity_enrichment_model(),
sensitivity = test_sensitivity_model(),
specificity = test_specificity_model(),
overdispersion = confirmed_overdispersion_model(),
## Opt-in retrospective harmonisation-break days (grid day-indices):
## days whose cumulative confirmed step is mostly a provincial base
## integration rather than 24h notifications. De-anchored from the
## positivity denominator and given a fitted level step in the
## modelled mean. Empty (the default) is a no-op.
confirmed_break_days::AbstractVector{<:Integer} = Int[],
## Printed 24h new-confirmed counts on each break day. The step is
## centred on `observed increment − gross`, so its magnitude comes
## from published data rather than a prior guess. Empty or all-zero
## centres on the whole increment (see `break_step_centres`).
confirmed_break_gross::AbstractVector{<:Integer} = Int[],
## Residual uncertainty about how much of that discrepancy is truly
## retrospective rather than coincident same-day incidence, not the
## harmonisation magnitude, which `confirmed_break_gross` supplies.
## Zero pins the step at the published discrepancy and samples no
## parameter.
confirmed_break_sd::Real = 25.0,
cutoff::Union{Nothing, Integer} = nothing,
simulated = nothing
)
n = length(onsets)
nc = something(cutoff, n)
## `missing` cut-off scalar means generator mode: observed increments are
## left missing so `predict` resamples them.
have_data = !ismissing(confirmed_cases)
## Intra-window overdispersion for the confirmed positives, sampled once
## and shared across all confirmed windows.
od_state ~ to_submodel(overdispersion, false)
ρ_conf = od_state.ρ
## Laboratory capacity onset: the modelled analysed volume is gated to
## zero before the first confirmed-case vintage, the earliest evidence of
## testing, falling back to the first laboratory date. An ungated volume
## would roll pre-testing capacity into the first laboratory and
## early-confirmed bins. The suspected-case pipeline feeding the volume is
## not gated, since suspected cases did accumulate over the cryptic phase.
cap_start = !isempty(confirmed_history.days) ?
clamp(Int(confirmed_history.days[1]), 1, n) :
(
!isempty(lab_history.days) ?
clamp(Int(lab_history.days[1]), 1, n) : 1
)
## Analysed-specimen volume: the suspected pipeline carried through the
## report-to-analysed delay and thinned by the tested fraction. `bg_daily`
## is the per-day non-BVD background.
receipt_state ~ to_submodel(receipt)
bvd_suspected_daily = p_drc .* bvd_reports_daily
carried = convolve_delay(
bvd_suspected_daily .+ bg_daily, receipt_state.pmf
)
κ_test = if specimen_intensity === nothing
nothing
else
intensity_state ~ to_submodel(specimen_intensity)
intensity_state.κ
end
## Branch the whole product, not just `κ`: on the `nothing` path a
## length-`n` vector of ones would be a real broadcast multiply on every
## gradient call.
analysed_daily_raw = κ_test === nothing ? τ_test .* carried :
(κ_test * τ_test) .* carried
## In predict mode the daily series can infer as `Vector{Any}`, which
## trips `reduce_empty` / `zero(Any)` on the empty derived window vectors
## below, so it is concretised to the working scalar type.
##
## Assigned once: the comprehensions below capture `analysed_daily`, and
## Julia boxes any captured local the body later reassigns, costing
## Mooncake a dictionary lookup per use on every gradient.
analysed_daily = gate_before(
eltype(analysed_daily_raw) === Any ?
convert(Vector{typeof(τ_test)}, analysed_daily_raw) :
analysed_daily_raw,
cap_start
)
rvobs = vintage_obs(lab_history, tests_analysed, nc)
analysed_inc = bin_increments(analysed_daily, rvobs.days)
## Generator mode leaves the volume increments missing so `predict`
## resamples them, like the early/late windows below.
vol_obs = have_data ? rvobs.obs_increments : missing
analysed_increments ~ to_submodel(
vintage_increments_model(
analysed_inc,
_sim_obs(simulated, :analysed_increments, vol_obs), k
)
)
## Post-cutoff 24h analysed volume. Once the national cumulative analysed
## series stops, INSP publishes a 24h analysed count on some days. Scoring
## the modelled volume against it fits the post-cutoff throughput rather
## than only using it as a confirmed denominator.
daily_days = [clamp(Int(d), 1, n) for d in lab_daily_history.days]
daily_modelled = isempty(daily_days) ? similar(analysed_daily, 0) :
[analysed_daily[d] for d in daily_days]
daily_obs = have_data ? lab_daily_history.counts : missing
analysed_daily_increments ~ to_submodel(
vintage_increments_model(
daily_modelled,
_sim_obs(simulated, :analysed_daily_increments, daily_obs), k
)
)
## Confirmed positives in three groups sharing one partially-pooled
## positivity (see `confirmed_positivity_windows`).
windows = confirmed_positivity_windows(
confirmed_history, lab_history,
lab_daily_history, confirmed_break_days
)
n_early = length(windows.early_days)
n_obs = length(windows.obs_analysed)
n_late = length(windows.late_days)
nv = n_early + n_obs + n_late
## Per-window tested BVD share `p_pos`, from the suspect-pool
## composition (see the docstring).
window_days = vcat(
windows.early_days, windows.obs_days,
windows.late_days
)
enrich_state ~ to_submodel(severity_enrichment, false)
δ0 = enrich_state.δ0
decay_scale = enrich_state.decay_scale
sens_state ~ to_submodel(sensitivity, false)
spec_state ~ to_submodel(specificity, false)
s_test = sens_state.s_test
spec = spec_state.spec
## Suspect-pool composition over each window, carried through the
## report-to-analysed delay so it reflects the specimens actually
## analysed in the window. The `τ_test` factor cancels in the ratio φ,
## so it is omitted here. The pool total is the carried suspected
## series, BVD plus background.
analysed_bvd_daily = convolve_delay(
bvd_suspected_daily, receipt_state.pmf
)
analysed_pool_daily = carried
if eltype(analysed_bvd_daily) === Any
analysed_bvd_daily = convert(
Vector{typeof(τ_test)},
analysed_bvd_daily
)
analysed_pool_daily = convert(
Vector{typeof(τ_test)},
analysed_pool_daily
)
end
## Gate the tested composition to the testing window too, so the
## composition clock and the per-window BVD share start at the testing
## onset rather than rolling the cryptic phase.
analysed_bvd_daily = gate_before(analysed_bvd_daily, cap_start)
analysed_pool_daily = gate_before(analysed_pool_daily, cap_start)
bvd_window = bin_increments(analysed_bvd_daily, window_days)
pool_window = bin_increments(analysed_pool_daily, window_days)
Tt = eltype(bvd_window)
## Testing clock: cumulative modelled analysed volume at each window.
vol_window = bin_increments(analysed_daily, window_days)
c_window = cumsum(vol_window)
lo = convert(Tt, 1.0e-8)
hi = one(Tt) - lo
## Floor the decay scale so a near-zero `decay_scale` draw cannot make
## the clock ratio `0/0` and break the downstream Binomial.
dscale = max(convert(Tt, decay_scale), one(Tt))
p_pos = composition_positivity(
window_days, bvd_window, pool_window,
c_window, δ0, dscale, s_test, spec, lo, hi
)
## Early windows: confirmed increment ~ NegBinomial(positivity ×
## modelled analysed volume), the volume binned over each window's own
## day range pinned at `early_start` (the first confirmed vintage, the
## testing-onset baseline), so the first early increment is scored from
## the data start rather than rolling the (now-gated) pre-testing volume.
## Mirrors the late-window pinning at `late_start`.
early_p = p_pos[1:n_early]
## Bound unconditionally to one array allocation site rather than a
## two-branch ternary, whose pointer-PHI Enzyme's `nodecayed_phis!` LLVM
## pass cannot trace. With no early window days the edge is the singleton
## `[start]`, so `bin_increments(...)[2:end]` is empty, the same value a
## `similar(analysed_daily, 0)` branch would give.
early_edges = n_early > 0 ?
vcat(windows.early_start, windows.early_days) :
[windows.early_start]
early_volume = bin_increments(analysed_daily, early_edges)[2:end]
early_mean = early_p .* early_volume
early_obs = (have_data && n_early > 0) ?
windows.early_increments : missing
early_increments ~ to_submodel(
vintage_increments_model(
early_mean, _sim_obs(simulated, :early_increments, early_obs), k
)
)
## Observed windows: overdispersed BetaBinomial of the observed analysed
## denominator (`ρ_conf` the intra-window overdispersion).
obs_p = p_pos[(n_early + 1):(n_early + n_obs)]
obs_positives = (have_data && n_obs > 0) ? collect(windows.obs_positives) :
missing
confirmed_positives ~ to_submodel(
confirmed_positives_model(
_sim_obs(simulated, :confirmed_positives, obs_positives),
windows.obs_analysed, obs_p,
ρ_conf
)
)
## Late windows: confirmed-only vintages after the last laboratory date,
## scored by `late_confirmed_model`. The modelled volume is binned over
## each window's own day range: `bin_increments` runs its `prev` edge from
## day 0, so prepending `late_start` and dropping the synthetic first bin
## starts the accumulation at the last laboratory day, avoiding
## double-counting the observed-window volume.
late_p = p_pos[(n_early + n_obs + 1):nv]
## Unconditional single-allocation binding, as for `early_volume` above.
late_edges = n_late > 0 ? vcat(windows.late_start, windows.late_days) :
[windows.late_start]
late_volume = bin_increments(analysed_daily, late_edges)[2:end]
## Opt-in retrospective harmonisation step. A single level step is fitted
## into the break window's modelled mean, so the fit partitions the
## increment into reporting artefact and real incidence. Sampled
## non-centred around the published discrepancy (`break_step_centres`),
## with `confirmed_break_sd` the residual uncertainty. Only break days
## landing on a late window can move the likelihood, so others are dropped
## rather than sampling an inert step. Empty gives Δ = 0.
late_day_ints = Int.(windows.late_days)
conf_brk_days, conf_brk_centre = break_step_centres(
late_day_ints,
windows.late_increments, confirmed_break_days, confirmed_break_gross
)
if isempty(conf_brk_days)
cb = Float64[]
elseif iszero(confirmed_break_sd)
## Deterministic correction: the printed 24h count is taken as exact,
## so no step parameter is sampled and no ridge forms between a step
## and the ascertainment it trades off against.
cb = conf_brk_centre
else
confirmed_step ~ product_distribution(
fill(Normal(0, 1), length(conf_brk_days))
)
cb = conf_brk_centre .+ confirmed_break_sd .* confirmed_step
end
late_break_offset = confirmed_break_offset(
windows.late_days,
conf_brk_days, cb
)
late_mean = late_p .* late_volume .+ late_break_offset
## Observed late increments: anchored days (24h denominator) carry the
## confirmed increment clamped into the Binomial support, unanchored days
## the increment itself.
if have_data && n_late > 0
late_obs = Vector{Int}(undef, n_late)
for i in 1:n_late
a = windows.late_analysed[i]
late_obs[i] = a > 0 ?
clamp(windows.late_increments[i], 0, a) :
windows.late_increments[i]
end
else
late_obs = missing
end
late_increments ~ to_submodel(
late_confirmed_model(
_sim_obs(simulated, :late_increments, late_obs), late_mean,
windows.late_analysed,
late_p, k, ρ_conf
)
)
## Plain `=`, not `:=`: these are surfaced through the returned NamedTuple
## and re-tracked at the joint level (`joint.jl`), so `:=` here would be
## redundant. It would also build a DynamicPPL tracking closure capturing
## the branch-assigned (so boxed) `p_pos`, whose pointer-PHI Enzyme's
## `nodecayed_phis!` pass cannot differentiate through.
expected_analysed = safe_rate(sum(upto(analysed_daily, nc)))
## Expected confirmed at the cut-off and the overall positivity, over the
## modelled early volume, the observed cumulative analysed windows and the
## late windows (anchored days contribute `p · analysed`, unanchored days
## the modelled `p · volume`). The window vectors are empty when a vintage
## has no such window, and can widen to `Any` in predict mode, so each sum
## takes a concrete `init` from the scalar `τ_test` to skip
## `reduce_empty`'s `zero(Any)`.
z = zero(τ_test)
amask = windows.late_analysed .> 0
late_den_a = float.(windows.late_analysed)
## Unconditional broadcasts, as for `early_volume` above: with
## `n_late = 0` every operand is empty, so the `ifelse.` result is empty
## too, without a two-allocation pointer-PHI.
late_den = ifelse.(amask, late_den_a, late_volume)
late_expected = ifelse.(amask, late_p .* late_den_a, late_mean)
denom = sum(early_volume; init = z) + float(sum(windows.obs_analysed)) +
sum(late_den; init = z)
expected_positives = sum(early_mean; init = z) +
sum(late_expected; init = z) +
(n_obs > 0 ? sum(obs_p .* windows.obs_analysed) : z)
expected_confirmed = safe_rate(expected_positives)
p_positive = safe_rate(expected_positives) / safe_rate(denom)
## Modelled daily confirmed-case incidence. In predict mode `p_pos` can
## widen to `Vector{Any}`, so pin it to the analysed volume's element type
## before expanding onto the daily grid.
p_pos_daily = p_pos
if eltype(p_pos_daily) === Any
p_pos_daily = convert(Vector{eltype(analysed_daily)}, p_pos_daily)
end
## Per-day positivity `p_pos_grid`, exposed with `τ_test` so the treatment
## model can form the in-care confirmation hazard `τ_test · p_pos_grid[t]`.
p_pos_grid = expand_vintage_rate(p_pos_daily, window_days, n)
confirmed_daily = p_pos_grid .* analysed_daily
return (;
τ_test, κ_test,
bg_daily, p_pos, p_pos_grid, windows, analysed_daily,
confirmed_daily,
s_test, spec,
receipt_pmf = receipt_state.pmf,
receipt_mean = receipt_state.mean, receipt_sd = receipt_state.sd,
expected_analysed, expected_confirmed, p_positive,
)
endConfirmed deaths
The confirmed-death increments are NegBinomial counts of a modelled death analysed volume, the death analogue of the confirmed-case laboratory pipeline.
The death analysed volume is the modelled case analysed volume
with
with
The daily confirmed deaths are the positivity times the death analysed volume,
and the per-vintage increments are scored with a NegBinomial with the confirmed-death dispersion
The death analysed volume inherits the laboratory capacity onset from the case volume
Submodel: confirmed_deaths_model
@model function confirmed_deaths_model(
confirmed_deaths::Union{Missing, Integer},
total_deaths::Union{Missing, Integer},
deaths_daily::AbstractVector,
bvd_deaths_daily::AbstractVector,
bg_death_daily::AbstractVector, k::Real;
confirmed_deaths_history = (; days = Int[], counts = Int[]),
## Opt-in retrospective harmonisation-break days, as in
## `confirmed_cases_model`. The 22 July 2026 base integration steps
## the confirmed-death cumulative by +236 against a printed 24h count
## of +62, and this stream fits between-vintage increments too, so the
## backlog would otherwise be read as one day of confirmed deaths.
confirmed_break_days::AbstractVector{<:Integer} = Int[],
confirmed_break_gross::AbstractVector{<:Integer} = Int[],
## Residual uncertainty around the published discrepancy, with zero
## pinning the step and sampling no parameter.
confirmed_break_sd::Real = 25.0,
receipt_pmf::AbstractVector = [1.0],
case_analysed_daily = nothing,
case_suspected_daily = nothing,
scaling = death_testing_scaling_model(),
testing = death_testing_fraction_model(),
sensitivity = test_sensitivity_model(),
specificity = test_specificity_model(),
cutoff::Union{Nothing, Integer} = nothing,
simulated = nothing
)
sens_state ~ to_submodel(sensitivity)
spec_state ~ to_submodel(specificity)
s_test = sens_state.s_test
spec = spec_state.spec
n = something(cutoff, length(deaths_daily))
## Suspected deaths carried to laboratory receipt by the same
## report-to-receipt delay the confirmed cases use, with the BVD component.
susp_death_raw = convolve_delay(deaths_daily, receipt_pmf)
bvd_death_raw = convolve_delay(bvd_deaths_daily, receipt_pmf)
## In predict or check-model mode the series can widen to `Vector{Any}`,
## which trips `zero(Any)` downstream, so both are pinned to the sampled
## scalar type. Assigned once each, since the closures below capture them
## and a reassignment would box them.
_widened = eltype(susp_death_raw) === Any
susp_death = _widened ?
convert(Vector{typeof(s_test)}, susp_death_raw) :
susp_death_raw
bvd_death = _widened ?
convert(Vector{typeof(s_test)}, bvd_death_raw) :
bvd_death_raw
## Death-pool BVD composition per day, q = bvd / (bvd + bg), and the assay
## tested-positive probability p = s_test·q + (1 − spec)(1 − q).
lo = eps(typeof(s_test))
hi = one(s_test) - lo
q_death_daily = map(eachindex(susp_death)) do t
den = susp_death[t]
ratio = den > lo ? bvd_death[t] / den : one(s_test)
clamp(isfinite(ratio) ? ratio : one(s_test), lo, hi)
end
p_pos_daily = s_test .* q_death_daily .+
(one(s_test) - spec) .*
(one(s_test) .- q_death_daily)
if case_analysed_daily !== nothing
scale_state ~ to_submodel(scaling)
## The `map` below captures `sc_c`, not `sc`: `sc` takes a value on
## both branches, so capturing it would box it.
sc_c = scale_state.scaling
susp_case = convolve_delay(case_suspected_daily, receipt_pmf)
death_volume = map(eachindex(susp_death)) do t
den = susp_case[t]
## Uncapped, as on the case side. A suspect yields more than one
## specimen through repeat exclusion testing, and swabbed
## community deaths enter the laboratory denominator without
## being counted as suspects, so the volume is specimens and not
## persons. The realised `τ_death` below is that ratio and may
## exceed one.
den > lo ? sc_c * case_analysed_daily[t] * susp_death[t] / den :
zero(sc_c)
end
τ_death = susp_death[n] > lo ?
death_volume[n] / susp_death[n] : zero(sc_c)
sc = sc_c
else
test_state ~ to_submodel(testing)
τ_death = test_state.τ_death
sc = one(τ_death)
## Gated before the first confirmed-death vintage, as the case volume
## is gated before the first confirmed-case vintage.
cap_start = isempty(confirmed_deaths_history.days) ? 1 :
clamp(Int(confirmed_deaths_history.days[1]), 1, n)
death_volume = τ_death .* gate_before(susp_death, cap_start)
end
confirmed_death_daily = p_pos_daily .* death_volume
vobs = vintage_obs(confirmed_deaths_history, confirmed_deaths, n)
modelled_inc = bin_increments(confirmed_death_daily, vobs.days)
## Retrospective harmonisation step, mirroring `confirmed_cases_model`.
## Sampled whenever a break day lands on a vintage, so a posterior
## predictive carries the same dimensions as the fitted chain and
## replicates the break rather than leaving the vintage an outlier.
cd_brk_days, cd_brk_centre = break_step_centres(
vobs.days,
vobs.obs_increments, confirmed_break_days, confirmed_break_gross
)
if isempty(cd_brk_days)
cdb = Float64[]
elseif iszero(confirmed_break_sd)
## Deterministic correction, as on the cases path.
cdb = cd_brk_centre
else
cdeath_step ~ product_distribution(
fill(Normal(0, 1), length(cd_brk_days))
)
cdb = cd_brk_centre .+ confirmed_break_sd .* cdeath_step
end
modelled_inc = modelled_inc .+
confirmed_break_offset(vobs.days, cd_brk_days, cdb)
## The cut-off scalar is the generator gate, as in `confirmed_cases_model`.
## Nulling it leaves `predict` to resample the increments while the dated
## history still supplies the vintage grid and the break-step centres, so
## the published discrepancy stays available to a predictive.
cdeath_obs = ismissing(confirmed_deaths) ? missing : vobs.obs_increments
cdeath_increments ~ to_submodel(
vintage_increments_model(
modelled_inc,
_sim_obs(simulated, :cdeath_increments, cdeath_obs), k
)
)
expected_confirmed_deaths := safe_rate(
sum(upto(confirmed_death_daily, n))
)
## Cut-off death-pool composition and confirmation positivity, surfaced as
## `death_composition` and `death_confirmation`.
q_death := q_death_daily[n]
p_death_conf := p_pos_daily[n]
return (;
τ_death, scaling = sc, s_test, spec, q_death, p_death_conf,
confirmed_death_daily, expected_confirmed_deaths,
)
endRecovered among confirmed
Recoveries ("cumul guéris") are the survivors among laboratory-confirmed cases, the incidence analogue of the convolution-and-scaling secondary-observation model of EpiNow2 (Abbott et al., 2020). The modelled daily confirmed incidence
is a discretised LogNormal with mean
We assume a case is confirmed before it is recorded as recovered. The per-vintage increments are scored with a NegBinomial with the recovered-stream dispersion
The convolution right-censors recoveries that have not resolved by the cut-off.
Submodel: recovered_model
@model function recovered_model(
recovered_history,
recovered_total::Union{Missing, Integer},
confirmed_daily::AbstractVector, CFR::Real;
recovery = recovery_probability_model,
dispersion = surveillance_dispersion_model(),
## Confirmation-to-recovery (discharge) delay. An Ebola survivor is
## discharged a couple of weeks after confirmation, so the default is
## a mean ~14 d stay before recovery is recorded.
confirmation_to_recovery = censored_delay_model(
cdf_nmax(lognormal_meansd(14.0, 8.0); q = 0.99);
mean_prior = truncated(Normal(14.0, 5.0); lower = 1),
sd_prior = truncated(Normal(8.0, 4.0); lower = 1)
),
## Dispersion can be injected from the joint composer's pooled set
## (`k_external`). Standalone it samples its own from `dispersion`.
k_external::Union{Nothing, Real} = nothing,
cutoff::Union{Nothing, Integer} = nothing,
simulated = nothing
)
rec_state ~ to_submodel(recovery(CFR))
p_recover = rec_state.p_recover
if k_external === nothing
disp_state ~ to_submodel(dispersion)
k = disp_state.k
else
k = k_external
end
delay_state ~ to_submodel(confirmation_to_recovery)
## Survivors among confirmed cases, lagged by the confirmation-to-recovery
## delay.
recovered_daily = convolve_delay(
confirmed_daily,
p_recover .* delay_state.pmf
)
n = something(cutoff, length(confirmed_daily))
vobs = vintage_obs(recovered_history, recovered_total, n)
modelled_inc = bin_increments(recovered_daily, vobs.days)
recovered_increments ~ to_submodel(
vintage_increments_model(
modelled_inc,
_sim_obs(simulated, :recovered_increments, vobs.obs_increments),
k
)
)
expected_recovered := safe_rate(sum(upto(recovered_daily, n)))
return (;
p_recover, recovery_delay_mean = delay_state.mean,
k_recovered = k, recovered_daily, expected_recovered,
)
endExported cases
From infection until detection, an infected person travels to Uganda at the daily per-capita travel rate
The traveller volume and source population are Ituri's, where the point-of-entry counts were collected. Each other province contributes to the export stream in proportion to a sampled weight relative to Ituri:
Write the cumulative export-weighted infections as
The cumulative infections that have completed the detection delay are
Then the daily export intensity is
Its running sum is the cumulative export intensity:
Every undetected infection stays at risk of export on each day until detection, so a traveller who returns to the DRC before detection still counts. Each Uganda import is scored at its reported detection date as a Poisson of the rise in cumulative export intensity since the previous detection. The cumulative intensity up to the day before the earliest detection
Submodel: exports_model
@model function exports_model(
exported_cases::Union{Missing, Integer},
infections::AbstractVector, p_uganda::Real;
export_case_days::AbstractVector{<:Integer} = Int[],
pre_detection_exports::Union{Missing, Integer} = 0,
incubation_pmf::AbstractVector,
source_population::Real = ITURI_POPULATION,
traveller = traveller_volume_model(),
## Export detection abroad uses the same line-list onset→admission
## delay (d_oa) as the suspect-case report: a case is detected at a
## point of entry when first formally seen, ~4 days after onset.
onset_to_detection = gamma_delay_model(
cdf_nmax(Gamma(1.178, 3.694));
alpha_prior = LogNormal(log(1.178), 0.25),
theta_prior = ONSET_ADMISSION_THETA_PRIOR
),
cutoff::Union{Nothing, Integer} = nothing,
simulated = nothing
)
travel_state ~ to_submodel(traveller)
daily_travellers = travel_state.daily_travellers
q = daily_travellers / source_population
detect_state ~ to_submodel(onset_to_detection)
## Convolved with the incubation PMF so the survival clock runs from
## infection.
f_det = convolve_pmf(incubation_pmf, detect_state.pmf)
## At-risk prevalence (person-days): infected but not yet detected. The
## survival kernel stops at the end of `f_det`, which has unit mass.
prevalence = convolve_delay(infections, 1 .- cumsum(f_det))
export_prevalence = p_uganda .* q .* prevalence
n = something(cutoff, length(export_prevalence))
if isempty(export_case_days)
## No dated series: cumulative single-total Poisson at the cut-off.
raw_exports = sum(upto(export_prevalence, n))
expected_exports_T := safe_rate(raw_exports)
exported_cases ~ SafePoisson(expected_exports_T)
else
## Dated per-day Poisson. The export clock stops at the last import
## `t_last` (the `last_offset` truncation). Prevalence past it does
## not accrue. `d₁` is the earliest detection day.
days, counts = dated_event_bins(export_case_days, n)
d₁ = days[1]
## Pre-detection survival weight Λ(d₁−1): the cumulative export
## intensity up to the day before the earliest detection.
pre = d₁ > 1 ? sum(@view export_prevalence[1:(d₁ - 1)]) :
zero(@inbounds export_prevalence[begin])
pre_detection_exports ~ SafePoisson(safe_rate(pre))
## The first increment is measured from `pre`, so the pre-detection
## term and the increments partition Λ(t_last).
raw_inc = bin_increments(export_prevalence, days)
μ_day = [
i == 1 ? raw_inc[1] - pre : raw_inc[i]
for i in eachindex(raw_inc)
]
obs = ismissing(exported_cases) ? missing : counts
export_obs ~ to_submodel(
dated_poisson_model(μ_day, _sim_obs(simulated, :export_obs, obs))
)
expected_exports_T := safe_rate(pre + sum(μ_day))
end
## Travel-scaled at-risk prevalence without the export-case ascertainment
## `p_uganda`: a death among an exported case would be reported whether or
## not the case itself was ascertained as an import, so the export-death
## model accrues over the travelled person-time `q · prevalence`, not the
## ascertained `export_prevalence = p_uganda · q · prevalence`.
travelled_prevalence = q .* prevalence
return (;
p_uganda, daily_travellers, q, prevalence,
export_prevalence, travelled_prevalence,
expected_exports = expected_exports_T,
)
endSubmodel: province_export_pressure_model
@model function province_export_pressure_model(
n_patches::Integer;
location_prior = Normal(log(0.15), 1.0),
pooling_sd_prior = truncated(Normal(0, 0.5); lower = 0),
offset_prior = Normal(0, 1)
)
## One province has nothing to pool with and no secondary weight to
## sample, so only the reference weight is returned.
if n_patches <= 1
return (;
weights = ones(Float64, max(n_patches, 1)),
pooling_sd = 0.0, location = 0.0,
)
end
μ_w ~ location_prior
τ_w ~ pooling_sd_prior
z_w ~ product_distribution(fill(offset_prior, n_patches - 1))
Tw = promote_type(typeof(float(μ_w)), typeof(float(τ_w)), eltype(z_w))
weights = ones(Tw, n_patches)
@inbounds for p in 2:n_patches
weights[p] = exp(μ_w + τ_w * z_w[p - 1])
end
return (; weights, pooling_sd = τ_w, location = μ_w)
endDeaths among exports
The expected deaths among exports weight the travelled at-risk prevalence by the infection-to-death delay (the onset-to-death PMF convolved with the incubation period) and scale by the CFR. We assume a death among exported cases is reported whether or not the case was ascertained as an import, so the travelled prevalence omits
The daily export-death intensity is
Its running sum is the cumulative export-death intensity:
Each dated Uganda export death is scored at its reported date with a per-day Poisson, the same dated-event likelihood the exports use, with a zero term before the first death day
Submodel: exports_deaths_model
@model function exports_deaths_model(
exports_deaths::Union{Missing, Integer},
travelled_prevalence::AbstractVector, CFR::Real,
od_pmf::AbstractVector, incubation_pmf::AbstractVector;
export_death_days::AbstractVector{<:Integer} = Int[],
pre_death_exports::Union{Missing, Integer} = 0,
cutoff::Union{Nothing, Integer} = nothing,
simulated = nothing
)
n = something(cutoff, length(travelled_prevalence))
## Infection→death PMF by age (age 0 = same day).
fd_pmf = convolve_pmf(incubation_pmf, od_pmf)
## Per-day expected export-death increment. Its running sum is the
## cumulative export-death intensity `Λ_d`.
death_daily = convolve_delay(travelled_prevalence, CFR .* fd_pmf)
if isempty(export_death_days)
## No dated series: cumulative single-total Poisson at the cut-off.
expected_exports_deaths_T := safe_rate(sum(upto(death_daily, n)))
exports_deaths ~ SafePoisson(expected_exports_deaths_T)
else
## Dated per-day Poisson. The clock stops at the last death day.
days, counts = dated_event_bins(export_death_days, n)
δ₁ = days[1]
pre = δ₁ > 1 ? sum(@view death_daily[1:(δ₁ - 1)]) :
zero(@inbounds death_daily[begin])
pre_death_exports ~ SafePoisson(safe_rate(pre))
raw_inc = bin_increments(death_daily, days)
μ_day = [
i == 1 ? raw_inc[1] - pre : raw_inc[i]
for i in eachindex(raw_inc)
]
obs = ismissing(exports_deaths) ? missing : counts
death_obs ~ to_submodel(
dated_poisson_model(μ_day, _sim_obs(simulated, :death_obs, obs))
)
expected_exports_deaths_T := safe_rate(pre + sum(μ_day))
end
return (; expected_exports_deaths_T, death_daily)
endSymptom-onset reporting delay
The digitised onset curve (see Data) is the only direct observation of the onset series.
The onset-to-report delay is a discrete-time hazard over delay
is the sum-to-zero basis used for the patch deviations, so the delay deviations sum to zero and
A calendar-time effect on the report day
The walk is zero up to the first figure's report date.
The cumulative reported proportion of onset date
, so the delay distribution is proper, and
The expected reported count is the onset series, each patch's onsets weighted by
The increment is scored with a Student-
The likelihood admits the negative increment a re-dated case can produce, and
collects counting variation around the cell's own modelled mean and, for each digitised bar the cell differences, the
We use
Three things stay weak. The ascertainment walk
The onset curve is fitted with alive and dead cases combined.
Submodel: onset_report_hazard_model
@model function onset_report_hazard_model(
grid_start::Integer,
grid_end::Integer;
D::Integer = ONSET_REPORT_MAX_DELAY,
baseline_prior = Normal(logit(0.13), 0.7),
pooling_prior = truncated(Normal(0.0, 1.0); lower = 0),
walk_sigma_prior = truncated(Normal(0.0, 0.3); lower = 0),
week::Integer = 7,
walk_start::Integer = grid_start,
basis = sum_to_zero_basis(D)
)
η0 ~ baseline_prior
σ_h0 ~ pooling_prior
## Sum-to-zero deviations, so `η0` is the mean logit hazard. With `D`
## free deviations their mean duplicated `η0` and only the sum of the
## two was identified. Each basis coordinate is drawn centred, on the
## scale `σ_h0`. `eps` floors the SD so a `σ_h0 ≈ 0` draw stays a proper
## distribution.
y_h0 ~ product_distribution(
fill(Normal(0, σ_h0 + eps(typeof(float(σ_h0)))), D - 1)
)
logit_h0 = η0 .+ basis * y_h0
## The local day count `nt` is floored at 1 so an empty or degenerate
## grid (the no-op path) still returns a well-formed length-1 `γ`.
nt = max(Int(grid_end) - Int(grid_start) + 1, 1)
## The first knot sits on `walk_start` at zero, and `interpolate_knots`
## holds every earlier day flat at that knot.
days = knot_days(nt; week, start = Int(walk_start) - Int(grid_start) + 1)
nb = length(days)
σ_γ ~ walk_sigma_prior
z_γ ~ product_distribution(fill(Normal(0, 1), max(nb - 1, 1)))
steps = σ_γ .* z_γ[1:max(nb - 1, 0)]
γ_knots = vcat(zero(σ_γ), cumsum(steps))
γ = interpolate_knots(γ_knots, days, nt)
return (; logit_h0, γ, grid_start = Int(grid_start), η0, σ_h0, σ_γ)
endSubmodel: onset_reporting_model
@model function onset_reporting_model(
onset_curve_history, onsets::AbstractVector;
hazard = onset_report_hazard_model,
ascertainment = onset_ascertainment_model,
anchor::AbstractVector = [0.15],
detection_day::Real = -Inf,
D::Integer = ONSET_REPORT_MAX_DELAY,
read_sd_prior = LogNormal(log(0.3), 0.5),
ν::Real = 4.0
)
onset_days = onset_curve_history.onset_days
report_days = onset_curve_history.report_days
prev_report_days = onset_curve_history.prev_report_days
m = length(onset_days)
## Report-date grid the calendar walk spans: the union of every onset
## and report day a scored cell can touch. Falls back to a degenerate
## length-1 grid `[1, 1]` when the history is empty (the no-op path),
## which `onset_report_hazard_model` handles via its own `nt` floor.
grid_start = m > 0 ? minimum(onset_days) : 1
grid_end = m > 0 ? max(maximum(report_days), grid_start) : 1
## The report-date walk moves only from the first snapshot, the first
## report day a delay can be seen on. Earlier onset dates are still on
## the grid, since every onset date's first print is scored.
walk_start = m > 0 ? max(minimum(report_days), grid_start) : grid_start
## Unprefixed (`false`): the hazard model has no `:=` deterministics to
## collide with, and hoisting its sampled variables into this frame
## surfaces them as a flat `onset_report_state.η0` at the composer level
## rather than the double-nested form a prefixed attachment would give.
## The pairs-plot summary indexes the flat names.
hazard_state ~ to_submodel(
hazard(grid_start, grid_end; D, walk_start), false
)
## Delay-weighted anchor series over the onset-date grid, built from the
## fitted hazard and the caller-supplied calendar-indexed daily
## ascertainment `anchor` (the confirmed pipeline's own series, or the
## length-1 constant default). Attached unprefixed for the same reason.
## One delay-CDF table over the onset-date grid, read by both the
## anchor series and the per-cell moments, so the reporting hazard is
## evaluated once per (delay, onset date) cell for the whole stream.
cdf_table = onset_report_cdf_table(
hazard_state.logit_h0,
hazard_state.γ, hazard_state.grid_start, grid_start,
grid_end
)
anchor_series = onset_report_anchor_series(
cdf_table, grid_start,
anchor
)
asc_state ~ to_submodel(
ascertainment(anchor_series, grid_start, grid_end; detection_day),
false
)
alpha = asc_state.alpha
## Read error: one SD for every read of a digitised bar. A correction
## cell differences two reads; a cell at the sentinel
## `prev_report_days[i] = 0` (the virtual empty predecessor of the first
## scored vintage) reads one bar.
τ ~ read_sd_prior
reads = [p == 0 ? 1 : 2 for p in prev_report_days]
moments = onset_report_moments(
cdf_table, grid_start, onsets,
hazard_state.grid_start, alpha, onset_days, report_days,
prev_report_days
)
scales = onset_report_scales(moments.means, τ, reads)
## Scored in a dedicated submodel so `increments` is a model argument on
## the left of `~`. Pulling the observations out of `onset_curve_history`
## into a local here would make every cell latent and drop the likelihood
## silently (see `onset_increments_model`). Attached unprefixed so the
## cells keep the flat `increments` name the predictive path reads.
increments_state ~ to_submodel(
onset_increments_model(
moments.means, scales,
onset_curve_history.increments, ν
), false
)
increments = increments_state.increments
return (;
increments, modelled = moments.means, scales,
logit_h0 = hazard_state.logit_h0, γ = hazard_state.γ,
grid_start = hazard_state.grid_start, grid_end, alpha, τ,
η0 = hazard_state.η0, σ_h0 = hazard_state.σ_h0,
σ_γ = hazard_state.σ_γ, β = asc_state.β, σ_a = asc_state.σ_a,
ρ = asc_state.ρ, ν,
)
endProvince compositions
The situation reports' spatial tables give per-province confirmed cases and confirmed deaths at shared vintages. At every vintage the provinces sum exactly to the national total the matching stream above already scores. The likelihood factorises accordingly and only the conditional term is scored here, with the vintage total conditioned on:
The modelled per-patch confirmed increments carry each patch's onsets through the same onset-to-confirmation delay as the national confirmed stream (the onset-to-report delay
with
Each vintage is then allocated across the patches by stick-breaking, the last patch taking the remainder:
is one overdispersion per composition, shared across patches and vintages. It absorbs extra-binomial variation in how cases are attributed to provinces, such as lags between the provincial and national tables and cases reassigned between health zones. The priors are
where
The death composition pins the incidence split, since the national case-fatality ratio and death-confirmation probability cancel from its normalised shares and
A third composition scores the per-province analysed-specimen volume by calendar week, conditional on the national analysed total the laboratory pipeline already scores. Write
The national testing fraction cancels from the shares, and the term samples no contrast of its own. The weeks are allocated by the stick-breaking of Equation (54) with an overdispersion
The background share
The laboratory composition identifies it, and the same split feeds each patch's non-BVD admissions in the treatment-centre flow.
Submodel: province_composition_model
@model function province_composition_model(
obs_increments::Union{Missing, AbstractMatrix{<:Integer}},
modelled_confirmed::AbstractMatrix;
rho_prior = truncated(Normal(0, 0.1); lower = 0, upper = 1),
ascertainment_sd_prior = truncated(Normal(0, 0.3); lower = 0),
severity_sd_prior = nothing,
severity_baseline = nothing,
ascertainment_offset_prior = Normal(0, 1),
basis = sum_to_zero_basis(size(modelled_confirmed, 1))
)
np, nv = size(modelled_confirmed)
ismissing(obs_increments) || size(obs_increments) == (np, nv) || error(
"province_composition_model: $(size(obs_increments)) observed " *
"increments for $(np) patches and $(nv) vintages."
)
ρ ~ rho_prior
## Read through a local. The tilde assigns `ρ` on more than one path, so
## the comprehension below would box it if it captured `ρ` itself.
rho = ρ
## Province-specific ascertainment, partially pooled. The share of
## confirmed cases falling in province `p` is `pi_p ∝ asc_p * lambda_p`,
## with `lambda_p` the modelled BVD incidence there and `asc_p` the
## probability an infection becomes a confirmed case. Only the product is
## identified: the per-province laboratory series pins `asc_p * lambda_p`
## and nothing finer.
##
## Fixing `asc_p` equal across provinces would hide that, and is known to
## be wrong here: over the fitted window Ituri ran 2112 tests for 671
## positives (31.8% positivity) against Nord-Kivu's 1340 for 74 (5.5%),
## so the provinces test very differently-selected pools. Equal
## ascertainment would push that difference into the provincial `Rt`,
## reporting a case-finding artefact as epidemiology.
##
## So `asc_p` is sampled, partially pooled toward equality on the log
## scale, and constrained to sum to zero, since only relative
## ascertainment enters a composition and the overall level belongs to
## the national ascertainment. The pooled deviation takes `np - 1` draws
## on the sum-to-zero directions ([`sum_to_zero_basis`](@ref)), the
## distribution of `np` independent `N(0, τ_asc²)` draws centred, with
## no direction the composition cannot see. `tau_asc -> 0` recovers the
## equal-ascertainment model. The pooling prior is what identifies
## `asc_p`, so the per-patch results are correspondingly wider.
##
## `ascertainment_sd_prior = nothing` turns the contrast off and the
## shares are the modelled split alone. The laboratory composition uses
## that, since its split is carried by the background shares
## ([`background_split_model`](@ref)) and a second free contrast would be
## confounded with them.
τ_asc = 0.0
asc = ones(np)
if ascertainment_sd_prior !== nothing
τ_asc ~ ascertainment_sd_prior
z_asc ~ product_distribution(
fill(ascertainment_offset_prior, np - 1)
)
asc = exp.(sum_to_zero(sum_to_zero_factor(basis, τ_asc), z_asc))
end
## Optional second multiplier, per-province severity. The death
## composition uses it for the per-province case-fatality ratio, partially
## pooled toward the national value on the logit scale and constrained to
## sum to zero, so the national ratio keeps its meaning and only the
## provincial contrast lives here. On the logit scale each province's
## ratio is a probability by construction, and `τ_sev -> 0` recovers the
## common ratio. The deaths in a province scale with its ratio, so the
## multiplier on the shares is that ratio over the national one. The case
## composition passes `nothing` and samples nothing.
##
## A composition identifies only the product `sev_p * asc_p`, so the two
## are separated by their priors and nothing else. On the death side
## [`bvd_joint`](@ref) gives both tight priors of about the same spread
## on the log scale, since near-uniform death ascertainment and lethality
## across provinces is the identifying assumption. Read `severity_sd`
## against its prior: a posterior that has not moved says the split is
## the prior's.
τ_sev = 0.0
sev = ones(np)
sev_logit = zeros(np)
if severity_sd_prior !== nothing
severity_baseline === nothing && error(
"province_composition_model: a severity contrast needs the " *
"severity_baseline it shifts."
)
τ_sev ~ severity_sd_prior
z_sev ~ product_distribution(
fill(ascertainment_offset_prior, np - 1)
)
sev_logit = sum_to_zero(sum_to_zero_factor(basis, τ_sev), z_sev)
sev = _logit_shift(severity_baseline, sev_logit) ./ severity_baseline
end
## Expected share of each patch at each vintage.
shares = composition_shares(asc .* sev, modelled_confirmed)
## The totals are conditioned on, not scored: they are already in the
## joint density through the national confirmed stream.
totals = _composition_totals(obs_increments, modelled_confirmed)
## Recorded so a simulated composition can be rebuilt in full: on the
## predictive path the last province is the remainder of these totals.
composition_totals := totals
## Attached unprefixed, so the split's `obs_increments[p, :]` sit
## directly under the composition's own prefix.
split_state ~ to_submodel(
composition_split_model(obs_increments, shares, totals, rho), false
)
return (;
shares, rho = ρ, obs_increments = split_state.obs_increments,
province_ascertainment = asc, ascertainment_sd = τ_asc,
province_severity = sev, severity_log_odds = sev_logit,
severity_sd = τ_sev,
)
endSubmodel: province_suspected_ascertainment_model
@model function province_suspected_ascertainment_model(
n_patches::Integer, centre::Real;
sd_prior = truncated(Normal(0, 0.5); lower = 0),
offset_prior = Normal(0, 1),
basis = sum_to_zero_basis(max(n_patches, 1))
)
if n_patches <= 1
return (;
ascertainment = fill(centre, max(n_patches, 1)),
relative = ones(typeof(float(centre)), max(n_patches, 1)),
log_odds = zeros(typeof(float(centre)), max(n_patches, 1)),
sd = zero(float(centre)),
)
end
τ_susp ~ sd_prior
z_susp ~ product_distribution(fill(offset_prior, n_patches - 1))
log_odds = sum_to_zero(sum_to_zero_factor(basis, τ_susp), z_susp)
ascertainment = _logit_shift(centre, log_odds)
return (;
ascertainment, relative = ascertainment ./ centre, log_odds,
sd = τ_susp,
)
endSubmodel: background_split_model
@model function background_split_model(
n_patches::Integer;
populations::AbstractVector{<:Real} = PROVINCE_POPULATIONS[
1:min(
n_patches, end
),
],
pooling_sd_prior = truncated(Normal(0, 1.5); lower = 0),
basis = sum_to_zero_basis(max(n_patches, 1))
)
if n_patches <= 1
return (; w = ones(Float64, max(n_patches, 1)), pooling_sd = 0.0)
end
length(populations) == n_patches || error(
"background_split_model: $(length(populations)) populations for " *
"$(n_patches) patches."
)
τ_bg ~ pooling_sd_prior
## Each basis coordinate is drawn centred, on the scale `τ_bg`. `eps`
## floors the SD so a `τ_bg ≈ 0` draw stays a proper distribution.
y_bg ~ product_distribution(
fill(Normal(0, τ_bg + eps(typeof(float(τ_bg)))), n_patches - 1)
)
dev = basis * y_bg
total_pop = sum(populations)
log_w = log.(populations ./ total_pop) .+ dev
## Softmax against the largest term, so a wide deviation cannot
## overflow.
peak = maximum(log_w)
w = exp.(log_w .- peak)
w ./= sum(w)
return (; w, pooling_sd = τ_bg)
endJoint model
The joint model runs the patch infection process once, stages each patch to daily symptom-onset incidence, and routes the summed onsets into every national observation stream, the symptom-onset reporting triangle included. It samples partially pooled per-stream dispersions and the pooled ascertainment fractions, threading
Single-stream models fit the exported cases and the deaths among exports together, the suspected deaths, the suspected cases, the laboratory-confirmed cases, the confirmed deaths, the treatment-centre streams and the symptom-onset reporting triangle. Other variants reuse these models with the data cut to an earlier date or with counts dropped.
Composer: exports and export-deaths fit
@model function exports_joint_only_model(
n::Integer, exported_cases::Union{Missing, Integer},
exports_deaths::Union{Missing, Integer};
export_case_days::AbstractVector{<:Integer} = Int[],
export_death_days::AbstractVector{<:Integer} = Int[],
breakpoint::Union{Missing, Real} = missing,
source_population::Real = ITURI_POPULATION,
infection = infection_model,
onset_incidence = onset_incidence_model,
deaths = deaths_model,
exports = exports_model,
dispersion = surveillance_dispersion_model(),
ascertainment = pooled_ascertainment_model(),
forecast::Union{Nothing, ForecastHorizon} = nothing
)
ckw = forecast === nothing ? (;) : (; cutoff = n)
latent ~ to_submodel(
_latent(n, breakpoint, infection, onset_incidence; forecast), false
)
dispersion_state ~ to_submodel(dispersion)
asc_state ~ to_submodel(ascertainment)
deaths_state ~ to_submodel(
deaths(
(; days = Int[], counts = Int[]), missing, latent.onsets,
dispersion_state.k; ckw...
)
)
exports_state ~ to_submodel(
exports(
exported_cases, latent.infection_state.infections,
asc_state.p_uganda; export_case_days,
incubation_pmf = latent.incubation_pmf, source_population,
ckw...
)
)
exports_deaths_state ~ to_submodel(
exports_deaths_model(
exports_deaths,
exports_state.travelled_prevalence, deaths_state.CFR,
deaths_state.od_pmf, latent.incubation_pmf; export_death_days,
ckw...
)
)
if forecast !== nothing
forecast_exports ~ to_submodel(
_forecast_exports(exports_state, forecast_days(n, forecast))
)
end
endComposer: deaths-only fit
@model function deaths_only_model(
n::Integer, total_deaths::Union{Missing, Integer};
deaths_history = (; days = Int[], counts = Int[]),
suspected_daily_deaths_history = (; days = Int[], counts = Int[]),
breakpoint::Union{Missing, Real} = missing,
infection = infection_model,
onset_incidence = onset_incidence_model,
deaths = deaths_model,
dispersion = surveillance_dispersion_model(),
forecast::Union{Nothing, ForecastHorizon} = nothing
)
ckw = forecast === nothing ? (;) : (; cutoff = n)
latent ~ to_submodel(
_latent(n, breakpoint, infection, onset_incidence; forecast), false
)
dispersion_state ~ to_submodel(dispersion)
deaths_state ~ to_submodel(
deaths(
deaths_history, total_deaths, latent.onsets,
dispersion_state.k; suspected_daily_deaths_history, ckw...
)
)
cumulative_deaths_total := cumsum(deaths_state.deaths_daily)
if forecast !== nothing
forecast_deaths ~ to_submodel(
_forecast_counts(
deaths_state.deaths_daily, forecast_days(n, forecast),
dispersion_state.k
)
)
end
endComposer: cases-only fit
@model function cases_only_model(
n::Integer, reported_cases::Union{Missing, Integer};
reported_history = (; days = Int[], counts = Int[]),
suspected_daily_history = (; days = Int[], counts = Int[]),
breakpoint::Union{Missing, Real} = missing,
infection = infection_model,
onset_incidence = onset_incidence_model,
cases = reported_cases_model,
dispersion = surveillance_dispersion_model(),
ascertainment = pooled_ascertainment_model(),
forecast::Union{Nothing, ForecastHorizon} = nothing
)
ckw = forecast === nothing ? (;) : (; cutoff = n)
latent ~ to_submodel(
_latent(n, breakpoint, infection, onset_incidence; forecast), false
)
dispersion_state ~ to_submodel(dispersion)
asc_state ~ to_submodel(ascertainment)
cases_state ~ to_submodel(
cases(
reported_history, reported_cases, latent.onsets,
dispersion_state.k, asc_state.p_drc; suspected_daily_history,
ckw...
)
)
cumulative_reports := cumsum(cases_state.reports_daily)
if forecast !== nothing
forecast_reports ~ to_submodel(
_forecast_counts(
cases_state.reports_daily, forecast_days(n, forecast),
dispersion_state.k
)
)
end
endComposer: confirmed-only fit
@model function confirmed_only_model(
n::Integer, confirmed_cases::Union{Missing, Integer};
confirmed_history = (; days = Int[], counts = Int[]),
lab_history = (; days = Int[], counts = Int[]),
lab_daily_history = (; days = Int[], counts = Int[]),
tests_analysed::Union{Missing, Integer} = missing,
breakpoint::Union{Missing, Real} = missing,
confirmed_break_days::AbstractVector{<:Integer} = Int[],
confirmed_break_gross_cases::AbstractVector{<:Integer} = Int[],
confirmed_break_sd::Real = 25.0,
infection = infection_model,
onset_incidence = onset_incidence_model,
cases = reported_cases_model,
confirmed = confirmed_cases_model,
dispersion = surveillance_dispersion_model(),
ascertainment = pooled_ascertainment_model(),
forecast::Union{Nothing, ForecastHorizon} = nothing
)
ckw = forecast === nothing ? (;) : (; cutoff = n)
latent ~ to_submodel(
_latent(n, breakpoint, infection, onset_incidence; forecast), false
)
dispersion_state ~ to_submodel(dispersion)
asc_state ~ to_submodel(ascertainment)
k = dispersion_state.k
p_drc = asc_state.p_drc
cases_state ~ to_submodel(
cases(
(; days = Int[], counts = Int[]), missing, latent.onsets,
k, p_drc; ckw...
)
)
confirmed_state ~ to_submodel(
confirmed(
confirmed_history, confirmed_cases, latent.onsets, k,
p_drc, cases_state.bg_daily, cases_state.τ_test,
cases_state.bvd_reports_daily;
lab_history, lab_daily_history,
tests_analysed, confirmed_break_days,
confirmed_break_gross = confirmed_break_gross_cases,
confirmed_break_sd, ckw...
)
)
expected_confirmed_T := confirmed_state.expected_confirmed
cumulative_confirmed := _cumulative_confirmed(
confirmed_state.confirmed_daily, confirmed_history, n
)
## A future day has no published analysed count, so its confirmed
## cases are the negative binomial the late windows take.
if forecast !== nothing
forecast_confirmed ~ to_submodel(
_forecast_counts(
confirmed_state.confirmed_daily,
forecast_days(n, forecast), k
)
)
end
endComposer: onsets-only fit
@model function onsets_only_model(
n::Integer;
onset_curve_history = (;
onset_days = Int[], report_days = Int[],
prev_report_days = Int[], increments = Int[],
),
breakpoint::Union{Missing, Real} = missing,
infection = infection_model,
onset_incidence = onset_incidence_model,
onset_report = onset_reporting_model,
export_case_days::AbstractVector{<:Integer} = Int[],
forecast::Union{Nothing, ForecastHorizon} = nothing
)
latent ~ to_submodel(
_latent(n, breakpoint, infection, onset_incidence; forecast), false
)
onset_report_state ~ to_submodel(
onset_report(
onset_curve_history, latent.onsets;
detection_day = onset_detection_day(export_case_days)
)
)
## Reported only, so built only when `:=` values are recorded.
if _reporting(__varinfo__)
expected_onset_reported_T := onset_report_expected_total(
latent.onsets,
onset_report_state.logit_h0, onset_report_state.γ,
onset_report_state.grid_start, onset_report_state.alpha, n
)
end
onset_ascertainment := onset_report_state.alpha
if forecast !== nothing && !isempty(onset_curve_history.onset_days)
onset_forecast ~ to_submodel(
onset_forecast_model(
latent.onsets, onset_report_state, n,
future_knot_days(n, horizon_days(forecast))
), false
)
end
return (; onsets = latent.onsets, onset_report_state)
endComposer: confirmed-deaths-only fit
@model function confirmed_deaths_only_model(
n::Integer, confirmed_deaths::Union{Missing, Integer},
total_deaths::Union{Missing, Integer} = missing;
deaths_history = (; days = Int[], counts = Int[]),
suspected_daily_deaths_history = (; days = Int[], counts = Int[]),
confirmed_deaths_history = (; days = Int[], counts = Int[]),
confirmed_break_days::AbstractVector{<:Integer} = Int[],
confirmed_break_gross_deaths::AbstractVector{<:Integer} = Int[],
confirmed_break_sd::Real = 25.0,
breakpoint::Union{Missing, Real} = missing,
infection = infection_model,
onset_incidence = onset_incidence_model,
deaths = deaths_model,
cases = reported_cases_model,
confirmed_deaths_stream = confirmed_deaths_model,
receipt = lab_delay_model(),
dispersion = surveillance_dispersion_model(),
ascertainment = pooled_ascertainment_model(),
forecast::Union{Nothing, ForecastHorizon} = nothing
)
ckw = forecast === nothing ? (;) : (; cutoff = n)
latent ~ to_submodel(
_latent(n, breakpoint, infection, onset_incidence; forecast), false
)
dispersion_state ~ to_submodel(dispersion)
asc_state ~ to_submodel(ascertainment)
k = dispersion_state.k
p_drc = asc_state.p_drc
cases_state ~ to_submodel(
cases(
(; days = Int[], counts = Int[]), missing, latent.onsets,
k, p_drc; ckw...
)
)
deaths_state ~ to_submodel(
deaths(
deaths_history, total_deaths, latent.onsets, k;
suspected_daily_deaths_history,
case_bg_daily = cases_state.bg_daily, ckw...
)
)
receipt_state ~ to_submodel(receipt)
confirmed_deaths_state ~ to_submodel(
confirmed_deaths_stream(
confirmed_deaths, total_deaths,
deaths_state.deaths_daily, deaths_state.bvd_deaths_daily,
deaths_state.bg_death_daily, k;
confirmed_deaths_history, receipt_pmf = receipt_state.pmf,
confirmed_break_days,
confirmed_break_gross = confirmed_break_gross_deaths,
confirmed_break_sd, ckw...
)
)
cumulative_confirmed_deaths := cumsum(
confirmed_deaths_state.confirmed_death_daily
)
if forecast !== nothing
forecast_confirmed_deaths ~ to_submodel(
_forecast_counts(
confirmed_deaths_state.confirmed_death_daily,
forecast_days(n, forecast), k
)
)
end
endComposer: treatment-centre-only fit
@model function treatment_only_model(
n::Integer;
isolation_history = (; days = Int[], counts = Int[]),
bed_capacity_history = (; days = Int[], counts = Int[]),
treatment_admissions_history = (; days = Int[], counts = Int[]),
treatment_deaths_history = (; days = Int[], counts = Int[]),
treatment_ruleout_history = (; days = Int[], counts = Int[]),
treatment_absconded_history = (; days = Int[], counts = Int[]),
treatment_confirmed_incare_history = (; days = Int[], counts = Int[]),
treatment_suspect_incare_history = (; days = Int[], counts = Int[]),
confirmed_history = (; days = Int[], counts = Int[]),
confirmed_cases::Union{Missing, Integer} = missing,
lab_history = (; days = Int[], counts = Int[]),
lab_daily_history = (; days = Int[], counts = Int[]),
tests_analysed::Union{Missing, Integer} = missing,
occupancy_break_days::AbstractVector{<:Integer} = Int[],
confirmed_break_days::AbstractVector{<:Integer} = Int[],
confirmed_break_gross_cases::AbstractVector{<:Integer} = Int[],
confirmed_break_sd::Real = 25.0,
breakpoint::Union{Missing, Real} = missing,
infection = infection_model,
onset_incidence = onset_incidence_model,
cases = reported_cases_model,
confirmed = confirmed_cases_model,
treatment = treatment_flow_model,
cfr = cfr_model(),
dispersion = surveillance_dispersion_model(),
ascertainment = pooled_ascertainment_model(),
## Built once, with the model, and passed to `treatment`.
treatment_defaults = treatment_flow_defaults(),
forecast::Union{Nothing, ForecastHorizon} = nothing
)
ckw = forecast === nothing ? (;) : (; cutoff = n)
latent ~ to_submodel(
_latent(n, breakpoint, infection, onset_incidence; forecast), false
)
dispersion_state ~ to_submodel(dispersion)
asc_state ~ to_submodel(ascertainment)
cfr_state ~ to_submodel(cfr)
k = dispersion_state.k
p_drc = asc_state.p_drc
cases_state ~ to_submodel(
cases(
(; days = Int[], counts = Int[]), missing, latent.onsets,
k, p_drc; ckw...
)
)
## Confirmed-case lab pipeline, run so the treatment model can borrow the
## daily testing intensity and positivity for the in-care confirmation
## overlay.
confirmed_state ~ to_submodel(
confirmed(
confirmed_history, confirmed_cases, latent.onsets, k,
p_drc, cases_state.bg_daily, cases_state.τ_test,
cases_state.bvd_reports_daily;
lab_history, lab_daily_history, tests_analysed,
confirmed_break_days,
confirmed_break_gross = confirmed_break_gross_cases,
confirmed_break_sd, ckw...
)
)
## In-care confirmation hazard `τ_test · p_pos` on the daily grid.
conf_hazard_daily = confirmed_state.τ_test .* confirmed_state.p_pos_grid
treatment_state ~ to_submodel(
treatment(
isolation_history, cases_state.bvd_reports_daily,
cases_state.bg_daily, p_drc, cfr_state.CFR;
capacity_history = bed_capacity_history,
admissions_history = treatment_admissions_history,
deaths_history = treatment_deaths_history,
ruleout_history = treatment_ruleout_history,
absconded_history = treatment_absconded_history,
confirmed_incare_history = treatment_confirmed_incare_history,
suspect_incare_history = treatment_suspect_incare_history,
occupancy_break_days = occupancy_break_days,
conf_hazard_daily = conf_hazard_daily,
defaults = treatment_defaults, ckw...
)
)
if forecast !== nothing
treatment_forecast ~ to_submodel(
treatment_forecast_model(
treatment_state, forecast_days(n, forecast),
bed_capacity_history, treatment_state.k_isolation
), false
)
end
endComposer: joint fit
@model function bvd_joint(
n::Integer,
exported_cases::Union{Missing, Integer},
total_deaths::Union{Missing, Integer},
reported_cases::Union{Missing, Integer} = missing,
exports_deaths::Union{Missing, Integer} = missing,
confirmed_cases::Union{Missing, Integer} = missing,
tests_analysed::Union{Missing, Integer} = missing;
n_patches::Integer = 1,
importation_kernel::AbstractMatrix = province_importation_kernel(
PROVINCE_POPULATIONS[1:min(n_patches, end)]
),
## Built with the model rather than in the differentiated body.
importation_flow_basis::NamedTuple = flow_pair_basis(n_patches),
confirmed_deaths::Union{Missing, Integer} = missing,
recovered_cases::Union{Missing, Integer} = missing,
deaths_history = (; days = Int[], counts = Int[]),
reported_history = (; days = Int[], counts = Int[]),
confirmed_history = (; days = Int[], counts = Int[]),
confirmed_deaths_history = (; days = Int[], counts = Int[]),
lab_history = (; days = Int[], counts = Int[]),
lab_daily_history = (; days = Int[], counts = Int[]),
suspected_daily_history = (; days = Int[], counts = Int[]),
suspected_daily_deaths_history = (; days = Int[], counts = Int[]),
isolation_history = (; days = Int[], counts = Int[]),
bed_capacity_history = (; days = Int[], counts = Int[]),
recovered_history = (; days = Int[], counts = Int[]),
treatment_admissions_history = (; days = Int[], counts = Int[]),
treatment_deaths_history = (; days = Int[], counts = Int[]),
treatment_ruleout_history = (; days = Int[], counts = Int[]),
treatment_absconded_history = (; days = Int[], counts = Int[]),
treatment_confirmed_incare_history = (; days = Int[], counts = Int[]),
treatment_suspect_incare_history = (; days = Int[], counts = Int[]),
occupancy_break_days::AbstractVector{<:Integer} = Int[],
confirmed_break_days::AbstractVector{<:Integer} = Int[],
confirmed_break_gross_cases::AbstractVector{<:Integer} = Int[],
confirmed_break_gross_deaths::AbstractVector{<:Integer} = Int[],
confirmed_break_sd::Real = 25.0,
export_case_days::AbstractVector{<:Integer} = Int[],
export_death_days::AbstractVector{<:Integer} = Int[],
onset_curve_history = (;
onset_days = Int[], report_days = Int[],
prev_report_days = Int[], increments = Int[],
),
breakpoint::Union{Missing, Real} = missing,
source_population::Real = ITURI_POPULATION,
patch_infection = patch_infection_model,
composition = province_composition_model,
suspected_ascertainment = province_suspected_ascertainment_model,
province_increments::Union{
Missing, AbstractMatrix{<:Integer},
} = missing,
province_days::AbstractVector{<:Integer} = Int[],
province_lab_increments::Union{
Missing, AbstractMatrix{<:Integer},
} = missing,
province_lab_days::AbstractVector{<:Integer} = Int[],
province_lab_bins::AbstractVector{<:Integer} = 1:length(province_lab_days),
lab_composition = province_composition_model,
background_split = background_split_model,
province_isolation = nothing,
province_capacity = nothing,
province_admissions = nothing,
province_death_increments::Union{
Missing, AbstractMatrix{<:Integer},
} = missing,
province_death_days::AbstractVector{<:Integer} = Int[],
death_composition = province_composition_model,
death_ascertainment_sd_prior = truncated(
Normal(0, 0.1); lower = 0
),
province_cfr_sd_prior = truncated(Normal(0, 0.15); lower = 0),
export_pressure = province_export_pressure_model,
exports = exports_model,
deaths = deaths_model,
cases = reported_cases_model,
confirmed = confirmed_cases_model,
confirmed_deaths_stream = confirmed_deaths_model,
treatment = treatment_flow_model,
recovered = recovered_model,
onset_report = onset_reporting_model,
dispersion = pooled_dispersion_model,
ascertainment = pooled_ascertainment_model(),
background_pooling = nothing,
genetic = nothing,
onset_to_sample = nejm_onset_to_sample(),
tmrca_days::Union{Missing, Real} = missing,
tmrca_days_sd::Real = 16.0,
renewal_start_lead::Integer = RENEWAL_START_LEAD,
rt_walk_lead::Integer = RT_WALK_LEAD,
## Days the suspected-case background starts before the first
## reported case: the support of the default report-to-receipt
## kernel, so the convolution into the analysed volume is fully
## formed by that report.
background_onset_lead::Integer = cdf_nmax(lognormal_meansd(4.5, 4.0)),
## Built once, with the model, and passed to `treatment`.
treatment_defaults = treatment_flow_defaults(),
forecast::Union{Nothing, ForecastHorizon} = nothing,
simulated_data = nothing
)
if n_patches == 1 && (
!isempty(province_days) || !isempty(province_death_days) ||
!isempty(province_lab_days) ||
_has_province_rows(province_isolation) ||
_has_province_rows(province_capacity) ||
_has_province_rows(province_admissions)
)
error(
"per-province data was supplied but n_patches = 1. The " *
"spatial structure would be silently dropped. Pass " *
"n_patches = $(length(PROVINCE_NAMES)) (or the number of " *
"patches the data covers)."
)
end
rt_start = ismissing(tmrca_days) ? 1 :
clamp(n - round(Int, tmrca_days) + renewal_start_lead, 1, n)
rt_walk_start = ismissing(breakpoint) ? rt_start :
clamp(round(Int, breakpoint) - rt_walk_lead, rt_start, n)
latent ~ to_submodel(
_patch_latent(
n, n_patches, breakpoint, patch_infection;
rt_start, rt_walk_start, importation_kernel,
flow_basis = importation_flow_basis, forecast
), false
)
patch_state = latent.patch_state
onsets = latent.onsets_total
## Each stream reads its cut-off quantities at day `n` whatever length
## the latent grid runs to.
ckw = forecast === nothing ? (;) : (; cutoff = n)
dispersion_state ~ to_submodel(dispersion(6))
asc_state ~ to_submodel(ascertainment)
kv = dispersion_state.k
k_cases = kv[1]
k_deaths = kv[2]
k_confirmed = kv[3]
k_confirmed_deaths = kv[4]
k_isolation = kv[5]
k_recovered = kv[6]
p_drc = asc_state.p_drc
p_uganda = asc_state.p_uganda
## Suspected-case detection by patch, partially pooled about `p_drc` on
## the logit scale. Sampled with the case composition, whose
## relative ascertainment it splits into detection and confirmation.
## The national BVD suspected cases are each patch's onsets weighted by
## its detection over `p_drc` and then scaled by `p_drc`, so every
## stream that reads `p_drc` times the BVD reports reads the per-patch
## sum. `nothing` leaves the national `p_drc` on every patch.
by_detection = suspected_ascertainment !== nothing &&
!isempty(province_days)
if by_detection
detection_state ~ to_submodel(
suspected_ascertainment(n_patches, p_drc)
)
end
detected_onsets_matrix = by_detection ?
detection_state.relative .* patch_state.onsets_matrix :
patch_state.onsets_matrix
case_onsets = by_detection ?
transpose(patch_state.onsets_matrix) * detection_state.relative :
onsets
## The national suspected-case ascertainment the fit implies: `p_drc`
## is the centre of the logit contrast rather than the national rate,
## which is the patch probabilities weighted by their onsets to the
## cut-off. It is `p_drc` when the detection is off.
p_drc_national := by_detection ?
p_drc * sum(upto(case_onsets, n)) / sum(upto(onsets, n)) : p_drc
bg_onset = isempty(reported_history.days) ? 1 :
clamp(Int(reported_history.days[1]) - background_onset_lead, 1, n)
## `nothing` holds the non-BVD background at the constant rate the
## testing submodel samples. An injected pooling submodel gives it a
## smooth daily random walk instead, whose scale is partially pooled.
## Injected rather than switched on a flag so the unused arm is a
## `Nothing` the compiler folds away, not a second branch: a `Bool`
## reaches the model as a value, so both arms are inferred and the
## resulting `Union`-typed argument specialises the whole
## suspected-case submodel twice.
case_bg_re = if background_pooling === nothing
nothing
else
bg_pool ~ to_submodel(background_pooling())
σ_rw_shared = bg_pool.σ_bg
(nn; kw...) -> background_walk_model(
nn, σ_rw_shared; onset = bg_onset, kw...
)
end
## Cases first so the suspected-case background `bg_daily` is available
## to the deaths stream, which scales it by `cfr_bg`, and to the
## laboratory pipeline.
cases_state ~ to_submodel(
cases(
reported_history, reported_cases, case_onsets, k_cases, p_drc;
suspected_daily_history, background_re = case_bg_re, ckw...,
_sim_kw(simulated_data, :cases_state)...
)
)
deaths_state ~ to_submodel(
deaths(
deaths_history, total_deaths, onsets, k_deaths;
suspected_daily_deaths_history,
case_bg_daily = cases_state.bg_daily, ckw...,
_sim_kw(simulated_data, :deaths_state)...
)
)
confirmed_state ~ to_submodel(
confirmed(
confirmed_history, confirmed_cases, onsets, k_confirmed,
p_drc, cases_state.bg_daily, cases_state.τ_test,
cases_state.bvd_reports_daily;
lab_history, lab_daily_history,
tests_analysed, confirmed_break_days,
confirmed_break_gross = confirmed_break_gross_cases,
confirmed_break_sd,
specimen_intensity = specimen_intensity_model(), ckw...,
_sim_kw(simulated_data, :confirmed_state)...
)
)
## Split of the non-BVD suspected background across the patches, shared
## by the laboratory composition below and the isolation stream. One
## patch takes the whole background and samples nothing.
bg_split_state ~ to_submodel(background_split(n_patches))
province_background_split := bg_split_state.w
province_background_split_sd := bg_split_state.pooling_sd
## The anchor stops at the cut-off, so a longer grid leaves the fitted
## ascertainment where it was. The curve reads the detection-weighted
## onsets, which the anchor's `p_drc` scales as it does in the
## suspected and confirmed streams.
onset_anchor_daily = p_drc .* confirmed_state.τ_test .*
upto(confirmed_state.p_pos_grid, n)
onset_report_state ~ to_submodel(
onset_report(
onset_curve_history, case_onsets;
anchor = onset_anchor_daily,
detection_day = onset_detection_day(export_case_days)
)
)
confirmed_deaths_state ~ to_submodel(
confirmed_deaths_stream(
confirmed_deaths, total_deaths,
deaths_state.deaths_daily, deaths_state.bvd_deaths_daily,
deaths_state.bg_death_daily, k_confirmed_deaths;
confirmed_deaths_history, receipt_pmf = confirmed_state.receipt_pmf,
confirmed_break_days,
confirmed_break_gross = confirmed_break_gross_deaths,
confirmed_break_sd,
case_analysed_daily = confirmed_state.analysed_daily,
case_suspected_daily = cases_state.reports_daily, ckw...,
_sim_kw(simulated_data, :confirmed_deaths_state)...
)
)
## The confirmed and laboratory compositions both carry the patch
## onsets, weighted by their relative detection, through the
## onset-to-confirmation kernel, once here.
if !isempty(province_days) || !isempty(province_lab_days)
confirmed_kernel = convolve_pmf(
cases_state.report_pmf, confirmed_state.receipt_pmf
)
confirmed_carried = _patch_carried(
detected_onsets_matrix, confirmed_kernel
)
end
if !isempty(province_days)
modelled_prov = _patch_confirmed_increments(
confirmed_carried, confirmed_state.s_test, province_days
)
composition_state ~ to_submodel(
composition(province_increments, modelled_prov)
)
province_shares := composition_state.shares
province_composition_rho := composition_state.rho
## Relative province case ascertainment, the probability an
## infection there becomes a confirmed case, on the log scale
## relative to the geometric mean. It is the suspected-case detection
## times the composition's sum-to-zero confirmation contrast, which
## carries the provincial differences in testing. On its own the
## case composition identifies only the product of ascertainment and
## incidence. The death composition below separates them.
province_ascertainment := by_detection ?
_geomean_relative(
detection_state.relative .*
composition_state.province_ascertainment
) : composition_state.province_ascertainment
## The confirmation contrast's spread.
province_ascertainment_sd := composition_state.ascertainment_sd
if by_detection
province_suspected_ascertainment := detection_state.ascertainment
province_suspected_ascertainment_sd := detection_state.sd
province_confirmation_relative :=
composition_state.province_ascertainment
## The spread of the log relative case ascertainment between
## the patches, detection and confirmation together. With a
## sum-to-zero contrast of scale `τ` its expected square is
## `τ²`, so it is on the confirmation spread's scale and the
## zone stage centres its own spread on it.
province_ascertainment_log_sd := std(log.(province_ascertainment))
end
end
## The confirmation contrast by patch, which with the detection already
## in `confirmed_carried` splits the national BVD volume between the
## patches' laboratories. Without the detection contrast it is the whole
## relative case ascertainment, and the per-patch bed demand splits on
## it too. Ones when the case composition is not scored.
patch_asc = isempty(province_days) ? ones(n_patches) :
composition_state.province_ascertainment
conf_hazard_daily = confirmed_state.τ_test .* confirmed_state.p_pos_grid
## Per-patch BVD reports for the province occupancy split, each weighted
## by the patch's relative detection, the rows summing to the national
## series the flows are built on. A detected suspect is admitted before
## testing, so the occupancy split does not carry the confirmation
## contrast.
bvd_reports_matrix = n_patches > 1 ?
_patch_reports(detected_onsets_matrix, cases_state.report_pmf) :
nothing
## With the detection contrast in the reports, the care split takes them
## as they are.
care_asc = suspected_ascertainment === nothing ? patch_asc : nothing
treatment_state ~ to_submodel(
treatment(
isolation_history, cases_state.bvd_reports_daily,
cases_state.bg_daily, p_drc, deaths_state.CFR;
bvd_reports_matrix,
background_split = bg_split_state.w,
patch_ascertainment = care_asc,
province_isolation, province_capacity, province_admissions,
capacity_history = bed_capacity_history,
admissions_history = treatment_admissions_history,
deaths_history = treatment_deaths_history,
ruleout_history = treatment_ruleout_history,
absconded_history = treatment_absconded_history,
confirmed_incare_history = treatment_confirmed_incare_history,
suspect_incare_history = treatment_suspect_incare_history,
occupancy_break_days = occupancy_break_days,
conf_hazard_daily = conf_hazard_daily,
k_external = k_isolation,
defaults = treatment_defaults, ckw...,
_sim_kw(simulated_data, :treatment_state)...
)
)
recovered_state ~ to_submodel(
recovered(
recovered_history, recovered_cases,
confirmed_state.confirmed_daily, deaths_state.CFR;
k_external = k_recovered, ckw...,
_sim_kw(simulated_data, :recovered_state)...
)
)
export_pressure_state ~ to_submodel(export_pressure(n_patches))
export_weight := export_pressure_state.weights
export_pressure_sd := export_pressure_state.pooling_sd
## The patches' infections weighted by export propensity, one
## matrix-vector product, over the grid past the cut-off when forecasting.
export_infections = transpose(patch_state.infections_matrix) *
export_pressure_state.weights
exports_state ~ to_submodel(
exports(
exported_cases, export_infections, p_uganda;
export_case_days, incubation_pmf = patch_state.incubation_pmf,
source_population, ckw...,
_sim_kw(simulated_data, :exports_state)...
)
)
exports_deaths_state ~ to_submodel(
exports_deaths_model(
exports_deaths,
exports_state.travelled_prevalence, deaths_state.CFR,
deaths_state.od_pmf, patch_state.incubation_pmf; export_death_days,
ckw...,
_sim_kw(simulated_data, :exports_deaths_state)...
)
)
if genetic !== nothing
genetic_state ~ to_submodel(
genetic(patch_state.T, tmrca_days; tmrca_days_sd), false
)
end
if !isempty(province_lab_days)
modelled_lab = _patch_analysed_increments(
confirmed_carried, p_drc, patch_asc,
convolve_delay(cases_state.bg_daily, confirmed_state.receipt_pmf),
bg_split_state.w, province_lab_days, province_lab_bins
)
## No ascertainment contrast of its own: the split is carried by the
## background shares and the case composition's ascertainment, and
## the testing fraction is national.
lab_composition_state ~ to_submodel(
lab_composition(
province_lab_increments, modelled_lab;
ascertainment_sd_prior = nothing
)
)
province_lab_shares := lab_composition_state.shares
province_lab_composition_rho := lab_composition_state.rho
end
if !isempty(province_death_days)
death_kernel = convolve_pmf(
deaths_state.od_pmf, confirmed_state.receipt_pmf
)
modelled_deaths_prov = _patch_death_increments(
patch_state.onsets_matrix, death_kernel, province_death_days
)
## The case-fatality contrast is on the logit scale, where a shift
## `s` moves the log ratio by about `(1 - CFR) s`. A spread of 0.15
## is about 0.1 on the log scale at the prior mean ratio of 0.33,
## the death ascertainment's spread.
death_composition_state ~ to_submodel(
death_composition(
province_death_increments,
modelled_deaths_prov;
ascertainment_sd_prior = death_ascertainment_sd_prior,
severity_sd_prior = province_cfr_sd_prior,
severity_baseline = deaths_state.CFR
)
)
province_death_shares := death_composition_state.shares
province_death_composition_rho := death_composition_state.rho
province_death_ascertainment := death_composition_state.province_ascertainment
province_death_ascertainment_sd := death_composition_state.ascertainment_sd
## Per-province case-fatality ratio, the national ratio shifted by
## that province's sum-to-zero contrast on the logit scale, so each
## lies in (0, 1) and the provinces are reported on the same scale as
## the national quantity they pool toward. The relative fatality is
## that ratio over the national one.
province_cfr_relative := death_composition_state.province_severity
CFR_patch := _logit_shift(
deaths_state.CFR, death_composition_state.severity_log_odds
)
province_cfr_sd := death_composition_state.severity_sd
end
## The cumulative series and the combined delay PMFs below are reported
## only, so they are built only when `:=` values are recorded.
if _reporting(__varinfo__)
cumulative_expected_deaths := cumsum(deaths_state.bvd_deaths_daily)
cumulative_confirmed := _cumulative_confirmed(
confirmed_state.confirmed_daily, confirmed_history, n
)
## Each of the remaining count streams sums to its own cut-off
## expected total, so none needs the baseline re-add the confirmed
## path takes.
cumulative_reports := cumsum(cases_state.reports_daily)
cumulative_deaths_total := cumsum(deaths_state.deaths_daily)
cumulative_confirmed_deaths := cumsum(
confirmed_deaths_state.confirmed_death_daily
)
cumulative_recovered := cumsum(recovered_state.recovered_daily)
onset_to_confirmation_pmf := convolve_pmf(
cases_state.report_pmf, confirmed_state.receipt_pmf
)
onset_to_death_confirmation_pmf := convolve_pmf(
deaths_state.od_pmf, confirmed_state.receipt_pmf
)
end
onset_to_sample_mean := cases_state.report_mean +
confirmed_state.receipt_mean
onset_to_sample_sd := sqrt(
cases_state.report_sd^2 +
confirmed_state.receipt_sd^2
)
if onset_to_sample !== nothing
@addlogprob! onset_to_sample_logweight(
cases_state.report_mean,
cases_state.report_sd, confirmed_state.receipt_mean,
confirmed_state.receipt_sd, onset_to_sample
)
end
R0 := patch_state.R0
r := patch_state.r
r0 := patch_state.r0
doubling_time := patch_state.doubling_time
T := patch_state.T
R_T := patch_state.R_T
expected_infections_T := @inbounds(patch_state.infections_total[n])
CFR := deaths_state.CFR
## Per-patch quantities, as vector deterministics (one entry per patch).
if n_patches > 1 && size(treatment_state.capacity_patch, 1) == n_patches
## Cut-off beds, demand, occupancy and shortfall by patch
## ([`cutoff_occupancy`](@ref)); the national figures are their sums.
## Present only when a province split scored them.
province_bed_capacity := treatment_state.beds_patch_T
province_bed_demand := treatment_state.demand_patch[:, n]
province_expected_isolation := treatment_state.occupancy_patch_T
province_bed_utilisation := treatment_state.occupancy_patch_T ./
treatment_state.beds_patch_T
province_bed_shortfall := treatment_state.shortfall_patch_T
province_capacity_share := treatment_state.capacity_shares
province_capacity_share_sd := treatment_state.capacity_pooling_sd
## Daily share of the national bed demand by patch, the modelled
## centre of the occupancy split.
province_occupancy_share := treatment_state.demand_patch ./
sum(treatment_state.demand_patch; dims = 1)
province_occupancy_split_rho := treatment_state.occupancy_split_rho
## Daily share of the national admissions by patch, the modelled
## centre of the admissions split.
province_admissions_share := treatment_state.admit_patch ./
sum(treatment_state.admit_patch; dims = 1)
province_capacity_split_rho := treatment_state.capacity_split_rho
province_admissions_split_rho := treatment_state.admissions_split_rho
## Scales of the province level and weekly walk in the background
## admission shares, zero when the province admissions are not
## scored.
province_background_admission_level_sd :=
treatment_state.background_admission_level_sd
province_background_admission_walk_sd :=
treatment_state.background_admission_walk_sd
end
C_T_patch := patch_state.C_T_patch
## Each province's reproduction number net of its own depletion, built
## only when recorded.
if _reporting(__varinfo__)
fr = _patch_fractions(patch_state)
susceptible_fraction_patch := vec(fr[:, 1:n])
R_T_patch := [
only(_patch_adjusted_rt(patch_state, fr, p, n:n))
for p in 1:n_patches
]
end
infections_T_patch := [
@inbounds(patch_state.infections_matrix[p, n])
for p in 1:n_patches
]
infections_patch := vec(patch_state.infections_matrix)
importation_patch := vec(patch_state.importation_matrix)
delta_patch := [@inbounds(patch_state.δ_patch[p, n]) for p in 1:n_patches]
delta_patch_start := [
@inbounds(patch_state.δ_patch[p, rt_walk_start])
for p in 1:n_patches
]
## The deviation at every weekly knot, flattened column-major from the
## `(n_patches × n_knots)` matrix, so the provincial Rt trajectory can be
## rebuilt for plotting ([`reconstruct_patch_rt`](@ref)).
delta_knots := vec(patch_state.δ_knots)
region_sd := patch_state.σ_level
region_drift_sd := patch_state.σ_δ
region_halflife := patch_state.δ_halflife
region_corr_primary_secondary := n_patches > 1 ?
@inbounds(patch_state.Ω[1, 2]) :
one(eltype(patch_state.Ω))
log_rt_contrast := [
@inbounds(
patch_state.δ_patch[p, n] -
patch_state.δ_patch[1, n]
)
for p in 1:n_patches
]
## Population-level dispersion (`k`, the headline scalar) plus the
## partially-pooled per-stream dispersions and the pooling SD.
k := dispersion_state.k_pop
k_cases := kv[1]
k_deaths := kv[2]
k_confirmed := kv[3]
k_confirmed_deaths := kv[4]
dispersion_sd := dispersion_state.τ
p_drc := asc_state.p_drc
p_uganda := asc_state.p_uganda
expected_deaths_T := deaths_state.expected_deaths_T
expected_reports_T := cases_state.expected_reports
expected_confirmed_T := confirmed_state.expected_confirmed
expected_analysed_T := confirmed_state.expected_analysed
_ecd = confirmed_deaths_state.expected_confirmed_deaths
expected_confirmed_deaths_T := _ecd
expected_exports_T := exports_state.expected_exports
expected_exports_deaths_T := exports_deaths_state.expected_exports_deaths_T
## Cut-off expected onset-reported total and the modelled per-onset-date
## ascertainment level, off the same fitted hazard and ascertainment
## walk. The total is reported only, so it is built only when `:=`
## values are recorded.
if _reporting(__varinfo__)
expected_onset_reported_T := onset_report_expected_total(
onsets,
onset_report_state.logit_h0, onset_report_state.γ,
onset_report_state.grid_start, onset_report_state.alpha, n
)
end
onset_ascertainment := onset_report_state.alpha
expected_isolation_T := treatment_state.expected_isolation
expected_bed_demand_T := treatment_state.expected_bed_demand
bed_shortfall_T := treatment_state.bed_shortfall
## Cut-off occupancy split, the confirmed-in-care and suspect-in-care
## sub-stock prevalences carved from the occupied true-case stock by the
## confirmation overlay.
expected_confirmed_incare_T := treatment_state.expected_confirmed_incare
expected_suspect_incare_T := treatment_state.expected_suspect_incare
## Cut-off daily treatment flows.
expected_admissions_T := treatment_state.expected_admissions
expected_incare_deaths_T := treatment_state.expected_incare_deaths
expected_ruleouts_T := treatment_state.expected_ruleouts
bed_capacity := treatment_state.capacity
isolation_admission := treatment_state.p_iso
isolation_bvd_admission := treatment_state.p_iso_bvd
isolation_severity := treatment_state.δ_iso
## BVD bed stay outcome mixture: `isolation_bvd_los_mean` is the mixture
## mean (overall length-of-stay), with the death and recovery branch means
## surfaced separately.
isolation_bvd_los_mean := treatment_state.overall_los
isolation_death_los_mean := treatment_state.death_los_mean
isolation_recovery_los_mean := treatment_state.recovery_los_mean
isolation_ruleout_los_mean := treatment_state.ruleout_los_mean
isolation_admission_delay_mean := treatment_state.admission_delay_mean
isolation_dispersion := treatment_state.k_isolation
treatment_flow_dispersion := treatment_state.k_flow
## In-care fatality CFR_iso, a modifier on the infection CFR, and the
## abscond fraction.
incare_cfr := treatment_state.CFR_iso
incare_cfr_modifier := treatment_state.β_iso
abscond_fraction := treatment_state.abscond_frac
## In-care confirmation-rate modifier ρ on the borrowed community
## confirmation hazard, identified by the confirmed/suspected-in-care split.
incare_confirm_modifier := treatment_state.incare_confirm_modifier
expected_recovered_T := recovered_state.expected_recovered
recovery_probability := recovered_state.p_recover
recovery_delay_mean := recovered_state.recovery_delay_mean
recovered_dispersion := recovered_state.k_recovered
tau_test := cases_state.τ_test
## Specimens analysed per suspect sampled. `1.0` when the factor is off.
specimens_per_suspect := confirmed_state.κ_test === nothing ? 1.0 :
confirmed_state.κ_test
lambda_bg := cases_state.λ_bg
bg_sigma := cases_state.bg_sigma
background_total := cases_state.bg_total
death_ascertainment := deaths_state.p_death
background_cfr := deaths_state.cfr_bg
lambda_bg_death := deaths_state.λ_bg_death
bg_death_sigma := deaths_state.bg_death_sigma
background_death_total := deaths_state.bg_death_total
tau_death := confirmed_deaths_state.τ_death
death_testing_scaling := confirmed_deaths_state.scaling
suspected_positivity := cases_state.positivity
test_positivity := confirmed_state.p_positive
death_composition := confirmed_deaths_state.q_death
death_confirmation := confirmed_deaths_state.p_death_conf
## Past the cut-off each stream draws its future counts through its own
## likelihood, as `missing` observations `predict` generates.
forecast_means = nothing
if forecast !== nothing
fd = forecast_days(n, forecast)
vintages = future_knot_days(n, horizon_days(forecast))
forecast_reports ~ to_submodel(
_forecast_counts(cases_state.reports_daily, fd, k_cases)
)
forecast_deaths ~ to_submodel(
_forecast_counts(deaths_state.deaths_daily, fd, k_deaths)
)
## A future day has no published analysed count, so its confirmed
## cases are the negative binomial the late windows take.
forecast_confirmed ~ to_submodel(
_forecast_counts(confirmed_state.confirmed_daily, fd, k_confirmed)
)
forecast_confirmed_deaths ~ to_submodel(
_forecast_counts(
confirmed_deaths_state.confirmed_death_daily, fd,
k_confirmed_deaths
)
)
forecast_recovered ~ to_submodel(
_forecast_counts(recovered_state.recovered_daily, fd, k_recovered)
)
treatment_forecast ~ to_submodel(
treatment_forecast_model(
treatment_state, fd, bed_capacity_history, k_isolation
), false
)
forecast_exports ~ to_submodel(_forecast_exports(exports_state, fd))
forecast_latent_deaths := deaths_state.bvd_deaths_daily[fd]
onset_means = nothing
if !isempty(onset_curve_history.onset_days)
onset_forecast ~ to_submodel(
onset_forecast_model(
onsets, onset_report_state, n, vintages
), false
)
onset_means = onset_forecast.means
end
## Each province's share of the national forecast, one split a
## week, by the fitted composition: the same delays, ascertainment
## and overdispersion the province tables are fitted with, so the
## provinces add up to the national counts drawn above.
forecast_infections_patch := vec(patch_state.infections_matrix[:, fd])
forecast_importation_patch := vec(patch_state.importation_matrix[:, fd])
if _reporting(__varinfo__)
frf = _patch_fractions(patch_state)
forecast_rt_patch := vec(
permutedims(
reduce(
hcat,
[
_patch_adjusted_rt(patch_state, frf, p, fd)
for p in 1:n_patches
]
)
)
)
end
edges = vcat(n, vintages)
if !isempty(province_days)
province_future = _patch_confirmed_increments(
confirmed_carried, confirmed_state.s_test, edges
)[:, 2:end]
forecast_province_split ~ to_submodel(
composition_split_model(
missing,
composition_shares(
composition_state.province_ascertainment .*
composition_state.province_severity,
province_future
),
_weekly_totals(forecast_confirmed.increments, n, edges),
composition_state.rho
)
)
forecast_province_confirmed := vec(
forecast_province_split.obs_increments
)
end
if !isempty(province_death_days)
province_deaths_future = _patch_death_increments(
patch_state.onsets_matrix, death_kernel, edges
)[:, 2:end]
forecast_province_death_split ~ to_submodel(
composition_split_model(
missing,
composition_shares(
death_composition_state.province_ascertainment .*
death_composition_state.province_severity,
province_deaths_future
),
_weekly_totals(
forecast_confirmed_deaths.increments, n, edges
),
death_composition_state.rho
)
)
forecast_province_deaths := vec(
forecast_province_death_split.obs_increments
)
end
forecast_means = (;
reports = forecast_reports.modelled,
deaths = forecast_deaths.modelled,
confirmed = forecast_confirmed.modelled,
confirmed_deaths = forecast_confirmed_deaths.modelled,
recovered = forecast_recovered.modelled,
treatment_forecast.isolation, treatment_forecast.admissions,
treatment_forecast.beds, onset_reports = onset_means,
)
end
return (;
patch_state, onsets, cases_state, deaths_state, confirmed_state,
confirmed_deaths_state, treatment_state, recovered_state,
exports_state, onset_report_state, forecast_means,
)
endHealth-zone model
The situation reports also give cumulative confirmed cases and deaths for each health zone. A second model splits the joint model's infections in each patch across the health zones of that patch. It is fitted after the joint model, to the same cut-off, and does not feed back into it.
Inputs from the joint model
The zone model samples the joint model's weekly infections in each patch, the parameters of the generation interval and the delays and, when zones mix, the importation intensity of each origin patch at the cut-off. It fixes the mean import log odds and the arrival shares, and each draw recomputes the import fraction from its sampled curves. The sampling step is two-stage Markov melding (Goudie et al., 2019) run one way. With
with
Here
Zone data
The zone tables are Tableau 2 of the same situation reports (INSP, 2026), read at the vintages
A vintage can move earlier counts into named zones. The case composition leaves out a patch on a vintage on which the unallocated count of one of its provinces falls in either table. The death composition leaves out a patch on a vintage on which its unallocated deaths fall or a named zone loses more than one death.
Zone infections
The zone model starts on day
with
Movement between zones
Movement between patches is the joint model's own, and only movement within a patch is estimated here. With
with
the first within a patch and the second between patches, with
Patch
with
The origin intensities
Zone deviations
The deviations
with
Only zones with at least 30 cumulative confirmed cases at the cut-off take weekly innovations, and only in patches with two or more such zones. The other zones keep a level that decays toward zero. We use a prior of
Zone observations
Expected confirmed cases carry each zone's infections through the draw's infection-to-receipt delay
Expected confirmed deaths
with relative ascertainment
Here
We pin the fatality scale with a tight prior
Zone reproduction number
The zone reproduction number inverts the zone renewal, as Equation (19) does nationally:
It is reported from the day the zone's cumulative infections reach ten in the median draw. For a zone without innovations it is the patch value scaled by the zone's decaying deviation level. This is exact when zones do not mix and approximate when they do, since imported infections also enter the zone. We report the posterior probability that each zone's reproduction number exceeds one and rank the zones by it.
Zone model assumptions
The joint posterior of the patch infections and of the generation-interval and delay parameters is approximated by a normal on the log scale, and the zone tables can update both. The sampled import fraction leaves out the joint model's change in intensity at detection. We assume the gravity form, with its decay and destination weights fitted to the zone counts, describes movement between zones, with no mobility data to check it against. Straight-line distance stands in for the roads, the lake and the international border that carry movement. The zones that take innovations depend on the data and can differ between cut-offs.
Model: bvd_zone
@model function bvd_zone(
zd;
region_sd_prior = truncated(Normal(0, 0.3); lower = 0),
region_halflife_prior = LogNormal(log(42), 0.6),
severity_sd_prior = truncated(Normal(0, 0.15); lower = 0),
mixing_within_prior = Beta(1, 20),
mixing_departure_prior = truncated(Normal(0, 0.5); lower = 0),
mixing_decay_prior = LogNormal(0, 1),
mixing_destination_prior = truncated(Normal(0, 0.5); lower = 0),
offset_prior = Normal(0, 1),
forecast::Union{Nothing, ForecastHorizon} = nothing
)
nz = size(zd.counts, 1)
np = length(zd.patch_ranges)
K = length(zd.knots)
H = horizon_days(forecast)
zf = get(zd, :forecast, nothing)
H == 0 || (zf !== nothing && zf.horizon == H) || error(
"bvd_zone: a $H-day forecast needs zone inputs built with the " *
"parent's forecast over the same horizon."
)
## Mixing needs the kernel blocks and the province model's own flows;
## without them the zones stay inside their own boundaries.
mix_on = zd.mixing !== nothing
z_w ~ product_distribution(fill(offset_prior, nz))
σ_level ~ region_sd_prior
dims = deviation_knot_dims(zd.patch_ranges, zd.walking)
z_level ~ product_distribution(fill(offset_prior, dims.level))
δ_halflife ~ region_halflife_prior
## Every scale below takes its prior from the province posterior.
pp = zd.parent_priors
## One drift scale per patch, as the province model gives each patch its
## own, on the scale the province model estimated between provinces.
σ_δ ~ product_distribution(
fill(LogNormal(pp.drift_sd[1], pp.drift_sd[2]), np)
)
## The death composition carries its own concentration.
ρ ~ Beta(pp.rho[1], pp.rho[2])
ρ_death ~ Beta(pp.rho_death[1], pp.rho_death[2])
## Relative ascertainment on the cases and relative fatality on the
## deaths, each partially pooled within its patch on the scale the
## province model estimated between provinces.
σ_ascertainment ~ LogNormal(pp.ascertainment_sd[1], pp.ascertainment_sd[2])
n_contrast = relative_multiplier_dims(zd.patch_ranges)
z_ascertainment ~ product_distribution(fill(offset_prior, n_contrast))
## Deaths per infection are taken as near-uniform across the zones of a
## patch, which is what lets the death composition pin the incidence
## split and the case composition identify ascertainment as the
## residual. The prior is tight and fixed rather than inherited. Its
## scale is on the logit scale, where a shift `s` moves the log ratio by
## about `(1 - CFR) s`, so 0.15 is about 0.1 on the log scale at the prior
## mean ratio of 0.33, as for the provinces.
σ_severity ~ severity_sd_prior
z_severity ~ product_distribution(fill(offset_prior, n_contrast))
## Sampled only when used, or they would be prior-only dimensions.
n_drift = dims.drift * (K - 1)
if n_drift > 0
z_drift ~ product_distribution(fill(offset_prior, n_drift))
else
z_drift = Float64[]
end
if mix_on
## Within-patch spill, with its own prior. The between-patch flows
## are the province model's at the shared draw `η`. `τ_mix` is how
## far one origin may depart from the shared level, on the logit
## scale.
ε_within ~ mixing_within_prior
τ_mix ~ mixing_departure_prior
z_mix ~ product_distribution(fill(offset_prior, nz))
## The gravity decay, and log weights centred within each patch, so
## both move only the split over a patch's zones.
γ_zone ~ mixing_decay_prior
σ_destination ~ mixing_destination_prior
z_destination ~ product_distribution(fill(offset_prior, n_contrast))
ω_destination = σ_destination .*
(zd.mixing.gravity.destination_basis * z_destination)
blocks = zone_gravity_blocks(zd.mixing.gravity, γ_zone, ω_destination)
else
ε_within = τ_mix = z_mix = nothing
blocks = nothing
end
## The shared quantity, whitened, as the docstring's "shared quantity"
## section describes it.
n_meld = zd.meld_d
if n_meld > 0
η ~ product_distribution(fill(offset_prior, n_meld))
else
η = Float64[]
end
## Past the cut-off the grid, the delays and the shared quantity run on
## over the horizon; the fitted days are unchanged.
zx = H == 0 ? zd :
merge(
zd, (;
zf.I_bar, zf.force_pre, zf.infections_pre, zf.interp,
zf.report_bin, zf.death_bin, zf.mixing,
)
)
e_mix = size(zd.meld_epsilon_rows, 1) > 0 ?
zone_parent_epsilon(zd.meld_epsilon_rows, η) : nothing
## The draw's generation interval and delays, and every term built on
## them, on the grid the model runs over.
delays = if n_meld > 0 && size(zd.meld_delay_rows, 1) > 0
θ_delay = zone_delay_parameters(zd, η)
delay_parameters_zone := θ_delay
zone_delay_terms(
zx.I_bar, zone_delay_pmfs(θ_delay), zd.t0, zd.days,
zd.patch_of_zone; future = H > 0 ? zd.n : nothing
)
else
nothing
end
if H > 0 && zf.meld_d_future > 0
η_future ~ product_distribution(fill(offset_prior, zf.meld_d_future))
scale = zone_parent_scale(
zf.meld_weights, zf.meld_L, vcat(η, η_future), np, zd.n + H
)
elseif H > 0
scale = n_meld > 0 ?
zone_parent_scale(zf.meld_weights, zf.meld_L, η, np, zd.n + H) :
nothing
else
scale = n_meld > 0 ?
zone_parent_scale(zd.meld_weights, zd.meld_L, η, np, zd.n) :
nothing
end
def = zone_deformation(zx, scale, e_mix, delays, blocks)
## The correlation of two zones a reference distance apart, the prior
## taken from the province model's own learned correlation between its
## patches at the distance between their population centres.
on = !isempty(zd.zone_distances)
if on
ρ_corr ~ Beta(pp.correlation[1], pp.correlation[2])
else
ρ_corr = nothing
end
## The province model's deviation construction
## ([`deviation_knots`](@ref)), with one group per patch and the zones of
## a patch as its units.
Kf = H == 0 ? 0 : zf.n_future_knots
if Kf > 0 && dims.drift > 0
z_drift_future ~ product_distribution(
fill(offset_prior, dims.drift * Kf)
)
z_drift_all = vcat(z_drift, z_drift_future)
else
z_drift_all = z_drift
end
terms = _zone_draw_terms(
zd, (;
z_w, σ_level, z_level, δ_halflife, σ_δ, z_drift = z_drift_all,
ρ_corr, ε_within, τ_mix, z_mix,
), K + Kf
)
if on
correlation_reference_zone := ρ_corr
correlation_length_zone := terms.ℓ
end
w0, ε_mix = terms.w0, terms.ε
δ_knots = H == 0 ? terms.δ_knots : terms.δ_knots[:, 1:K]
fw = zone_forward(zx, terms.δ_knots, w0, ε_mix, def)
asc = relative_multiplier(
z_ascertainment, σ_ascertainment, zd.multiplier_basis
)
zone_ascertainment_sd := σ_ascertainment
zone_ascertainment_relative := asc
## The same multiplier against the national average rather than the
## zone's own province: the province model's contrast times this one.
## It cancels in the composition above and is reported, not fitted.
zone_ascertainment_national := zd.province_ascertainment .* asc
@addlogprob! zone_composition_logpdf(
zd.counts, fw.increments .* asc,
zd.cell_patch, zd.cell_vintage, zd.cell_total, zd.cell_const,
zd.patch_ranges, _zone_kappa(ρ)
)
## The allocated deaths of every vintage, through the
## infection-to-confirmed-death delay rather than the case delay.
D = zone_binned_increments(def.death_bin, fw.infections, fw.pre)
## Relative fatality on the logit scale against the province ratio, so
## each zone's ratio is a probability and a zero contrast is the
## province's. Deaths scale with the ratio, so the multiplier on the
## shares is the zone ratio over the province one, at the province
## model's posterior-mean ratio.
sev_logit = relative_contrast(
z_severity, σ_severity, zd.multiplier_basis
)
sev = logistic.(zd.province_cfr_logit .+ sev_logit) ./
logistic.(zd.province_cfr_logit)
zone_severity_sd := σ_severity
zone_severity_log_odds := sev_logit
zone_severity_relative := sev
zone_severity_national := zd.province_severity .* sev
@addlogprob! zone_composition_logpdf(
zd.death_counts, D .* sev,
zd.death_cell_patch, zd.death_cell_vintage,
zd.death_cell_total, zd.death_cell_const, zd.patch_ranges,
_zone_kappa(ρ_death)
)
nd = zd.n - zd.t0 + 1
cum = _zone_cumulative_infections(
view(fw.infections, 1:nd, :), w0, zd.patch_ranges,
def.infections_pre
)
R_T_zone := _zone_rt_at(fw.infections, fw.forces, cum, nd, zd.rt_floor)
parent_eta_zone := η
parent_patch_T_zone := def.I_bar[:, zd.n]
if H > 0
forecast_zone ~ to_submodel(
_zone_forecast_counts(
zd, zf, fw, zone_binned_increments(
delays === nothing ? zf.report_future :
delays.report_future,
fw.infections, fw.pre
), asc, ρ, nd
), false
)
end
delta_knots_zone := vec(δ_knots)
delta_T_zone := δ_knots[:, K]
share_T_zone := fw.shares[nd, :]
share_start_zone := w0
share_knots_zone := vec(_zone_shares_at_knots(fw.shares, zd.knots, zd.t0))
region_sd_zone := σ_level
region_drift_sd_zone := σ_δ
region_halflife_zone := δ_halflife
composition_rho_zone := ρ
composition_rho_death_zone := ρ_death
if mix_on
mixing_epsilon_zone := ε_mix
mixing_within_zone := ε_within
mixing_departure_zone := τ_mix
mixing_decay_zone := γ_zone
mixing_destination_sd_zone := σ_destination
mixing_destination_zone := ω_destination
import_share_T_zone := [
fw.imports[nd, z] / max(fw.infections[nd, z], eps(Float64))
for z in 1:nz
]
end
return (;
shares = fw.shares, forces = fw.forces,
infections = fw.infections, increments = fw.increments,
δ_knots, w0, cum,
)
endModel fitting and evaluation
Fitting the models
We sample with NUTS (Hoffman and Gelman, 2014) and Mooncake (Tebbutt and Ge, 2024) reverse-mode automatic differentiation. Each chain starts from the first of a batch of prior draws whose log joint density is at or above the batch median.
Every fit uses the same sampler settings. Each runs two chains of 1000 post-warmup draws after 750 adaptation steps, at a target acceptance probability of 0.8 and a maximum tree depth of 10.
R-hat sets the spread within each chain against the spread across chains, and a value near one says the chains agree. The bulk effective sample size is the number of independent draws the chains are worth, and we report it for the parameter where it is lowest. A divergent transition is a step the sampler could not take accurately.
We summarise each quantity by its equal-tailed 30%, 60% and 90% credible intervals, or by the 90% interval alone in the comparison tables. Shares, ranks and probabilities are computed draw by draw, so they carry the correlation between provinces.
No-onward-transmission counterfactual
To bound the deaths already committed at the cut-off, we project the deaths that would still occur if all transmission stopped on the report date. Every infection present by the cut-off still dies with probability CFR. The committed future deaths are the CFR-weighted cumulative infection count net of the deaths already expected,
Delay-corrected confirmed case-fatality ratio
The case-fatality ratio above is the onset-level CFR, the share of symptomatic infections that die. The naive confirmed ratio, the cumulative confirmed deaths over the cumulative confirmed cases, is biased low in real time, because a case confirmed close to the cut-off has not yet had time to die.
We report a delay-corrected confirmed CFR following Nishiura et al. (2009). Each day of confirmed-case incidence in the denominator is weighted by the probability that a case confirmed that day, if it is going to die, has had its death confirmed by the cut-off:
with
One-week-ahead forecast
Forecasts are drawn from the fitted model run past the cut-off, with each later day an observation that is missing. Each posterior draw keeps its fitted parameters and draws the missing observations from the model. The renewal, every delay and ascertainment, and each stream's own likelihood then produce the future counts, so the forecast carries parameter and observation uncertainty. Up to the cut-off the model and its density are unchanged, so the forecast needs no refit.
The reproduction number continues its weekly walk with fresh innovations at its fitted step size, the intervention ramp carries on, and the walks for the non-BVD background and the bed capacity continue the same way. The test positivity and the onset hazard's calendar effect and ascertainment are held at their last fitted values. The model defines them only over the laboratory windows and the triangle's grid, and already holds them flat beyond those up to the cut-off. Exports accrue at the full modelled rate every future day, and the onset figure's increment is drawn once per future vintage on its total.
We forecast the reported cases and suspected deaths, the laboratory-confirmed cases and confirmed deaths, the recovered total, the patients in isolation and the beds. A future day has no published analysed count, so its confirmed cases take the negative binomial the model uses for confirmed windows without one. The reported case and suspected death streams are no longer published, so their forecasts extend the last published cumulative total. Exports are forecast only for the per-stream comparison. The results are in the one-week-ahead forecast results.
The occupied beds, admissions and in-care flows are the fitted treatment model run forward, so the latent stock is not capped. The national occupancy is drawn from the negative binomial censored at the national beds, and the national admissions from the uncensored negative binomial. The in-care deaths and rule-outs are drawn nationally around the modelled flows. We also report the modelled bed demand and its excess over the national beds.
With province care data each national draw is split across the provinces by the fitted province split, on the provinces' demand for the occupancy and on their modelled admissions for the admissions. Each split carries its fitted overdispersion, so the provinces add up to the national forecast and the national spread is the fitted one. Each province's beds are its share of the capacity walk past the cut-off.
Each release saves its forecast as an asset so it can later be scored against what is observed. For a release that did not store one, the forecast is reconstructed by re-running that release's own model code on its own data and fit, in the same archive schema. Dependencies are re-resolved at current versions, so a reconstruction is not an exact rebuild. Reconstructed forecasts cover every release that carried a forecast, each with the streams its own model forecast. They are published as a separate backfill release and scored with the stored ones in forecast scoring across releases.
Symptom-onset nowcast and forecast
The symptom-onset reporting triangle separates a nowcast of cases whose symptoms have begun but whose report has not yet arrived from a forecast of cases whose symptoms have not yet begun. The separation comes from the same cumulative reported proportion
At the cut-off
Splitting
Onsets past the cut-off come from the renewal run past the cut-off, as for the other streams. The calendar-time effect
Its scale is that of a correction read off two bars, plus the calibration error of each figure's total,
We score the sum of the two terms, the increment the triangle should add over the horizon. Every vintage rereads the whole figure, so its printed total moves with the read error on each bar and can fall between vintages.
Province forecast
The province forecast is drawn from the same run of the fitted patch model past the cut-off. Each province's deviation from the national walk reverts at the fitted half-life and takes fresh innovations with the fitted cross-province correlation. The provinces keep exchanging infections through the importation kernel at each origin's fitted intensity.
Each week's national forecast of confirmed cases and deaths is split across the provinces by the fitted province compositions. The split carries each province's onsets through the national delays and weights them by its relative ascertainment and, for deaths, its relative case-fatality ratio. The patients in isolation, the beds and the admissions are forecast by province as above, so every province forecast adds up to the national one.
The symptom-onset curve is national only, so there is no province nowcast. Each release archives the projection with its method recorded, and only forecasts of the current method are scored.
Health-zone forecast
The one-week zone forecast is drawn from the fitted zone model run a week past the cut-off, as the other forecasts are, with each draw at its fitted parameters. The sampled joint quantities of Equation (56) are extended over the forecast week. The multivariate normal is fitted to each joint-model draw's log weekly patch infections over the fitted weeks and over the forecast week of the same draw's forecast, with the fitted block of its Cholesky factor held fixed:
The forecast week is then the joint model's forecast conditional on the draw's fitted patch trajectory, and the fitted model is unchanged. Over the forecast week the mean import log odds
Each draw pairs with a joint-model forecast draw chosen at random and splits that draw's forecast confirmed cases in each patch over its zones by the Dirichlet-multinomial of Equation (64) at
The results report this at
Forecast-versus-frozen evaluation
We freeze the data to about one week before the current cut-off, re-fit, forecast one week ahead from the frozen model in the same way, and compare that projection with the counts observed by the current cut-off. Every re-fit uses the headline sampler settings. The one-week-back re-fit keeps the province patches, and the re-fits at earlier cut-offs are single-population. The same frozen re-fit procedure is used to compare against McCabe et al. at the cut-offs they used.
Forecast scoring against a persistence baseline
Every forecast above, and every stored forecast from a past release, is scored with the continuous ranked probability score (CRPS), on the count scale and on a log scale. We report the score split into the predictive spread and the cost of reading high or low. We also report the share of observations inside the 50% and 90% predictive intervals, and a bias running from
each mean taken over the forecasts both fits scored.
Each count stream is scored on its increment over the forecast window, and bed occupancy on its level. A stream is scored only where its own reporting covers the window, from the day it was first reported to the day it was last updated. On the two confirmed streams, a reported step that is mostly a retrospective integration of harmonised provincial records has that backfill removed from both the target and the baseline.
Each forecast is also compared against a persistence baseline built from the same stream. Write the vintages recorded by the day the forecast was made as dates
and takes its spread from the record's own first differences, each rescaled to a one-day step and entered with both signs,
Here
so before the floor it has mean
The baseline reads only the vintages recorded by the day the forecast was made, from the archived data snapshot the release was built on, so no later correction or backfill reaches it. This holds exactly for a forecast made at a release's own cut-off. The frozen re-fits forecast from fixed historical cut-offs reused across later releases, so their snapshot can post-date the forecast by weeks and already hold a later correction.
A baseline is drawn only where the stream's own record covers the window it is centred on. For a count stream that is the horizon-length window ending on the day the forecast was made, and for occupancy it is that day alone. The earliest releases archived their cut-off totals without the dated vintage record, so their forecasts have no baseline either. Neither case is scored, so those forecasts keep their own scores and carry no relative skill.
The health-zone split is scored patch by patch with the multinomial log score of the observed zone split of the patch's weekly total, and the zone model's score is the log of its draw-averaged multinomial mass at the forecast shares. Two persistence rules give the baseline split, each with a pseudo-count of 0.5 per zone. Share persistence takes the cumulative zone shares at the cut-off, and naive persistence takes the zone split of the last seven days. The patch total is scored with the CRPS against a naive persistence total, the last seven days' count with negative-binomial noise at dispersion 5. A patch with no observed case over the week is not scored.
Point prevalence
Point prevalence is the number of people infected and still in the community on a given day. Let
A person is infected but not yet symptomatic while the incubation period exceeds
The probability of being symptomatic and undetected
Each posterior draw of the joint fit has its own infections and delays, so the intervals include the uncertainty in both. Rates are per 100,000 residents, from the province populations and the WorldPop zone populations.
For the zones we apply the same weights to the daily infections of the health-zone model, with each zone draw's own incubation, reporting and death delays. The health-zone model does not estimate the treatment-centre stay, so zone draw
Comparison with published estimates
The estimates are checked against those of McCabe and others (2026). The table sets out what the two share and what differs, each row linking to the section that specifies it.
| Component | McCabe and others (2026) | This work |
|---|---|---|
| Infection process | Continuous-time closed forms | Discrete-time meta-population renewal on a daily grid, provinces coupled by importation, national incidence their sum |
| Reproduction number | One constant exponential growth rate | A weekly log-scale random walk from |
| Seeding and growth | Start fixed from a single seed | Two-phase seeding, a cryptic exponential phase floored from below by the genetic bound |
| Parameter treatment | Each fixed, a set of scenarios reported | Priors on the reproduction number, case-fatality ratio, delays, traveller volume and dispersion, all sampled in one posterior |
| Onset-to-death delay | Isiro 2012 point estimate of Rosello and others (2015) | Bayesian reanalysis of the same line list (Funk and Abbott, 2026), so the delay carries uncertainty |
| Other delays | Fixed | Sampled from priors centred on published Ebola estimates, each double interval censored (Charniga et al., 2024) |
| Data streams | Uganda export cases and deaths | Those plus DRC suspected cases and deaths, confirmed cases and deaths, laboratory volumes, isolation and treatment-centre counts, recoveries, the symptom-onset curve and the province tables |
| Likelihood scale | One cumulative total | Between-vintage increments across successive situation reports, which sharpens |
| Ascertainment | Not modelled | Outbreak size and each system's reporting fraction estimated jointly |
| Projections | None | A no-onward-transmission counterfactual and a one-week-ahead forecast of every stream |
The estimates themselves are set against the published scenarios in the comparison with McCabe et al., matched at the cut-off each scenario was computed, and a frozen forward projection is set against the Chamla et al. (2026) confirmed-case projection in the comparison with Chamla et al..