Probability integral transformation (data.frame version)
Source:R/class-forecast-quantile.R, R/class-forecast-sample.R, R/get-pit.R
get_pit.RdCompute the Probability Integral Transformation (PIT) for validated forecast objects.
Usage
# S3 method for class 'forecast_quantile'
get_pit(forecast, by, ...)

# S3 method for class 'forecast_sample'
get_pit(forecast, by, n_replicates = 100, ...)

get_pit(forecast, by, ...)

# Default S3 method
get_pit(forecast, by, ...)
Arguments
- forecast
A forecast object (a validated data.table with predicted and observed values, see
as_forecast()).- by
Character vector with the columns according to which the PIT values shall be grouped. If you e.g. have the columns 'model' and 'location' in the input data and want to have a PIT histogram for every model and location, specify
by = c("model", "location").- ...
Currently unused. You cannot pass additional arguments to scoring functions via
.... See the Customising metrics section below for details on how to usepurrr::partial()to pass arguments to individual metrics.- n_replicates
The number of draws for the randomised PIT for discrete predictions. Will be ignored if forecasts are continuous.
References
Sebastian Funk, Anton Camacho, Adam J. Kucharski, Rachel Lowe, Rosalind M. Eggo, W. John Edmunds (2019) Assessing the performance of real-time epidemic forecasts: A case study of Ebola in the Western Area region of Sierra Leone, 2014-15, doi:10.1371/journal.pcbi.1006785
Examples
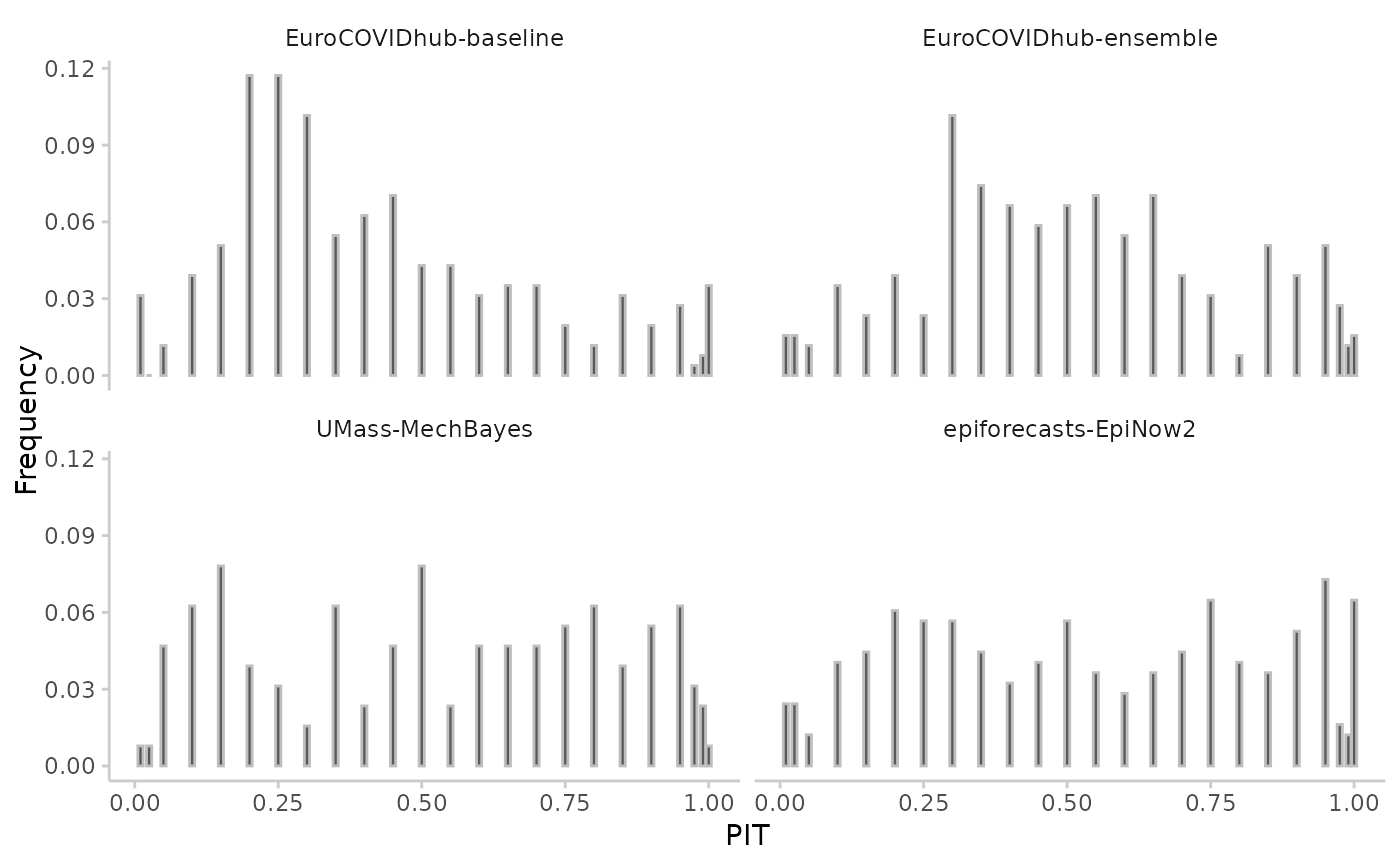
example <- as_forecast_sample(example_sample_continuous)
#> ℹ Some rows containing NA values may be removed. This is fine if not
#> unexpected.
result <- get_pit(example, by = "model")
plot_pit(result)
 # example with quantile data
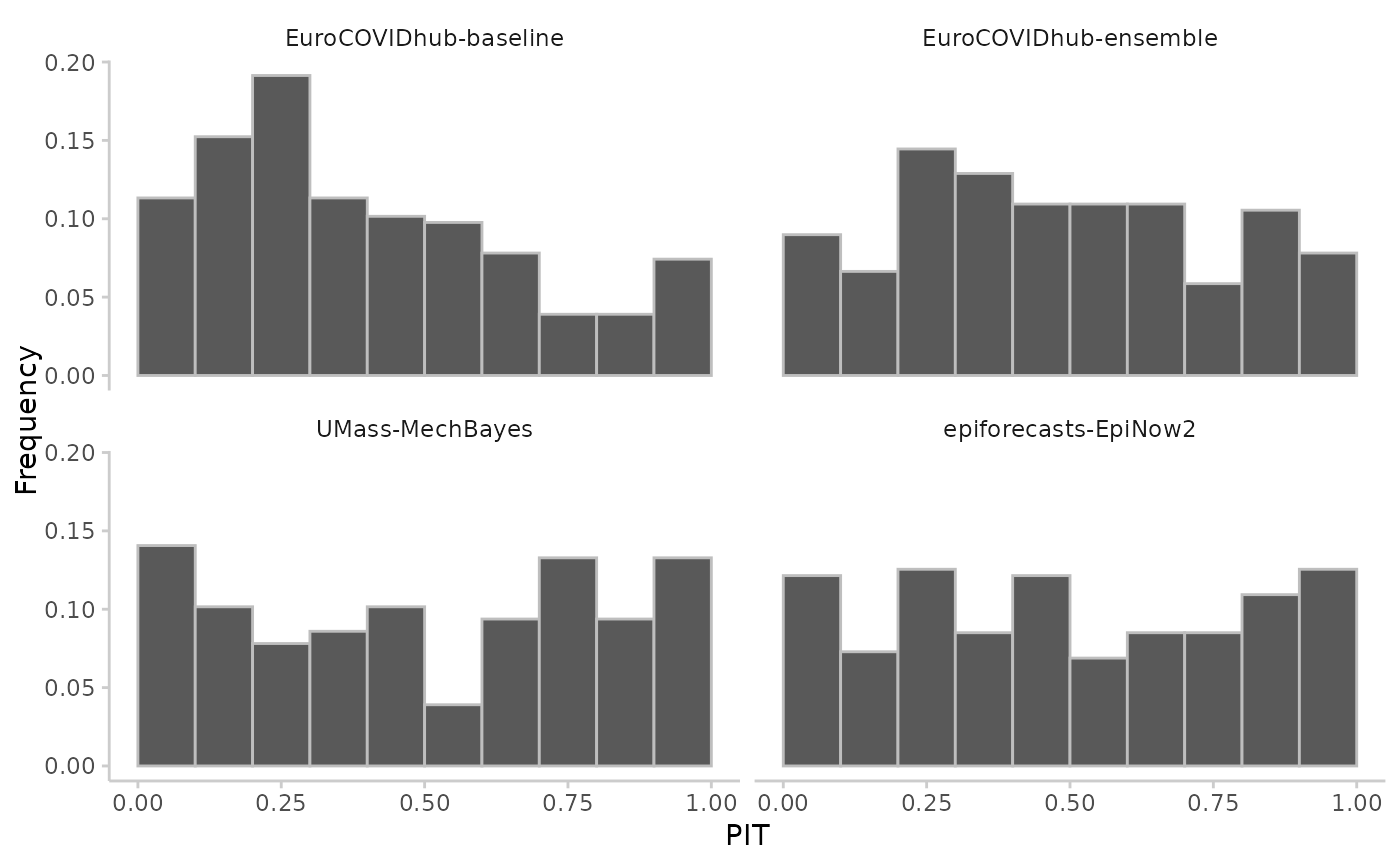
example <- as_forecast_quantile(example_quantile)
#> ℹ Some rows containing NA values may be removed. This is fine if not
#> unexpected.
result <- get_pit(example, by = "model")
plot_pit(result)
# example with quantile data
example <- as_forecast_quantile(example_quantile)
#> ℹ Some rows containing NA values may be removed. This is fine if not
#> unexpected.
result <- get_pit(example, by = "model")
plot_pit(result)