There are several as_forecast_<type>() functions to process and validate
a data.frame (or similar) or similar with forecasts and observations. If
the input passes all input checks, those functions will be converted
to a forecast object. A forecast object is a data.table with a
class forecast and an additional class that depends on the forecast type.
Every forecast type has its own as_forecast_<type>() function.
See the details section below for more information
on the expected input formats.
The as_forecast_<type>() functions give users some control over how their
data is parsed.
Using the arguments observed, predicted, etc. users can rename
existing columns of their input data to match the required columns for a
forecast object. Using the argument forecast_unit, users can specify the
the columns that uniquely identify a single forecast (and remove the others,
see docs for the internal set_forecast_unit() for details).
The following functions are available:
Arguments
- data
A data.frame (or similar) with predicted and observed values. See the details section of
as_forecast()for additional information on required input formats.- forecast_unit
(optional) Name of the columns in
data(after any renaming of columns) that denote the unit of a single forecast. Seeget_forecast_unit()for details. IfNULL(the default), all columns that are not required columns are assumed to form the unit of a single forecast. If specified, all columns that are not part of the forecast unit (or required columns) will be removed.- observed
(optional) Name of the column in
datathat contains the observed values. This column will be renamed to "observed".- predicted
(optional) Name of the column in
datathat contains the predicted values. This column will be renamed to "predicted".
Value
Depending on the forecast type, an object of the following class will be returned:
forecast_binaryfor binary forecastsforecast_pointfor point forecastsforecast_samplefor sample-based forecastsforecast_quantilefor quantile-based forecasts
Forecast types and input formats
Various different forecast types / forecast formats are supported. At the moment, those are:
point forecasts
binary forecasts ("soft binary classification")
nominal forecasts ("soft classification with multiple unordered classes")
Probabilistic forecasts in a quantile-based format (a forecast is represented as a set of predictive quantiles)
Probabilistic forecasts in a sample-based format (a forecast is represented as a set of predictive samples)
Forecast types are determined based on the columns present in the input data. Here is an overview of the required format for each forecast type:
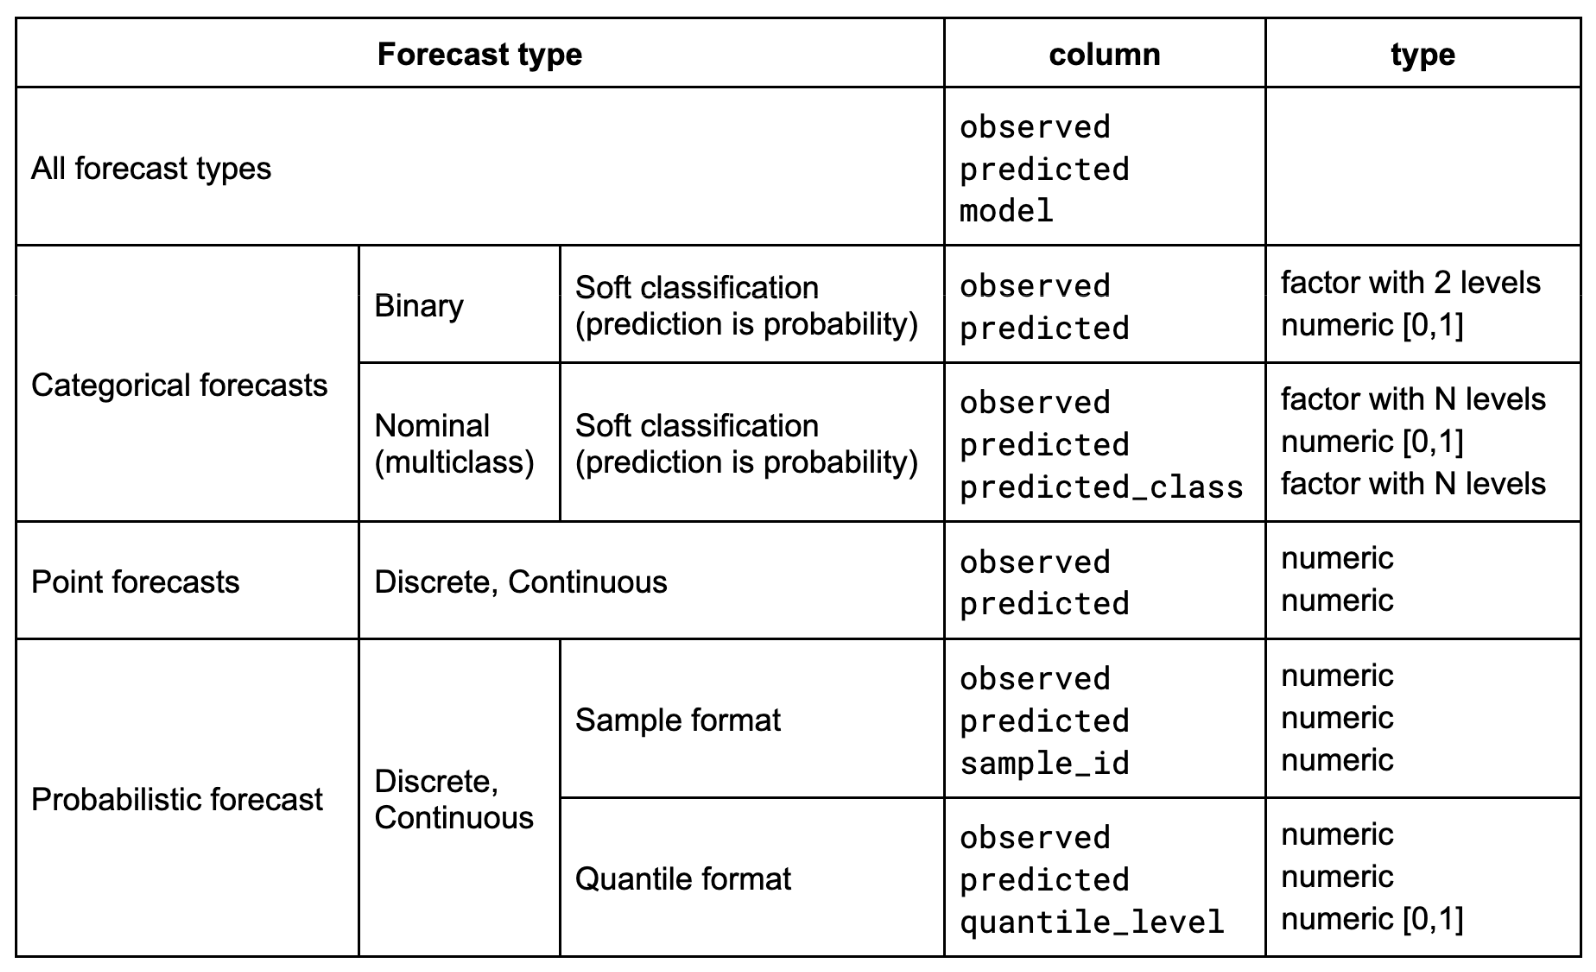
All forecast types require a data.frame or similar with columns observed
predicted, and model.
Point forecasts require a column observed of type numeric and a column
predicted of type numeric.
Binary forecasts require a column observed of type factor with exactly
two levels and a column predicted of type numeric with probabilities,
corresponding to the probability that observed is equal to the second
factor level. See details here for more information.
Nominal forecasts require a column observed of type factor with N levels,
(where N is the number of possible outcomes), a column predicted of type
numeric with probabilities (which sum to one across all possible outcomes),
and a column predicted_label of type factor with N levels, denoting the
outcome for which a probability is given. Forecasts must be complete, i.e.
there must be a probability assigned to every possible outcome.
Quantile-based forecasts require a column observed of type numeric,
a column predicted of type numeric, and a column quantile_level of type
numeric with quantile-levels (between 0 and 1).
Sample-based forecasts require a column observed of type numeric,
a column predicted of type numeric, and a column sample_id of type
numeric with sample indices.
For more information see the vignettes and the example data
(example_quantile, example_sample_continuous, example_sample_discrete,
example_point(), example_binary, and example_nominal).
Forecast unit
In order to score forecasts, scoringutils needs to know which of the rows
of the data belong together and jointly form a single forecasts. This is
easy e.g. for point forecast, where there is one row per forecast. For
quantile or sample-based forecasts, however, there are multiple rows that
belong to a single forecast.
The forecast unit or unit of a single forecast is then described by the
combination of columns that uniquely identify a single forecast.
For example, we could have forecasts made by different models in various
locations at different time points, each for several weeks into the future.
The forecast unit could then be described as
forecast_unit = c("model", "location", "forecast_date", "forecast_horizon").
scoringutils automatically tries to determine the unit of a single
forecast. It uses all existing columns for this, which means that no columns
must be present that are unrelated to the forecast unit. As a very simplistic
example, if you had an additional row, "even", that is one if the row number
is even and zero otherwise, then this would mess up scoring as scoringutils
then thinks that this column was relevant in defining the forecast unit.
In order to avoid issues, we recommend setting the forecast unit explicitly,
usually through the forecast_unit argument in the as_forecast()
functions. This will drop unneeded columns, while making sure that all
necessary, 'protected columns' like "predicted" or "observed" are retained.
See also
Other functions to create forecast objects:
as_forecast_binary(),
as_forecast_nominal(),
as_forecast_point(),
as_forecast_quantile(),
as_forecast_sample()
Examples
as_forecast_binary(example_binary)
#> ℹ Some rows containing NA values may be removed. This is fine if not
#>   unexpected.
#> Forecast type: binary
#> Forecast unit:
#> location, location_name, target_end_date, target_type, forecast_date, model,
#> and horizon
#>
#>       location location_name target_end_date target_type forecast_date
#>         <char>        <char>          <Date>      <char>        <Date>
#>    1:       DE       Germany      2021-01-02       Cases          <NA>
#>    2:       DE       Germany      2021-01-02      Deaths          <NA>
#>    3:       DE       Germany      2021-01-09       Cases          <NA>
#>    4:       DE       Germany      2021-01-09      Deaths          <NA>
#>    5:       DE       Germany      2021-01-16       Cases          <NA>
#>   ---
#> 1027:       IT         Italy      2021-07-24      Deaths    2021-07-12
#> 1028:       IT         Italy      2021-07-24      Deaths    2021-07-05
#> 1029:       IT         Italy      2021-07-24      Deaths    2021-07-12
#> 1030:       IT         Italy      2021-07-24      Deaths    2021-07-05
#> 1031:       IT         Italy      2021-07-24      Deaths    2021-07-12
#>                       model horizon predicted observed
#>                      <char>   <num>     <num>   <fctr>
#>    1:                  <NA>      NA        NA     <NA>
#>    2:                  <NA>      NA        NA     <NA>
#>    3:                  <NA>      NA        NA     <NA>
#>    4:                  <NA>      NA        NA     <NA>
#>    5:                  <NA>      NA        NA     <NA>
#>   ---
#> 1027: EuroCOVIDhub-baseline       2     0.250        0
#> 1028:       UMass-MechBayes       3     0.475        0
#> 1029:       UMass-MechBayes       2     0.450        0
#> 1030:  epiforecasts-EpiNow2       3     0.375        0
#> 1031:  epiforecasts-EpiNow2       2     0.300        0
as_forecast_quantile(
  example_quantile,
  forecast_unit = c("model", "target_type", "target_end_date",
                    "horizon", "location")
)
#> ℹ Some rows containing NA values may be removed. This is fine if not
#>   unexpected.
#> Forecast type: quantile
#> Forecast unit:
#> model, target_type, target_end_date, horizon, and location
#>
#> Key: <location, target_end_date, target_type>
#>        observed quantile_level predicted                model target_type
#>           <num>          <num>     <int>               <char>      <char>
#>     1:   127300             NA        NA                 <NA>       Cases
#>     2:     4534             NA        NA                 <NA>      Deaths
#>     3:   154922             NA        NA                 <NA>       Cases
#>     4:     6117             NA        NA                 <NA>      Deaths
#>     5:   110183             NA        NA                 <NA>       Cases
#>    ---
#> 20541:       78          0.850       352 epiforecasts-EpiNow2      Deaths
#> 20542:       78          0.900       397 epiforecasts-EpiNow2      Deaths
#> 20543:       78          0.950       499 epiforecasts-EpiNow2      Deaths
#> 20544:       78          0.975       611 epiforecasts-EpiNow2      Deaths
#> 20545:       78          0.990       719 epiforecasts-EpiNow2      Deaths
#>        target_end_date horizon location
#>                 <Date>   <num>   <char>
#>     1:      2021-01-02      NA       DE
#>     2:      2021-01-02      NA       DE
#>     3:      2021-01-09      NA       DE
#>     4:      2021-01-09      NA       DE
#>     5:      2021-01-16      NA       DE
#>    ---
#> 20541:      2021-07-24       2       IT
#> 20542:      2021-07-24       2       IT
#> 20543:      2021-07-24       2       IT
#> 20544:      2021-07-24       2       IT
#> 20545:      2021-07-24       2       IT