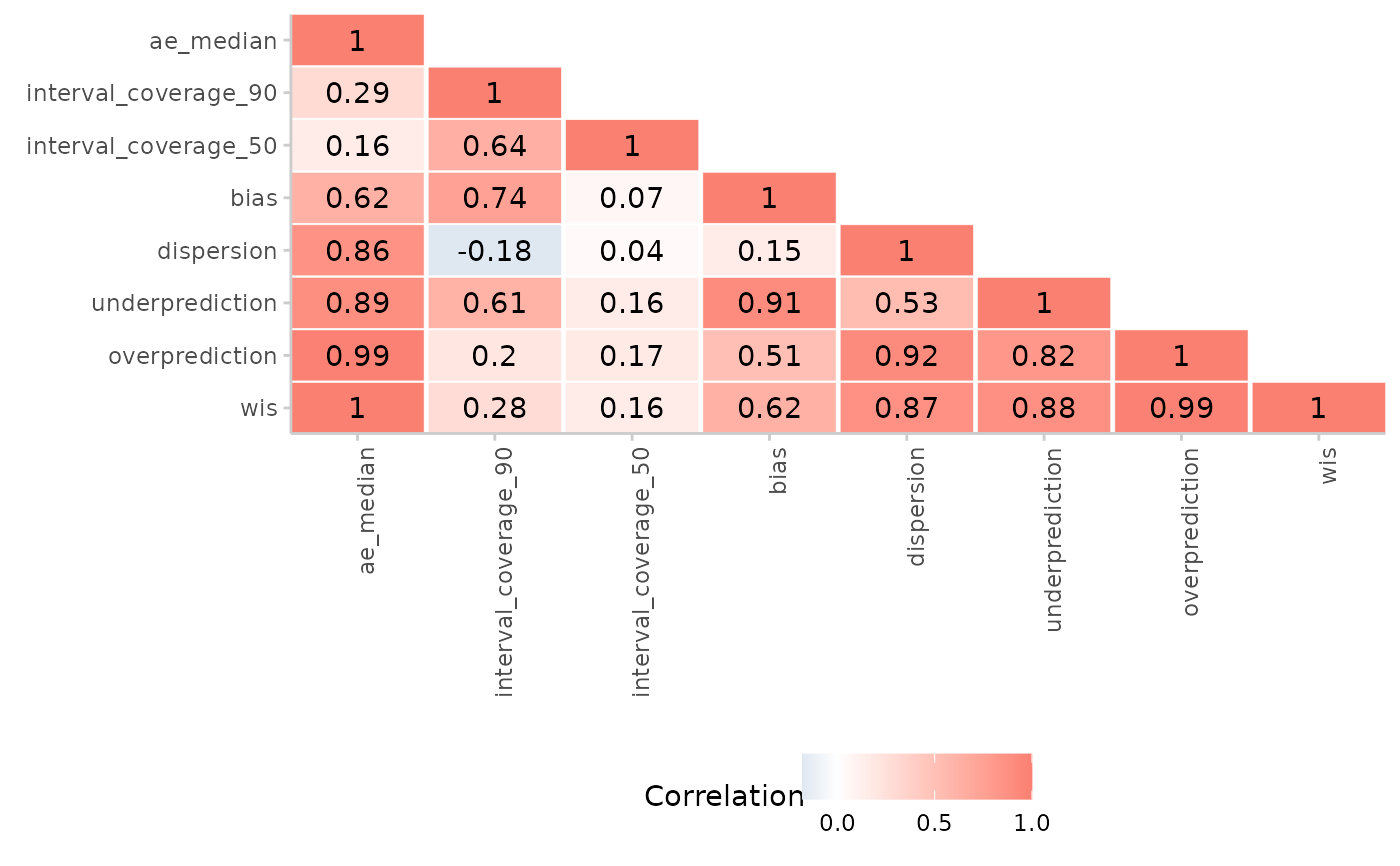
Plots a heatmap of correlations between different metrics.
Arguments
- correlations
A data.table of correlations between scores as produced by
get_correlations().- digits
A number indicating how many decimal places the correlations should be rounded to. By default (
digits = NULL) no rounding takes place.
Value
A ggplot object showing a coloured matrix of correlations between metrics.
A ggplot object with a visualisation of correlations between metrics
Examples
scores <- example_quantile |>
  as_forecast_quantile() |>
  score()
#> ℹ Some rows containing NA values may be removed. This is fine if not
#>   unexpected.
correlations <- scores |>
  summarise_scores() |>
  get_correlations()
plot_correlations(correlations, digits = 2)