Data and participation
Source data and code
Forecast and observed data were sourced from the European COVID-19 Forecast Hub, available to view at https://covid19forecasthub.eu/ . All Hub data are now archived at:
- Github: https://github.com/european-modelling-hubs/covid19-forecast-hub-europe_archive
- Zenodo with DOI: https://doi.org/10.5281/zenodo.13986751
Data for this work were downloaded on 30th May 2023. These data are available in the Github repository for this paper at: https://github.com/epiforecasts/eval-by-method/tree/main/data
The codebase for this paper is publicly available at:
- Github: https://github.com/epiforecasts/eval-by-method
- Zenodo with DOI: https://doi.org/10.5281/zenodo.14903162
Comments and code contributions are welcome - please use Github Issues.
Please cite code using:
- Katharine Sherratt & Sebastian Funk. (2025). epiforecasts/eval-by-method: Zenodo. https://doi.org/10.5281/zenodo.14903162
Study participation
Forecasting teams were recruited to the European Covid-19 Forecast Hub using existing networks and ECDC publicity. Any forecaster was eligible to participate, and there were no selection criteria. All participation was voluntary and unrenumerated. Forecasters contributed a standard set of metadata describing their team and model, and uploaded forecasts weekly. Forecasters were optionally able to express uncertainty by reporting a distribution of up to 23 probabilistic quantiles for each prediction. Forecasts were validated against minimal formatting requirements for quantile intervals and that values were positive integers.
For this study, we collected all forecasts from between 8 March 2021 to 10 March 2023. We excluded forecasts of hospitalisations, which experienced multiple changes in source data during the study period. We excluded forecasts that did not report the full set of 23 quantiles, in order to ensure fair comparison among probabilistic model results. We also excluded the ensemble model created by the Hub team, because it is constructed from the contributed forecasts and so would double-count them. We retained the Hub baseline model: it is an independently specified statistical model, and including it gives a naive reference point against which participant forecasts can be read.
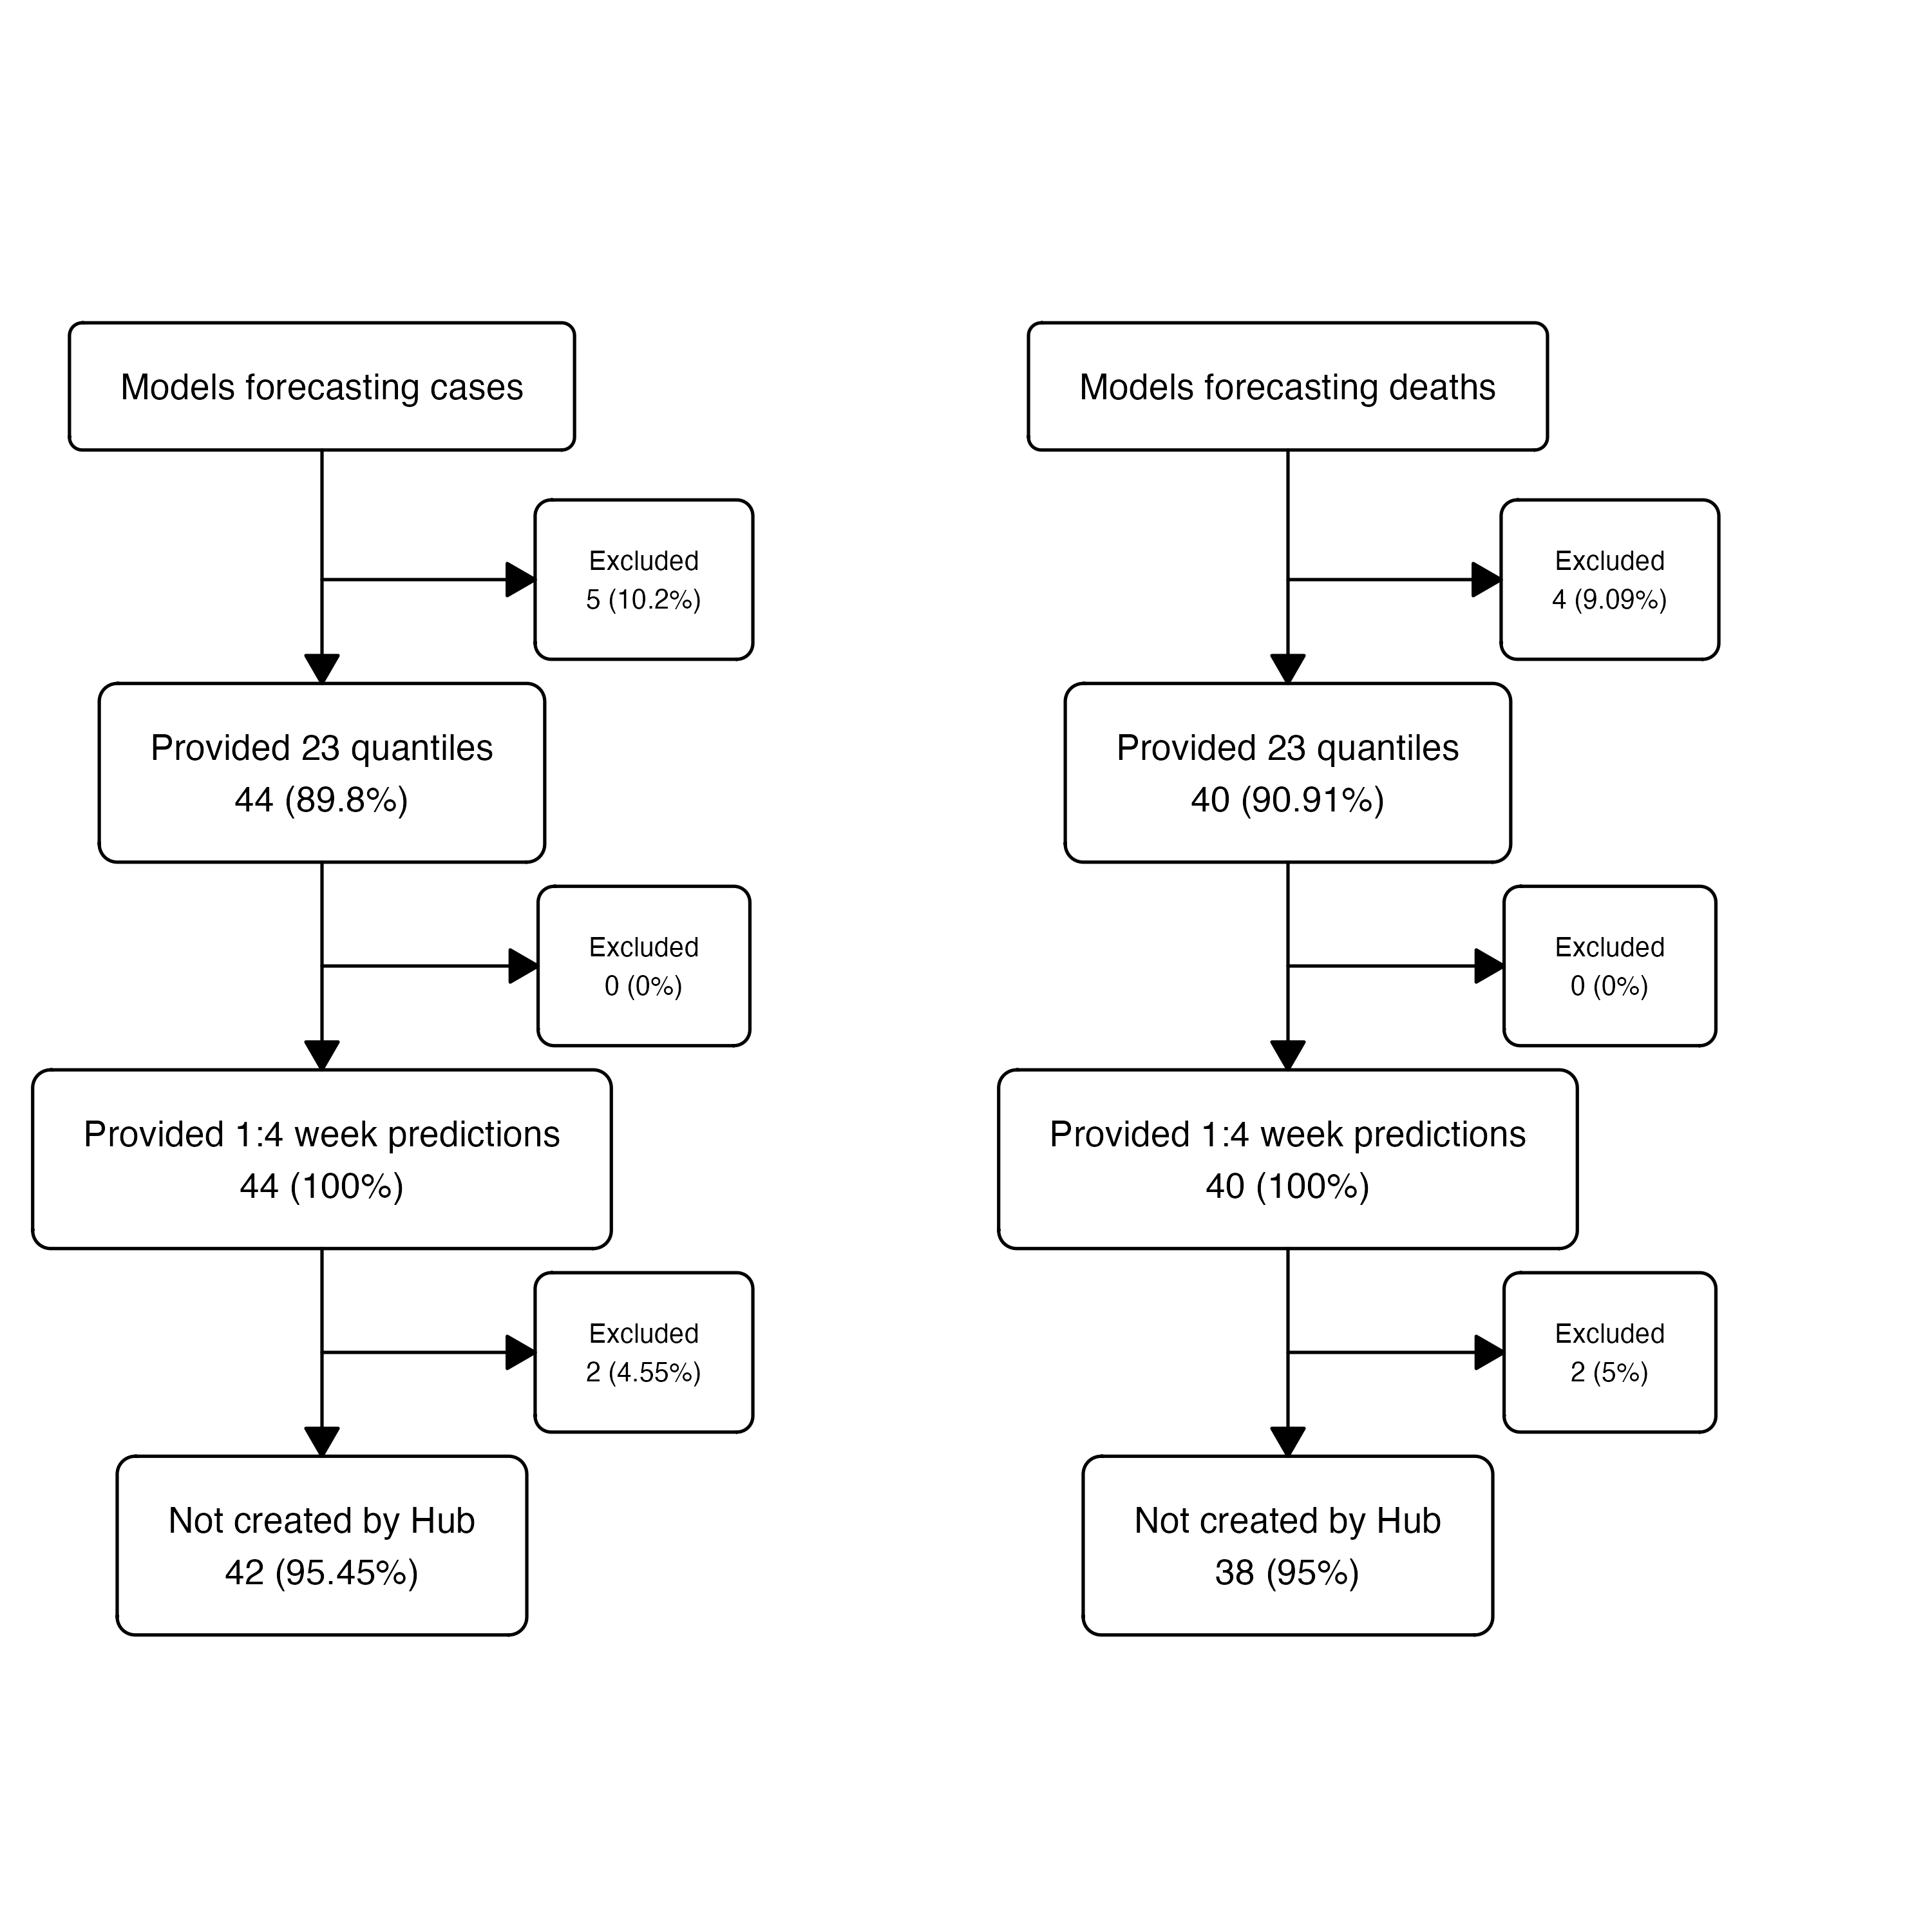
Of 49 models submitting case forecasts during the study period, 43 met these criteria; of 44 submitting death forecasts, 39 did.
Characteristics of contributing models:
| Model | Method | Country Targets | Case forecasts | Death forecasts |
|---|---|---|---|---|
| AMM-EpiInvert | Statistical | Multi-country | 2,788 | |
| CovidMetrics-epiBATS | Statistical | Single-country | 343 | |
| DSMPG-bayes | Semi-mechanistic | Multi-country | 760 | |
| EuroCOVIDhub-baseline | Statistical | Multi-country | 13,082 | 13,040 |
| FIAS_FZJ-Epi1Ger | Mechanistic | Single-country | 264 | 264 |
| GoeWroc-BaseBayes | Semi-mechanistic | Single-country | 12 | |
| HZI-AgeExtendedSEIR | Mechanistic | Single-country | 382 | 382 |
| ICM-agentModel | Agent-based | Single-country | 334 | 334 |
| IEM_Health-CovidProject | Mechanistic | Multi-country | 7,710 | 7,708 |
| ILM-EKF | Semi-mechanistic | Multi-country | 11,998 | 11,961 |
| ITWW-county_repro | Semi-mechanistic | Multi-country | 650 | 600 |
| Imperial-DeCa | Semi-mechanistic | Multi-country | 571 | |
| Imperial-RtI0 | Semi-mechanistic | Multi-country | 571 | |
| Imperial-sbkp | Semi-mechanistic | Multi-country | 571 | |
| JBUD-HMXK | Mechanistic | Multi-country | 1,324 | 1,324 |
| KITmetricslab-bivar_branching | Statistical | Single-country | 8 | |
| Karlen-pypm | Mechanistic | Multi-country | 3,208 | 3,186 |
| LANL-GrowthRate | Semi-mechanistic | Multi-country | 3,692 | 3,696 |
| LeipzigIMISE-SECIR | Mechanistic | Single-country | 16 | 16 |
| MIMUW-StochSEIR | Mechanistic | Single-country | 76 | 76 |
| MIT_CovidAnalytics-DELPHI | Mechanistic | Multi-country | 348 | 500 |
| MOCOS-agent1 | Agent-based | Single-country | 386 | 386 |
| MUNI-ARIMA | Statistical | Multi-country | 10,979 | 11,314 |
| MUNI-LaggedRegARIMA | Statistical | Multi-country | 736 | |
| MUNI-VAR | Statistical | Multi-country | 976 | 976 |
| MUNI_DMS-SEIAR | Mechanistic | Single-country | 224 | 200 |
| PL_GRedlarski-DistrictsSum | Mechanistic | Single-country | 378 | |
| RobertWalraven-ESG | Statistical | Multi-country | 9,190 | 10,465 |
| SDSC_ISG-TrendModel | Statistical | Multi-country | 1,756 | 1,744 |
| UB-BSLCoV | Statistical | Single-country | 96 | 96 |
| UC3M-EpiGraph | Agent-based | Single-country | 94 | |
| ULZF-SEIRC19SI | Mechanistic | Single-country | 249 | 249 |
| UMass-MechBayes | Mechanistic | Multi-country | 5,948 | |
| UMass-SemiMech | Semi-mechanistic | Multi-country | 1,888 | 1,904 |
| UNED-PreCoV2 | Statistical | Single-country | 147 | 147 |
| UNIPV-BayesINGARCHX | Statistical | Multi-country | 426 | |
| USC-SIkJalpha | Mechanistic | Multi-country | 12,900 | 12,688 |
| UpgUmibUsi-MultiBayes | Semi-mechanistic | Single-country | 99 | 99 |
| bisop-seirfilter | Mechanistic | Single-country | 32 | 32 |
| bisop-seirfilterlite | Mechanistic | Multi-country | 336 | 336 |
| epiMOX-SUIHTER | Mechanistic | Single-country | 134 | 134 |
| epiforecasts-EpiExpert | Judgement | Multi-country | 945 | 948 |
| epiforecasts-EpiExpert_Rt | Judgement | Multi-country | 404 | 404 |
| epiforecasts-EpiExpert_direct | Judgement | Multi-country | 394 | 392 |
| epiforecasts-EpiNow2 | Semi-mechanistic | Multi-country | 8,843 | 7,721 |
| epiforecasts-weeklygrowth | Statistical | Multi-country | 5,971 | |
| itwm-dSEIR | Mechanistic | Single-country | 406 | 406 |
| prolix-euclidean | Semi-mechanistic | Multi-country | 800 | 800 |
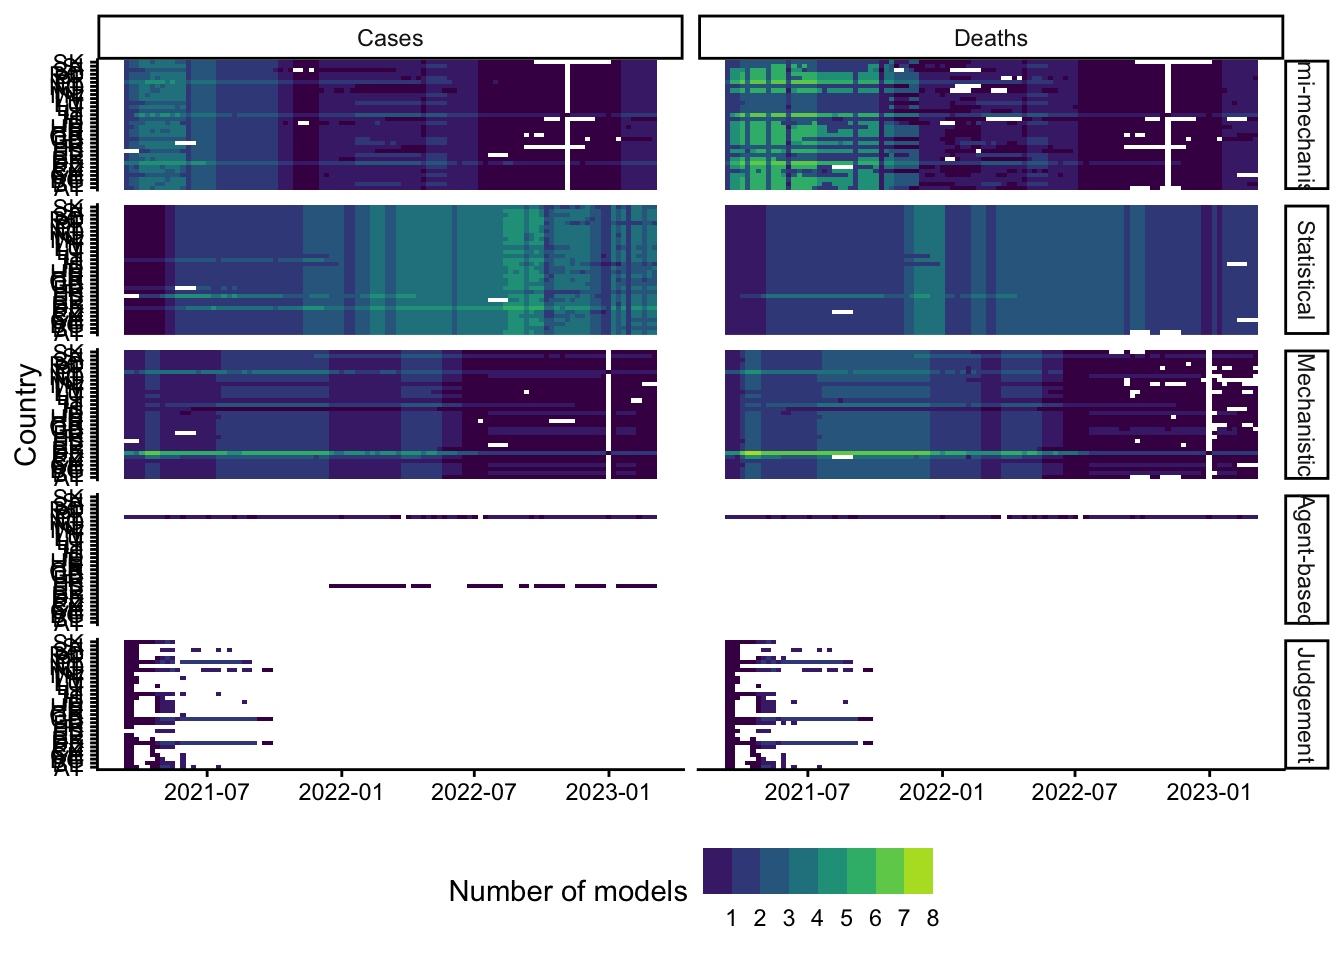
Number of models participating in forecasting 1-week ahead case incidence for each country over the study period.
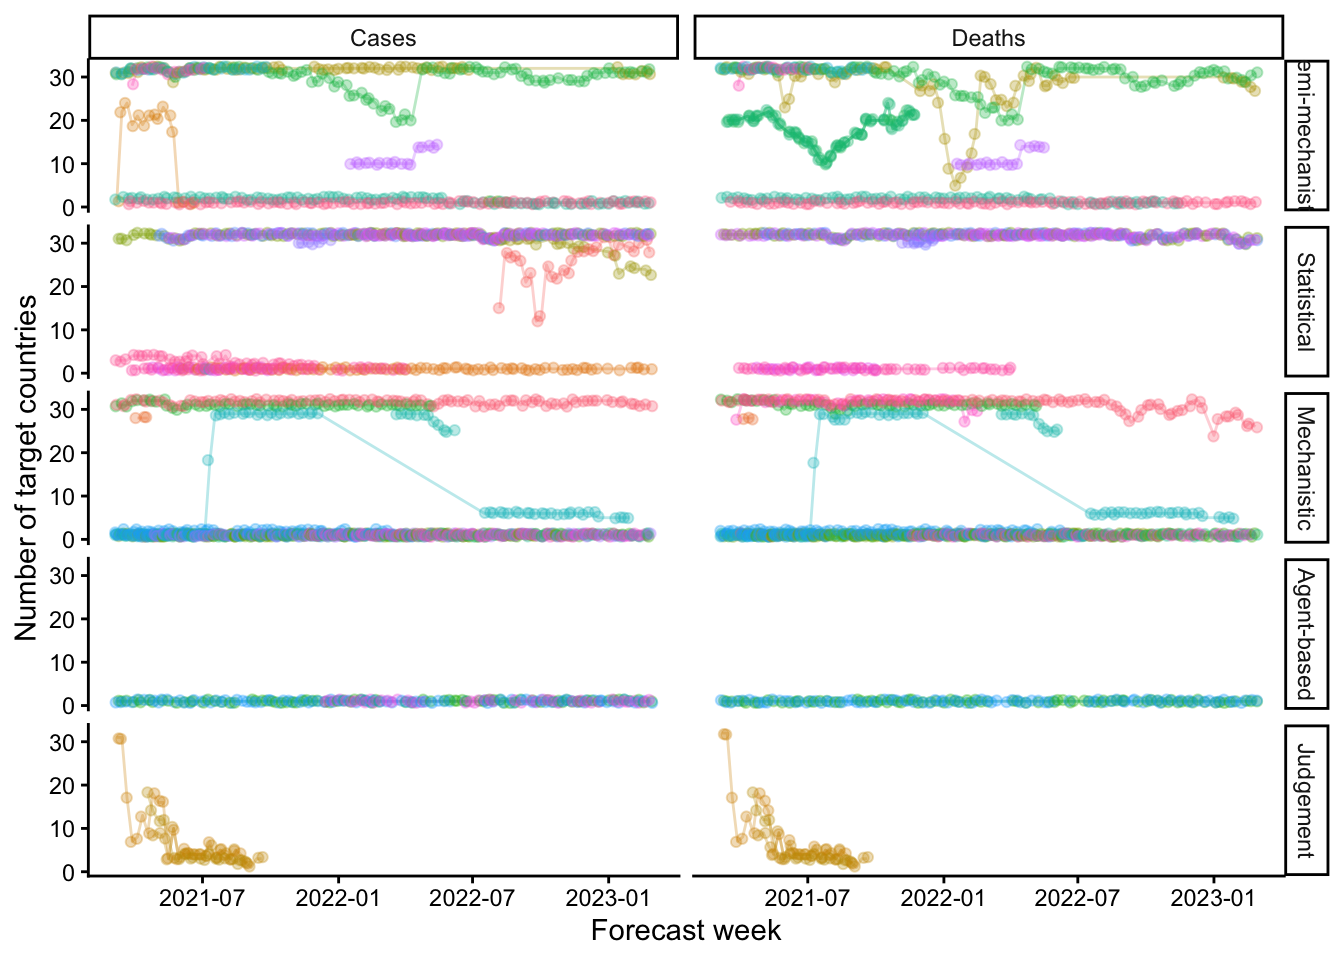
We explored how models selected geographic targets over time. Forecasters both added and removed targets among the set for which they forecast each week. This figure shows number of targets submitted by each model at the 1-week ahead horizon. We noted the same variation for 2-4 week forecasts.
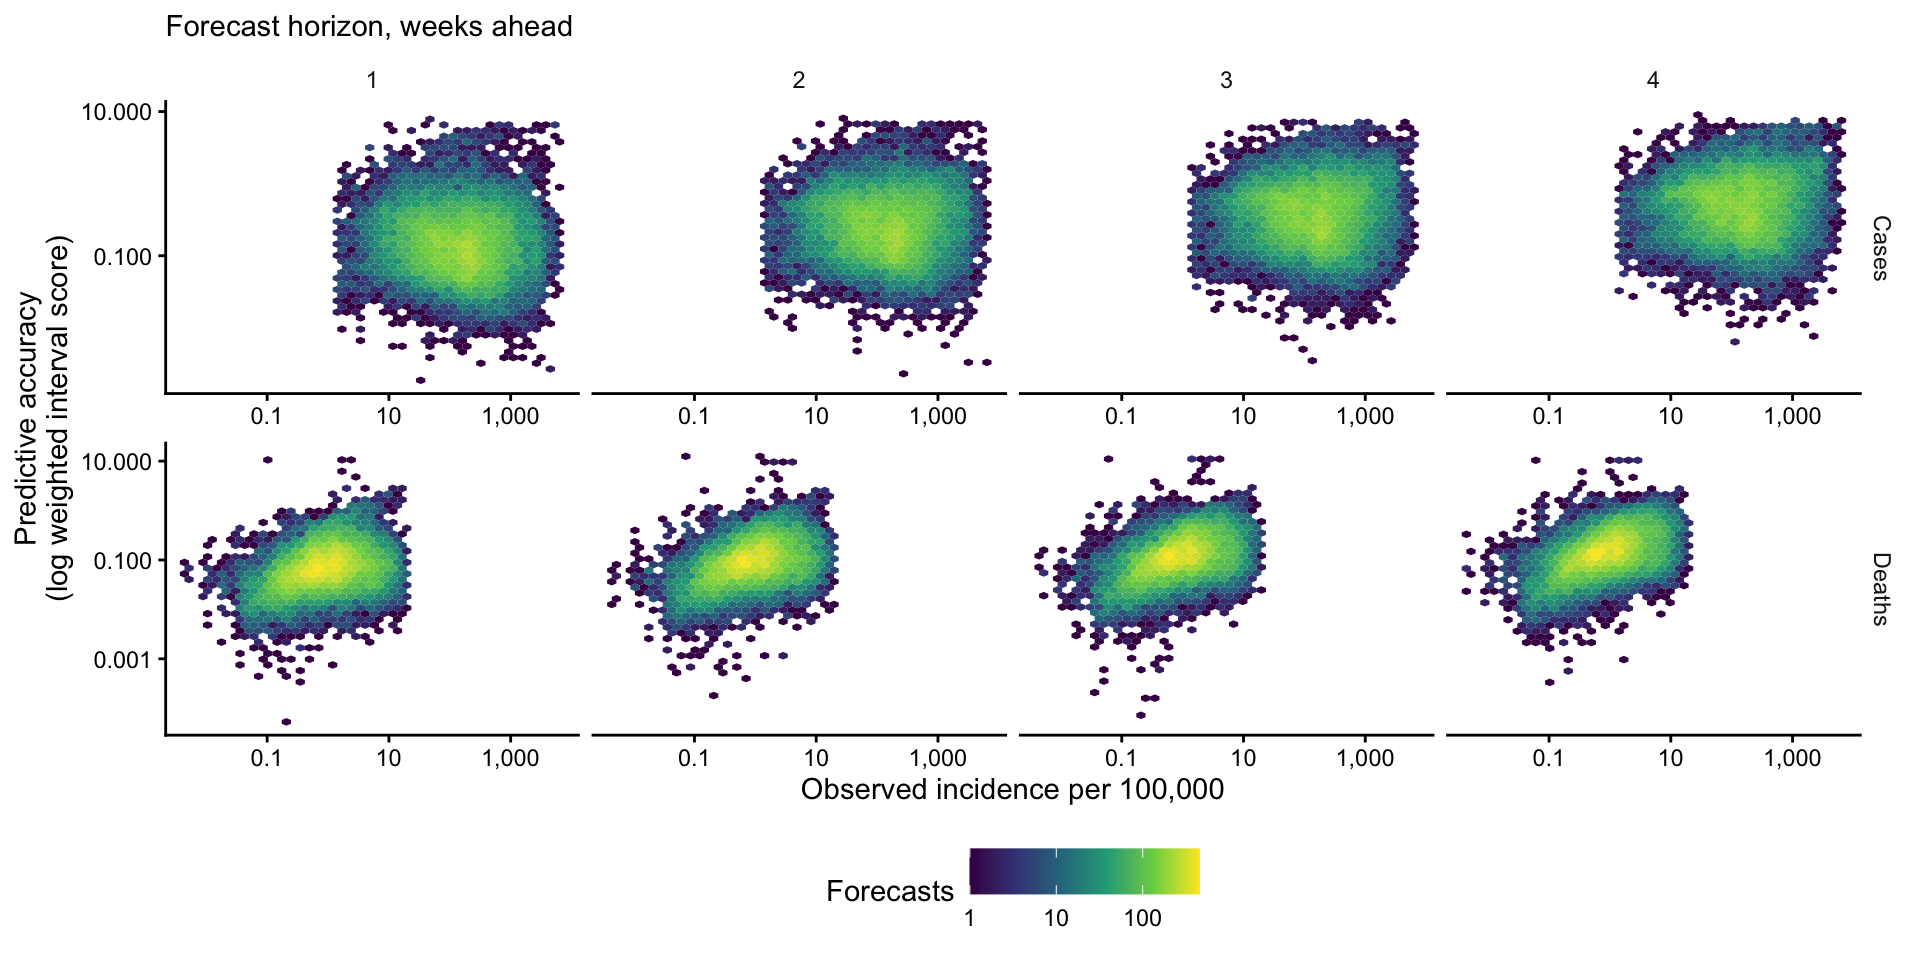
The main text shows this same relationship as aggregated percentile bands. At the level of individual forecasts, the same data show where forecasts actually concentrate and where scores cluster or trail off.