Estimates
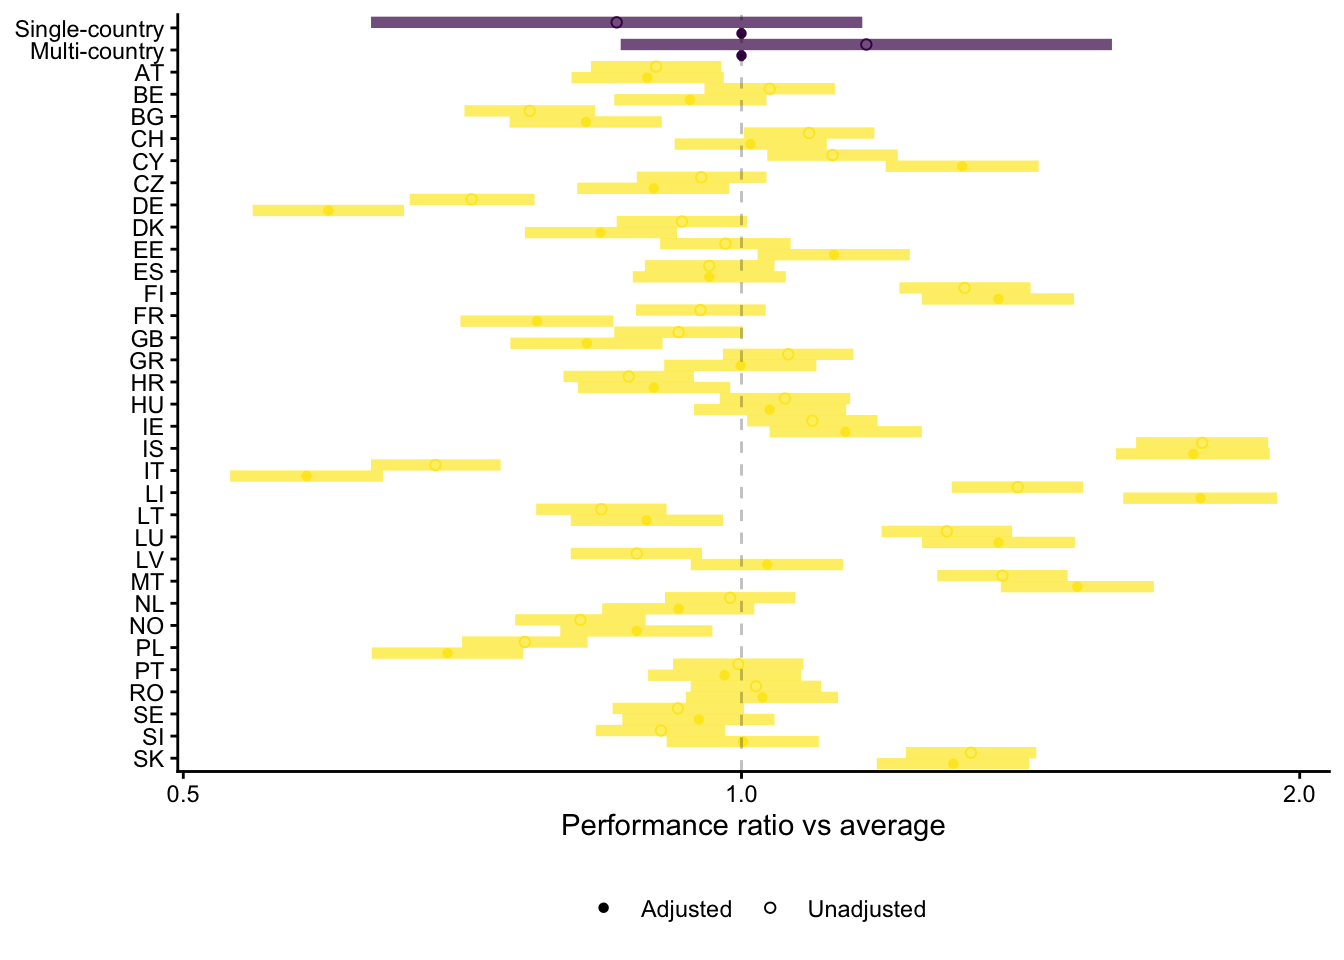
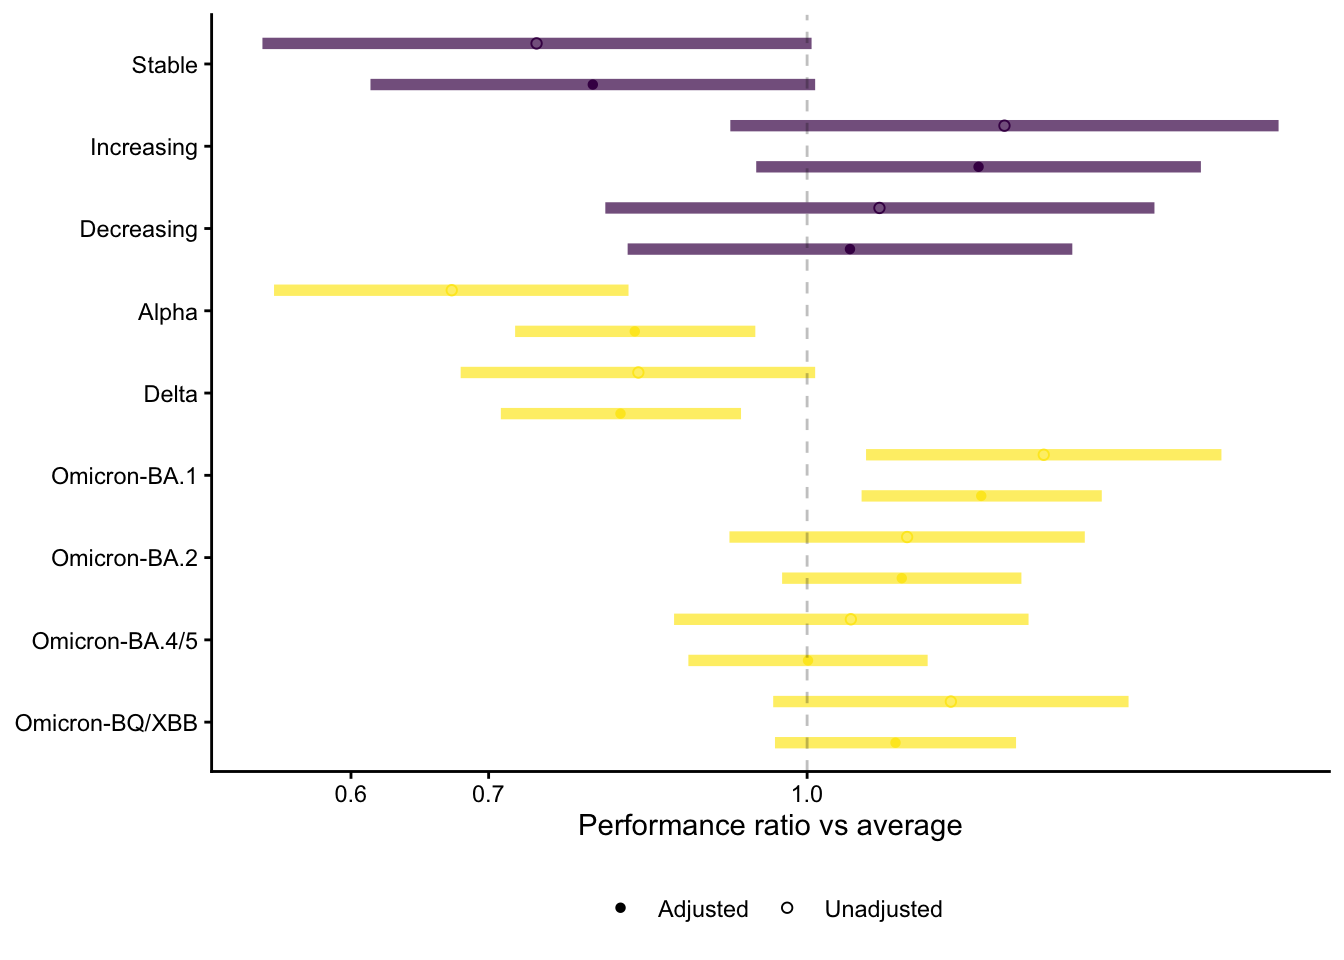
Effects are random effects for each level of a covariate, relative to a forecast at the average level of that covariate with all other terms held fixed. Negative raw effects, or ratios below 1, indicate better-than-average performance.
Partial effects across covariates
Partial effect on forecast performance of key covariates included in the fully adjusted model for additional covariates. Partial effects of individual model structure and individual model are presented in the main text.
- Geographic
- Epidemic state
Partial effects on the raw scale
The main-text figures and tables report exponentiated effects (multiplicative ratios of the expected LWIS relative to the average level of each factor). The table below gives the underlying raw partial effects from the fully adjusted model.
| Variable | Group | Partial effect (95% CI), log scale |
|---|---|---|
| CountryTargets | Multi-country | 0 (-0.003, 0.003) |
| Single-country | 0 (-0.003, 0.003) | |
| Epi_target | Deaths | -1.042 (-1.165, -0.919) |
| Location | AT | -0.117 (-0.211, -0.022) |
| BE | -0.064 (-0.158, 0.031) | |
| BG | -0.193 (-0.288, -0.099) | |
| CH | 0.011 (-0.083, 0.106) | |
| CY | 0.274 (0.179, 0.369) | |
| CZ | -0.109 (-0.204, -0.015) | |
| DE | -0.513 (-0.607, -0.419) | |
| DK | -0.175 (-0.269, -0.08) | |
| EE | 0.115 (0.02, 0.209) | |
| ES | -0.04 (-0.135, 0.055) | |
| FI | 0.319 (0.224, 0.413) | |
| FR | -0.254 (-0.349, -0.159) | |
| GB | -0.192 (-0.287, -0.098) | |
| GR | -0.001 (-0.096, 0.093) | |
| HR | -0.109 (-0.203, -0.014) | |
| HU | 0.035 (-0.059, 0.13) | |
| IE | 0.129 (0.035, 0.224) | |
| IS | 0.561 (0.465, 0.656) | |
| IT | -0.54 (-0.635, -0.445) | |
| LI | 0.57 (0.474, 0.665) | |
| LT | -0.118 (-0.212, -0.023) | |
| LU | 0.319 (0.224, 0.414) | |
| LV | 0.032 (-0.063, 0.126) | |
| MT | 0.417 (0.322, 0.512) | |
| NL | -0.078 (-0.173, 0.016) | |
| NO | -0.13 (-0.225, -0.036) | |
| PL | -0.365 (-0.459, -0.271) | |
| PT | -0.021 (-0.116, 0.074) | |
| RO | 0.026 (-0.069, 0.12) | |
| SE | -0.053 (-0.148, 0.041) | |
| SI | 0.002 (-0.093, 0.096) | |
| SK | 0.263 (0.168, 0.357) | |
| Method | Agent-based | -0.027 (-0.146, 0.091) |
| Judgement | -0.036 (-0.152, 0.081) | |
| Mechanistic | -0.007 (-0.104, 0.09) | |
| Semi-mechanistic | 0.08 (-0.023, 0.183) | |
| Statistical | -0.01 (-0.11, 0.09) | |
| Model | AMM-EpiInvert | -0.308 (-0.409, -0.207) |
| CovidMetrics-epiBATS | -0.124 (-0.261, 0.014) | |
| DSMPG-bayes | -0.508 (-0.63, -0.385) | |
| EuroCOVIDhub-baseline | 0.037 (-0.058, 0.132) | |
| FIAS_FZJ-Epi1Ger | 0.263 (0.145, 0.381) | |
| GoeWroc-BaseBayes | 0.483 (0.198, 0.768) | |
| HZI-AgeExtendedSEIR | -0.157 (-0.268, -0.046) | |
| ICM-agentModel | 0.117 (-0.034, 0.269) | |
| IEM_Health-CovidProject | -0.027 (-0.113, 0.059) | |
| ILM-EKF | -0.019 (-0.121, 0.083) | |
| ITWW-county_repro | 0.109 (-0.006, 0.224) | |
| Imperial-DeCa | 0.31 (0.157, 0.463) | |
| Imperial-RtI0 | 0.537 (0.385, 0.69) | |
| Imperial-sbkp | 0.45 (0.297, 0.603) | |
| JBUD-HMXK | 0.097 (0.004, 0.189) | |
| KITmetricslab-bivar_branching | 0.012 (-0.326, 0.351) | |
| Karlen-pypm | -0.155 (-0.243, -0.068) | |
| LANL-GrowthRate | -0.16 (-0.263, -0.056) | |
| LeipzigIMISE-SECIR | 0.049 (-0.216, 0.314) | |
| MIMUW-StochSEIR | 0.274 (0.108, 0.44) | |
| MIT_CovidAnalytics-DELPHI | 0.143 (0.036, 0.25) | |
| MOCOS-agent1 | -0.396 (-0.546, -0.246) | |
| MUNI-ARIMA | -0.112 (-0.207, -0.017) | |
| MUNI-LaggedRegARIMA | -0.181 (-0.299, -0.064) | |
| MUNI-VAR | 0.14 (0.036, 0.243) | |
| MUNI_DMS-SEIAR | -0.014 (-0.14, 0.112) | |
| PL_GRedlarski-DistrictsSum | -0.192 (-0.321, -0.062) | |
| RobertWalraven-ESG | 0.092 (-0.003, 0.187) | |
| SDSC_ISG-TrendModel | 0.381 (0.252, 0.511) | |
| UB-BSLCoV | 0.061 (-0.099, 0.221) | |
| UC3M-EpiGraph | 0.313 (0.086, 0.541) | |
| ULZF-SEIRC19SI | -0.335 (-0.458, -0.213) | |
| UMass-MechBayes | -0.155 (-0.243, -0.066) | |
| UMass-SemiMech | -0.061 (-0.167, 0.045) | |
| UNED-PreCoV2 | -0.025 (-0.173, 0.124) | |
| UNIPV-BayesINGARCHX | 0.436 (0.308, 0.564) | |
| USC-SIkJalpha | 0.125 (0.039, 0.21) | |
| UpgUmibUsi-MultiBayes | -0.391 (-0.584, -0.198) | |
| bisop-seirfilter | 0.004 (-0.216, 0.224) | |
| bisop-seirfilterlite | 0.083 (-0.029, 0.195) | |
| epiMOX-SUIHTER | -0.348 (-0.506, -0.19) | |
| epiforecasts-EpiExpert | -0.105 (-0.243, 0.032) | |
| epiforecasts-EpiExpert_Rt | -0.098 (-0.243, 0.047) | |
| epiforecasts-EpiExpert_direct | -0.123 (-0.268, 0.023) | |
| epiforecasts-EpiNow2 | -0.025 (-0.127, 0.077) | |
| epiforecasts-weeklygrowth | -0.2 (-0.298, -0.103) | |
| itwm-dSEIR | -0.04 (-0.149, 0.069) | |
| prolix-euclidean | 0.525 (0.413, 0.636) | |
| Trend | Decreasing | 0.048 (-0.201, 0.297) |
| Increasing | 0.192 (-0.057, 0.441) | |
| Stable | -0.24 (-0.489, 0.009) | |
| VariantPhase | Alpha | -0.193 (-0.327, -0.058) |
| Delta | -0.209 (-0.343, -0.074) | |
| Omicron-BA.1 | 0.195 (0.061, 0.33) | |
| Omicron-BA.2 | 0.106 (-0.028, 0.24) | |
| Omicron-BA.4/5 | 0.001 (-0.133, 0.135) | |
| Omicron-BQ/XBB | 0.099 (-0.036, 0.234) |
The model structure term is fitted as a single grouping factor crossing structure with epidemiological outcome, so its raw partial effects are one per structure-by-outcome cell. The main text reports these exponentiated, and reports a pooled effect per structure derived as a contrast averaging a structure’s two cells.
| Model structure | Cases | Deaths |
|---|---|---|
| Agent-based | 1.09 (0.95, 1.25) | 0.87 (0.75, 1) |
| Judgement | 0.95 (0.83, 1.08) | 0.98 (0.86, 1.12) |
| Mechanistic | 0.95 (0.84, 1.06) | 1.04 (0.93, 1.17) |
| Semi-mechanistic | 1.06 (0.94, 1.2) | 1.1 (0.98, 1.24) |
| Statistical | 0.96 (0.85, 1.08) | 1.02 (0.91, 1.15) |
| Model structure | Outcome | Partial effect (95% CI), log scale |
|---|---|---|
| Agent-based | Cases | 0.088 (-0.05, 0.227) |
| Deaths | -0.143 (-0.283, -0.003) | |
| Judgement | Cases | -0.055 (-0.188, 0.079) |
| Deaths | -0.017 (-0.15, 0.117) | |
| Mechanistic | Cases | -0.055 (-0.169, 0.06) |
| Deaths | 0.04 (-0.075, 0.155) | |
| Semi-mechanistic | Cases | 0.062 (-0.058, 0.182) |
| Deaths | 0.099 (-0.021, 0.218) | |
| Statistical | Cases | -0.041 (-0.158, 0.076) |
| Deaths | 0.02 (-0.097, 0.138) |
Model ranking before and after adjustment
Individual models can be ranked by their partial effect on the score, either from a univariate model containing only individual model identity, or from the fully adjusted model. The first ranks models by observed performance, and so by a combination of the method used and the difficulty of the targets each model chose to forecast. The second ranks them by performance after the target-related covariates are held fixed. The comparison is reported in the main text; the table below gives the models that move furthest between the two.
| Model | Unadjusted rank | Adjusted rank | Rank change |
|---|---|---|---|
| Semi-mechanistic 3 | 4 | 45 | -41 |
| Semi-mechanistic 4 | 7 | 48 | -41 |
| Semi-mechanistic 2 | 2 | 41 | -39 |
| Statistical 11 | 43 | 7 | 36 |
| Statistical 10 | 40 | 6 | 34 |
| Mechanistic 15 | 35 | 8 | 27 |
| Semi-mechanistic 10 | 42 | 22 | 20 |
| Statistical 6 | 32 | 14 | 18 |
| Mechanistic 4 | 12 | 29 | -17 |
| Mechanistic 9 | 21 | 38 | -17 |
Individual model effects at one week ahead
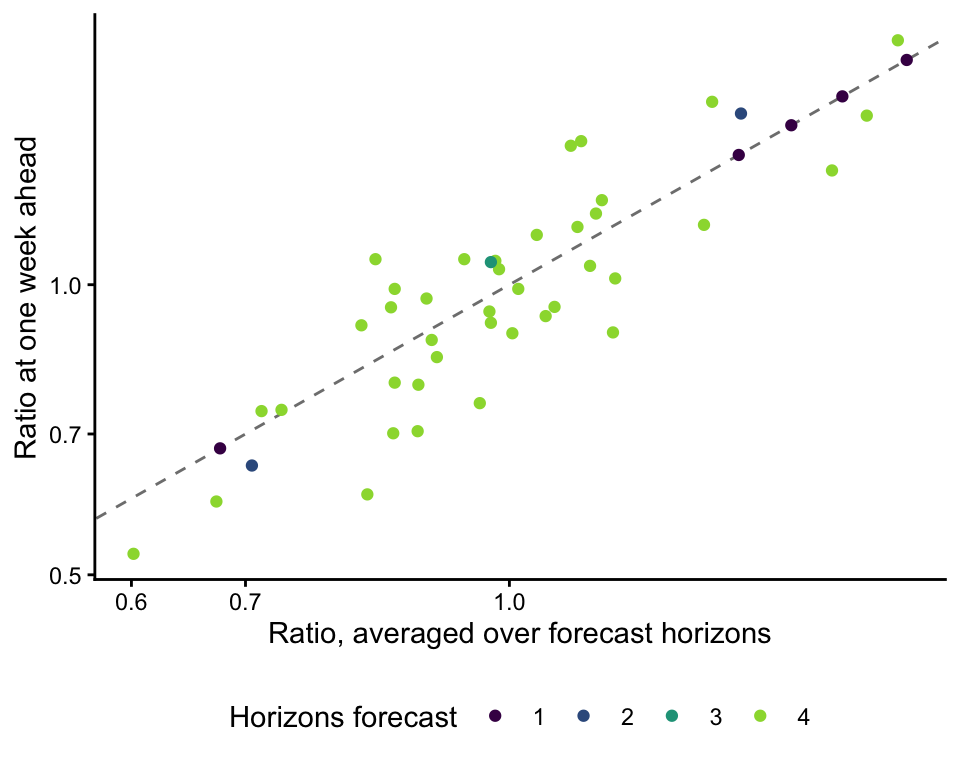
Spearman correlation between the two: 0.86.