National estimates
This page gives the national estimates from the joint model, whose methods are on the Methods page.
This page is generated from docs/pages/estimates/national.jl. The model code it calls is in src/. See aim and origins and limitations.
Offline copy. Each results release attaches the rendered site built from the same run: download the latest. The README.txt inside says how to view it.
Load packages, data and fitted chains
# Shared setup: packages, observations and the fit registry. See
# `docs/pages/_setup.jl`.
using BVDOutbreakSize
include(joinpath(pkgdir(BVDOutbreakSize), "docs", "pages", "_setup.jl"))
validation_forecast_from (generic function with 1 method)# The fits and prior draws this page reads, loaded from the cache here.
chn_joint = load_fit("joint")
chn_no_patches = load_fit("sens_no_patches")
chn_exports = load_fit("exports")
chn_deaths = load_fit("deaths")
chn_cases = load_fit("cases")
chn_confirmed = load_fit("confirmed")
chn_confirmed_deaths = load_fit("confirmed_deaths")
chn_treatment = load_fit("treatment")
chn_onsets = load_fit("onsets")
frozen_lastweek = load_fit("frozen_validation")
frozen_lastweek_streams = frozen_validation_stream_fits()
frozen_by_cutoff = frozen_fits_by_cutoff()
frozen_results = [frozen_by_cutoff[c] for c in frozen_cutoffs]
if RUN_SENSITIVITY
chn_joint_community_delay = load_fit("sens_community_delay")
chn_joint_exp_growth_clock = load_fit("sens_exp_growth_clock")
end
posterior_C_joint = vec(Array(chn_joint[:C_T]))
prior_chn = joint_prior_draws();Last updated: 23 October 2026.
Data as of: 20 October 2026.
Results
Summary
The estimates below come from the joint posterior, as equal-tailed 30%, 60% and 90% credible intervals. The estimates for each province are on the province estimates page.
Compute the headline ranges
summary_ranges = let
    med(x) = quantile(x, 0.5)
    iqr(x) = quantile(x, 0.75) - quantile(x, 0.25)
    # Posterior-minus-prior shift in units of the parameter's prior IQR,
    # reusing the prior draws so nothing is respecified here.
    shift(post, prior) = round(
        (med(post) - med(prior)) / iqr(prior);
        digits = 2
    )

    C = posterior_C_joint
    Td = vec(Array(chn_joint[:T]))
    r0d = vec(Array(chn_joint[:r0]))
    rd = vec(Array(chn_joint[:r]))
    dt = vec(Array(chn_joint[:doubling_time]))
    R0d = vec(Array(chn_joint[:R0]))
    RTd = vec(Array(chn_joint[:R_T]))
    cfrd = vec(Array(chn_joint[:CFR]))
    sC = posterior_summary(C)
    sT = posterior_summary(Td)
    sr0 = posterior_summary(r0d)
    sr = posterior_summary(rd)
    # Doubling time is unbounded at zero growth, so its own quantiles do
    # not bound it once the growth rate spans zero. Map the growth rate's
    # interval instead, as the summary tables do.
    sdt0 = map(doubling_time, posterior_summary(r0d))
    sdt = map(doubling_time, posterior_summary(rd))
    sR0 = posterior_summary(R0d)
    sRT = posterior_summary(RTd)
    scfr = posterior_summary(cfrd)

    # The 30/60/90% interval phrase.
    ints(s, d) = BVDOutbreakSize._interval_text(s; digits = d)
    start_from(t) = obs.cutoff - Day(round(Int, t))
    ints_d(s) = string(
        "30% ", start_from(s.hi30), "–", start_from(s.lo30),
        ", 60% ", start_from(s.hi60), "–", start_from(s.lo60),
        ", 90% ", start_from(s.hi90), "–", start_from(s.lo90)
    )
    f_lo = round(sC.lo90 / obs.confirmed_cases; digits = 1)
    f_hi = round(sC.hi90 / obs.confirmed_cases; digits = 1)

    # How far the data has moved each estimate from its prior, in prior
    # interquartile ranges, reusing the prior draws.
    moves = [
        "cumulative infection count" => shift(C, vec(Array(prior_chn[:C_T]))),
        "outbreak age" => shift(Td, vec(Array(prior_chn[:T]))),
        "doubling time" => shift(dt, vec(Array(prior_chn[:doubling_time]))),
    ]
    biggest = argmax(p -> abs(p.second), moves)

    Markdown.parse(
        """
        - **Cumulative infections:** the outbreak is estimated to have caused
          $(ints(sC, 0)) infections to date, reported and unreported.
        - Against the $(obs.confirmed_cases) laboratory-confirmed cases by the
          cut-off that is roughly $(f_lo)–$(f_hi)× as many infections, so
          confirmed cases are estimated to capture only a small share of the
          outbreak.
        - **Outbreak start and age:** the outbreak is estimated to have begun on
          a start date of $(ints_d(sT)), an elapsed age to the cut-off of
          $(ints(sT, 0)) days.
        - **Growth rate and doubling time:** the initial growth rate is
          estimated to have been $(ints(sr0, 3)) per day, an initial doubling
          time of $(ints(sdt0, 1)) days.
          The latest growth rate is estimated to be $(ints(sr, 3)) per day, a
          latest doubling time of $(ints(sdt, 1)) days.
        - **Reproduction number:** the initial reproduction number is estimated
          to have been $(ints(sR0, 2)) and the latest to be $(ints(sRT, 2)).
        - **Case-fatality ratio:** the case-fatality ratio is estimated to be
          $(ints(scfr, 2)).
        - **Shift from priors:** how far the data has moved each estimate from
          its prior, in prior interquartile ranges, where a value of one means
          the posterior median sits one prior interquartile range from the prior
          median, zero means unchanged, and the sign gives the direction.
          The fit moves the cumulative infection count by $(moves[1].second),
          the outbreak age by $(moves[2].second) and the doubling time by
          $(moves[3].second); the largest move is in the $(biggest.first).
        """
    )
end;
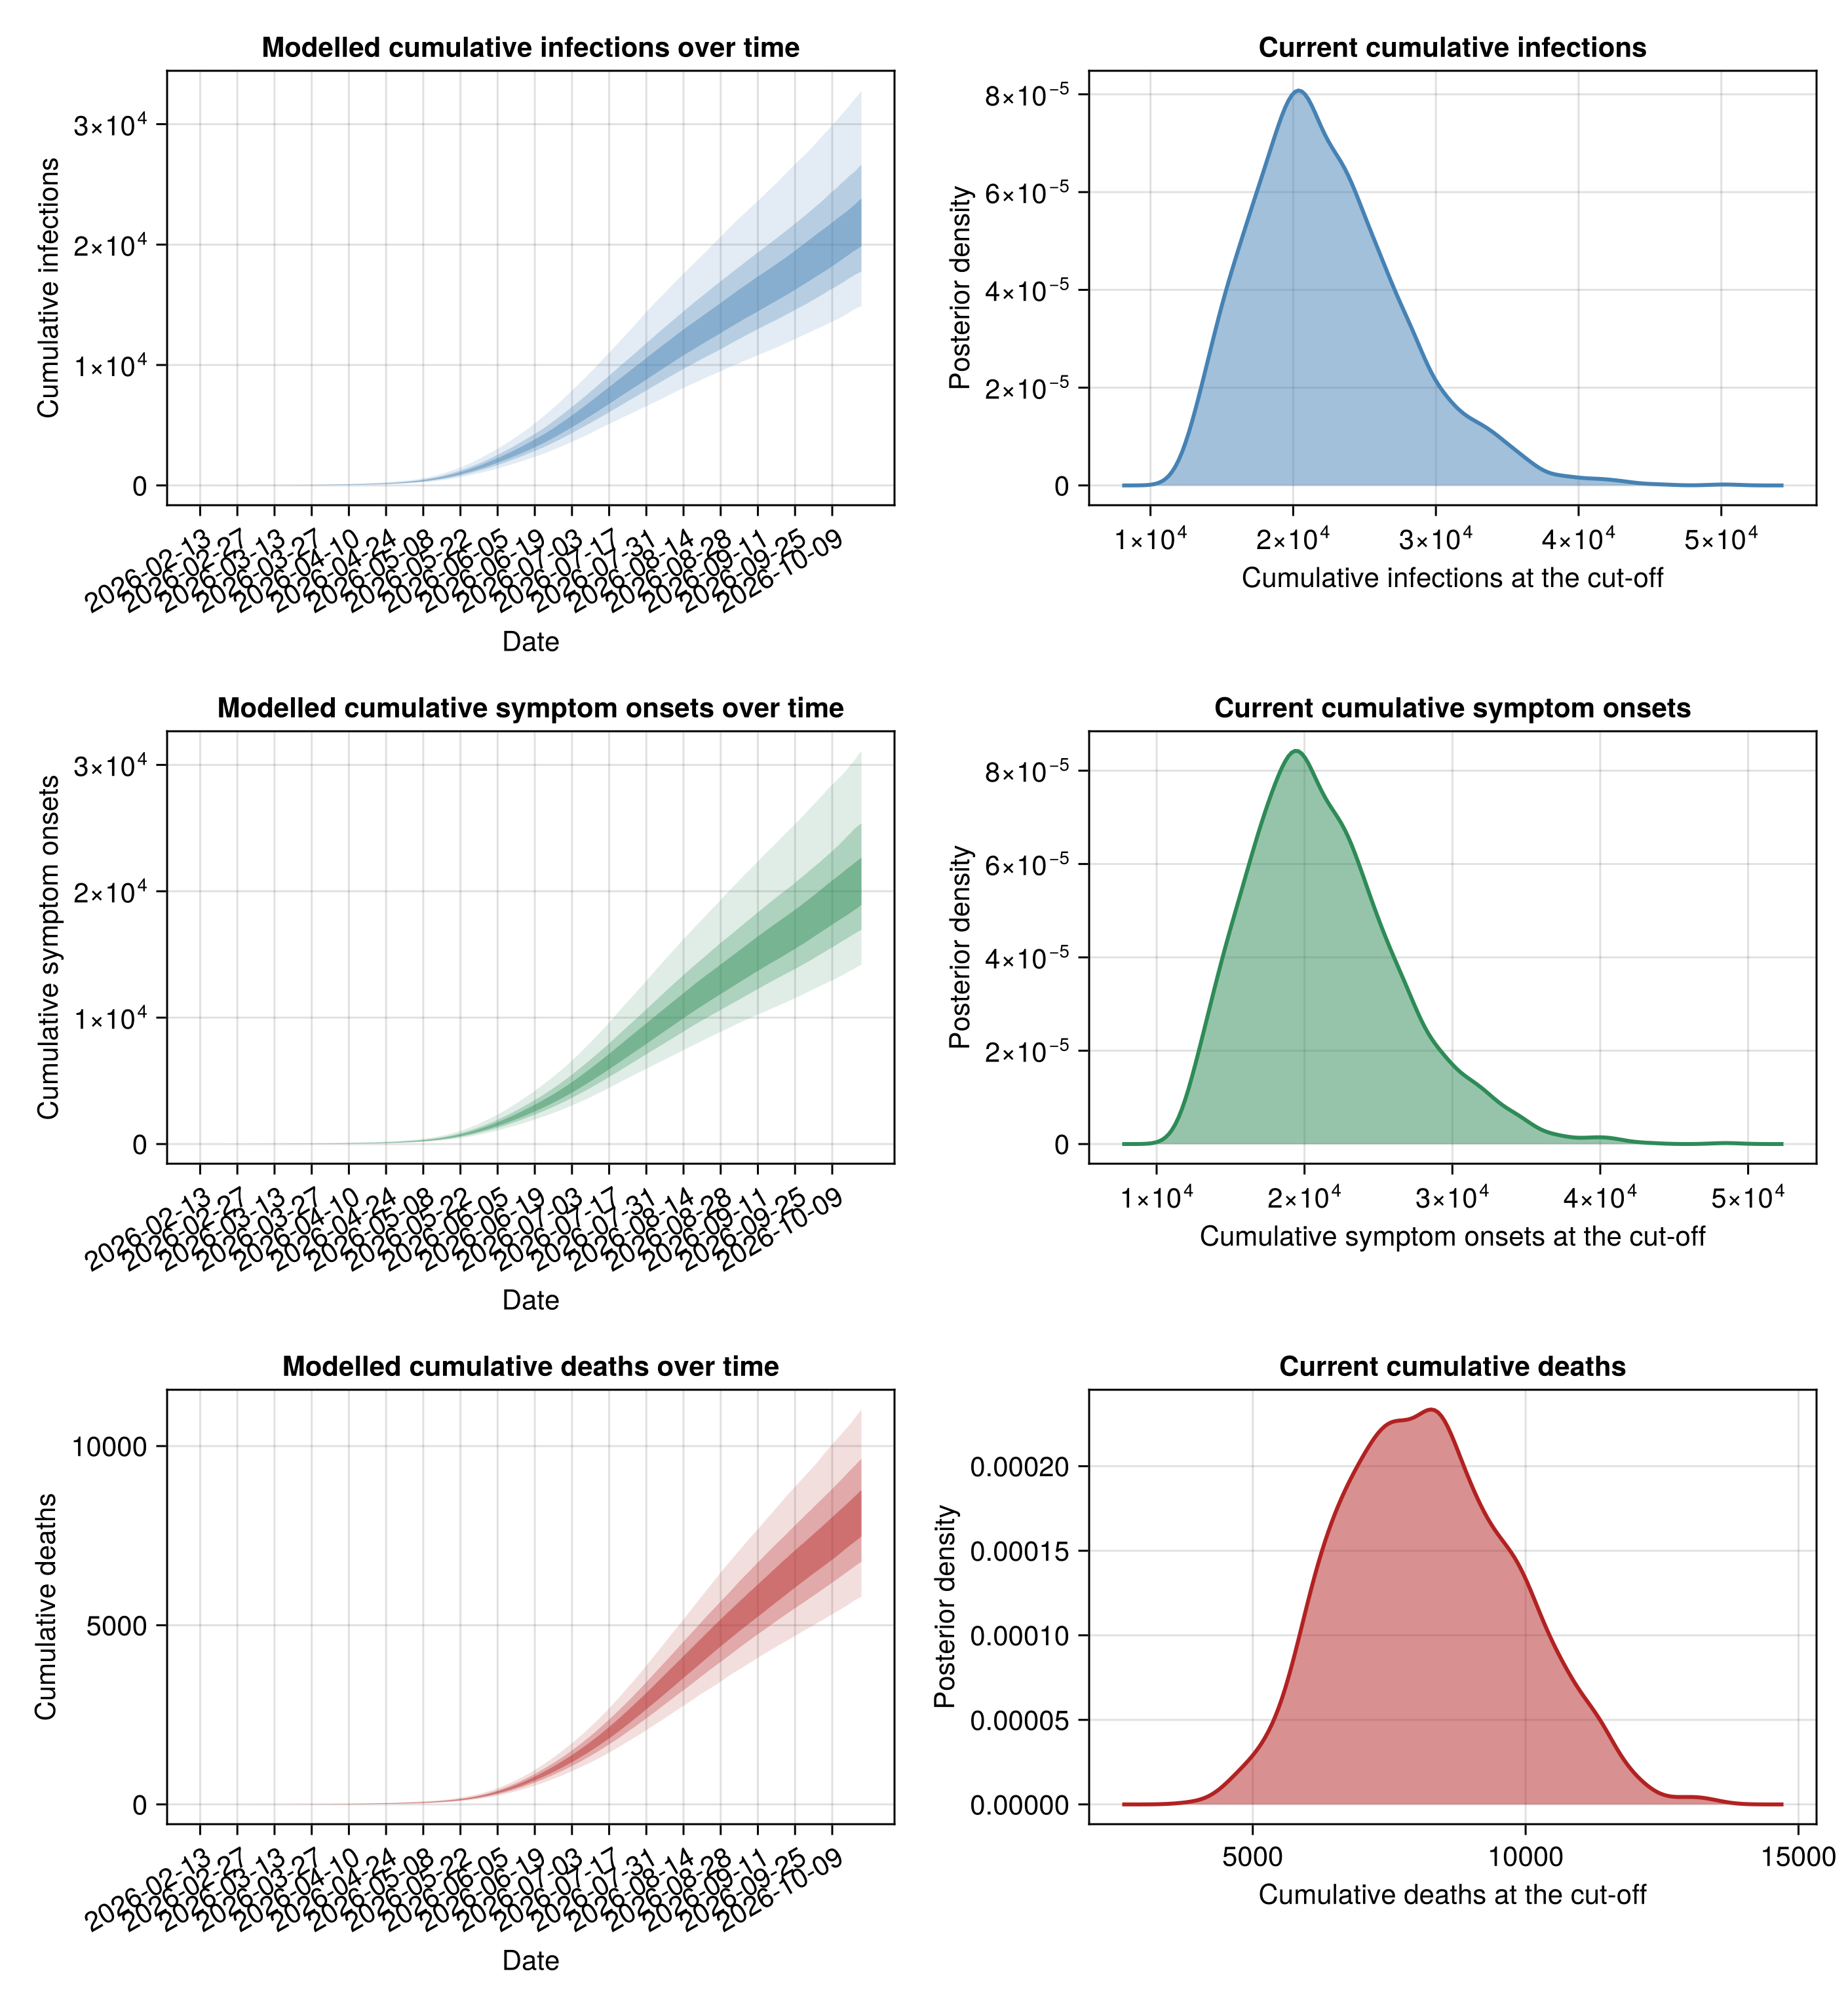
Cumulative infections: the outbreak is estimated to have caused 30% 19852–23821, 60% 17752–26643, 90% 14896–32793 infections to date, reported and unreported.
Against the 9704 laboratory-confirmed cases by the cut-off that is roughly 1.5–3.4× as many infections, so confirmed cases are estimated to capture only a small share of the outbreak.
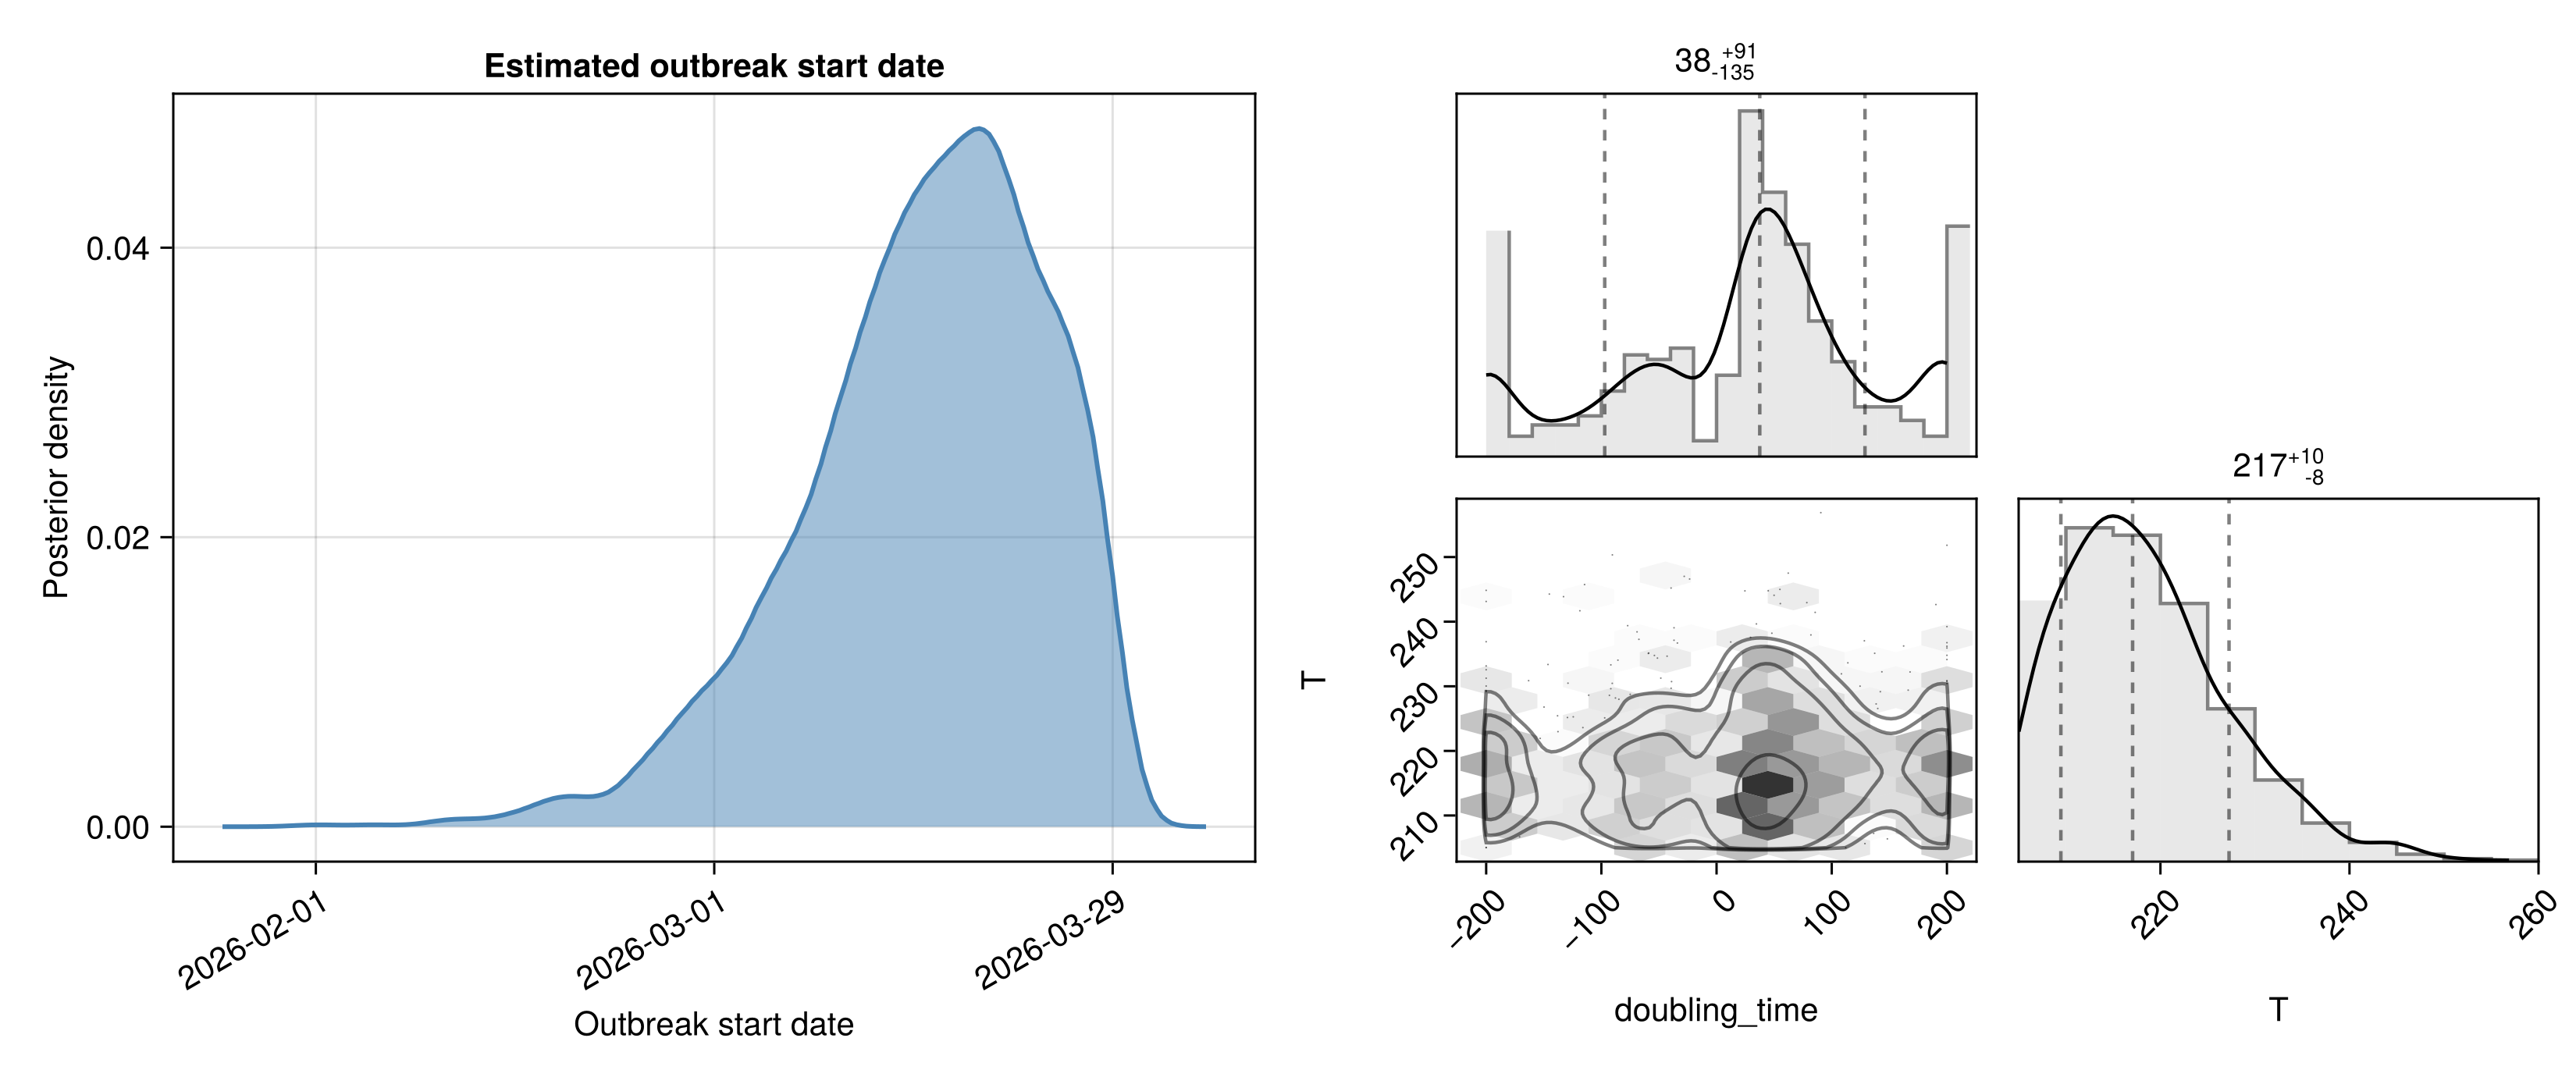
Outbreak start and age: the outbreak is estimated to have begun on a start date of 30% 2026-03-13–2026-03-20, 60% 2026-03-09–2026-03-23, 90% 2026-02-28–2026-03-28, an elapsed age to the cut-off of 30% 214–221, 60% 211–225, 90% 206–234 days.
Growth rate and doubling time: the initial growth rate is estimated to have been 30% 0.055–0.067, 60% 0.049–0.075, 90% 0.039–0.088 per day, an initial doubling time of 30% 12.5–10.3, 60% 14.1–9.3, 90% 17.8–7.9 days. The latest growth rate is estimated to be 30% 0.001–0.011, 60% -0.005–0.018, 90% -0.017–0.031 per day, a latest doubling time of 30% 688.7–65.9, 60% -141.1–39.3, 90% -40.7–22.2 days.
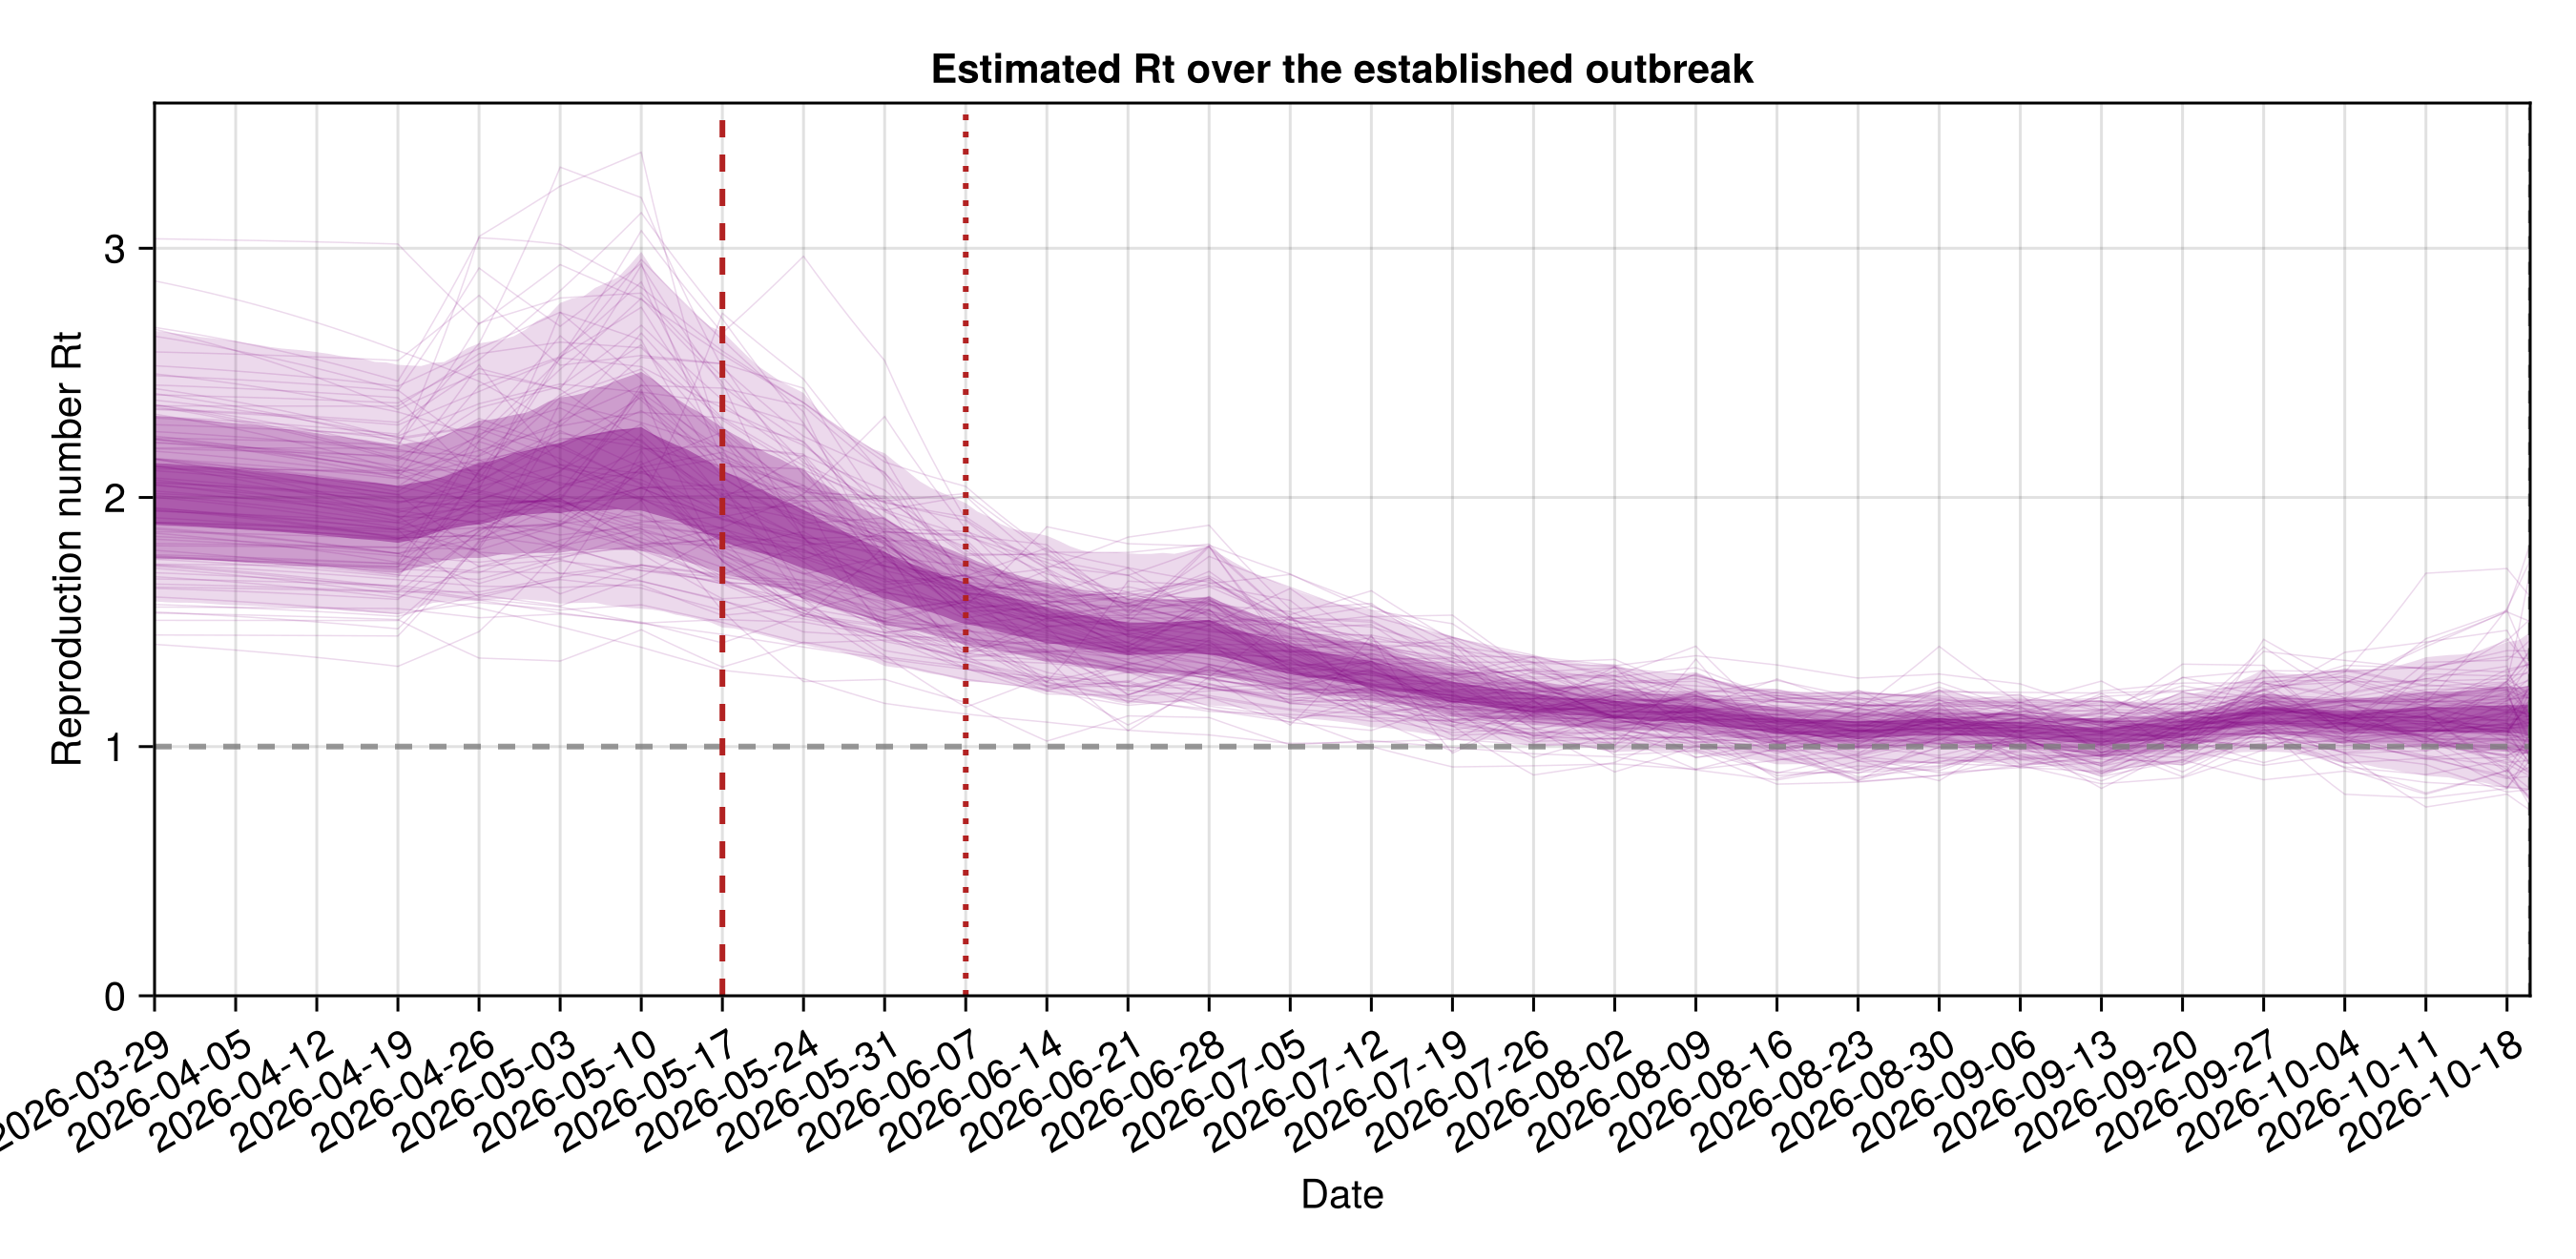
Reproduction number: the initial reproduction number is estimated to have been 30% 1.95–2.21, 60% 1.8–2.43, 90% 1.62–2.8 and the latest to be 30% 1.01–1.15, 60% 0.93–1.26, 90% 0.78–1.49.
Case-fatality ratio: the case-fatality ratio is estimated to be 30% 0.46–0.52, 60% 0.43–0.55, 90% 0.38–0.6.
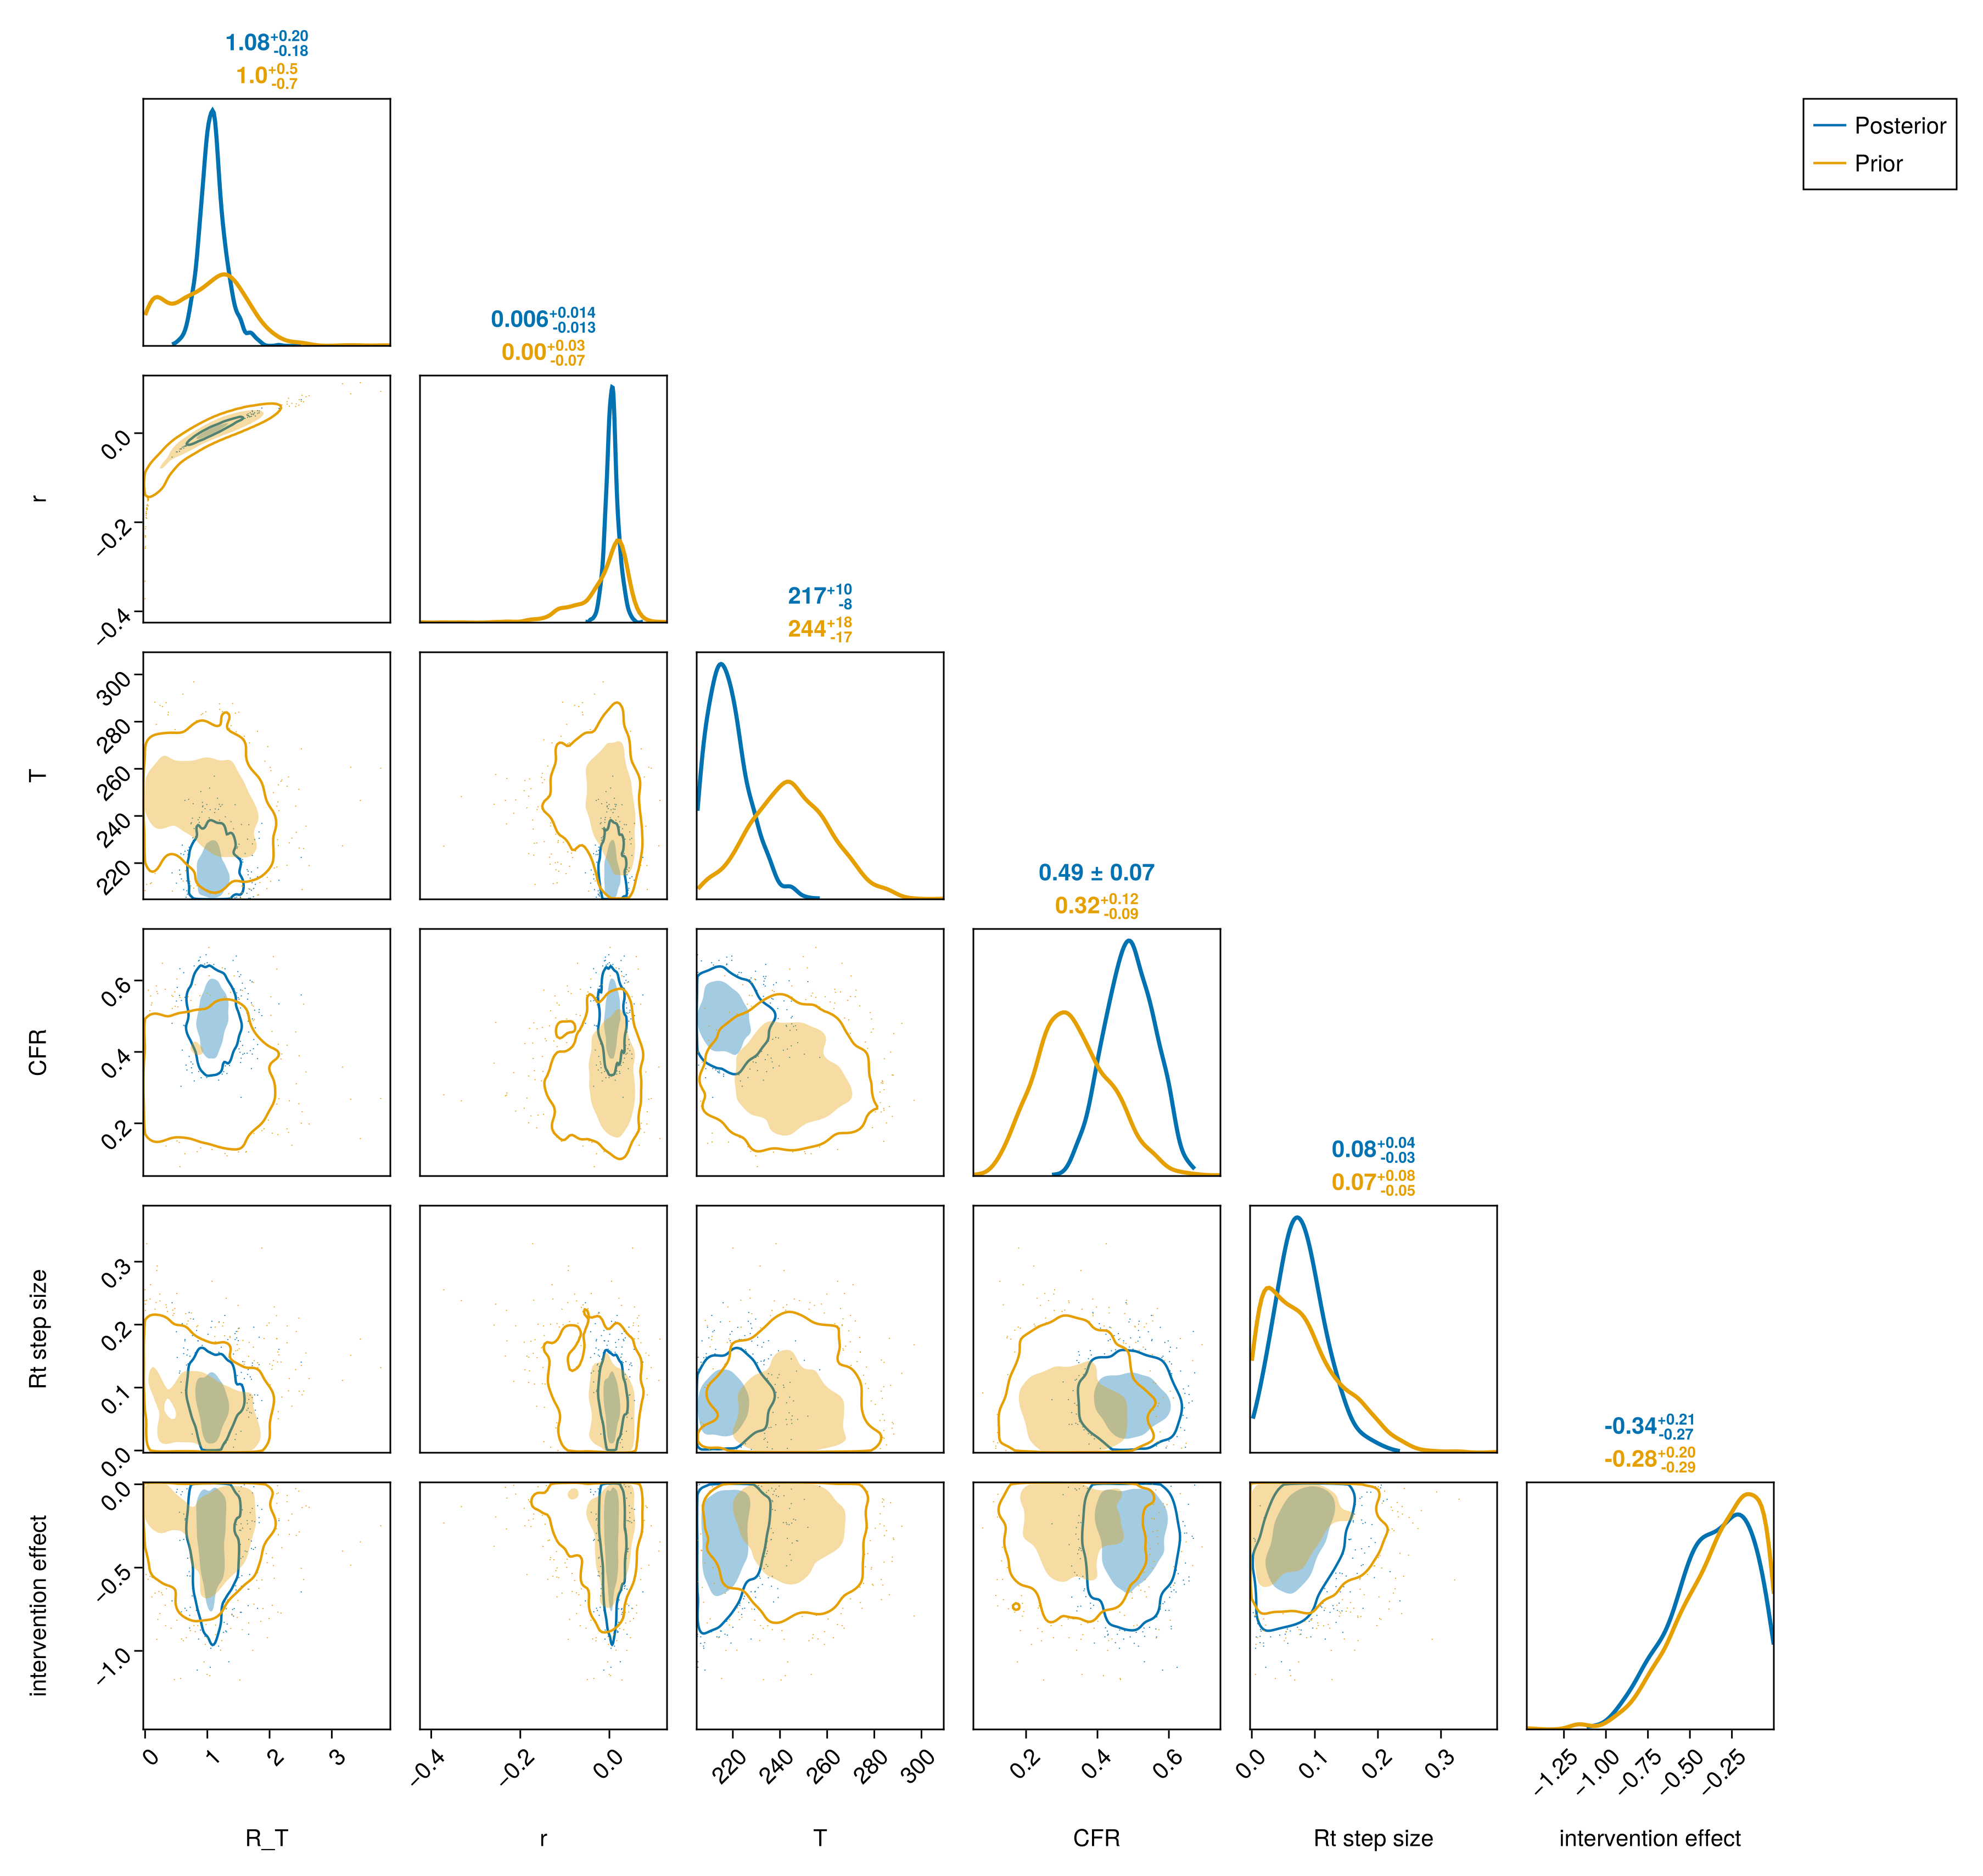
Shift from priors: how far the data has moved each estimate from its prior, in prior interquartile ranges, where a value of one means the posterior median sits one prior interquartile range from the prior median, zero means unchanged, and the sign gives the direction. The fit moves the cumulative infection count by -0.07, the outbreak age by -1.14 and the doubling time by 0.59; the largest move is in the outbreak age.
Fit diagnostics
The sampler diagnostics show how far the inference can be trusted, for the joint fit and each individual fit. The breakdown by parameter locates any problem in the joint fit, and the health-zone model has its own fit diagnostics.
Build the fit diagnostics table
fit_diagnostics_table = diagnostics_table(
    "joint" => chn_joint,
    "joint, no patches" => chn_no_patches,
    "exports" => chn_exports,
    "deaths (DRC)" => chn_deaths,
    "cases (DRC)" => chn_cases,
    "confirmed (DRC)" => chn_confirmed,
    "confirmed deaths (DRC)" => chn_confirmed_deaths,
    "isolation (DRC)" => chn_treatment,
    "onsets (DRC)" => chn_onsets,
    "frozen (1wk back)" => frozen_lastweek.chn,
    (
        RUN_SENSITIVITY ?
            [
                "delay sensitivity" => chn_joint_community_delay,
                "clock sensitivity (ExpGrowth)" => chn_joint_exp_growth_clock,
            ] :
            []
    )...
);

# Only the joint fit is held to the convergence thresholds.
include(joinpath(pkgdir(BVDOutbreakSize), "docs", "fits", "convergence.jl"))
fit_convergence_summary = convergence_summary(
    "joint", fit_diagnostics(chn_joint)
)
fit_diagnostics_detail_md = let t = fit_diagnostics_table,
        rhat = filter(r -> isfinite(r.max_rhat), t),
        bulk = filter(r -> isfinite(r.min_ess_bulk), t),
        tail = filter(r -> isfinite(r.min_ess_tail), t),
        worst = rhat[argmax(rhat.max_rhat), :],
        least_bulk = bulk[argmin(bulk.min_ess_bulk), :],
        least_tail = tail[argmin(tail.min_ess_tail), :]

    fit_convergence_summary.detail * "\n\n" *
        "Across all $(size(t, 1)) fits the worst R-hat is " *
        "$(fmt_value(worst.max_rhat)), in the $(worst.fit) fit. " *
        "The lowest bulk effective sample size is " *
        "$(fmt_count(least_bulk.min_ess_bulk)), in the $(least_bulk.fit) fit, " *
        "and the lowest tail effective sample size is " *
        "$(fmt_count(least_tail.min_ess_tail)), in the $(least_tail.fit) fit. " *
        "Only the joint fit is held to the thresholds above."
end
fit_diagnostics_detail = Markdown.parse(fit_diagnostics_detail_md);
The joint fit passes the convergence checks with warnings.
Fit diagnostics table
Its worst R-hat is 1.03 and its lowest bulk effective sample size is 60, with 1 divergent transitions in 2000 draws. A fit passes without warnings when its worst R-hat is at most 1.05, its effective sample sizes are at least 100 and at most 1% of its draws diverge.
Across all 12 fits the worst R-hat is 2.19, in the deaths (DRC) fit. The lowest bulk effective sample size is 6, in the deaths (DRC) fit, and the lowest tail effective sample size is 18, in the delay sensitivity fit. Only the joint fit is held to the thresholds above.
| Row | fit | max_rhat | min_ess_bulk | min_ess_tail | divergences |
|---|---|---|---|---|---|
| String | Float64 | Float64 | Float64 | Int64 | |
| 1 | joint | 1.032 | 60.0 | 60.0 | 1 |
| 2 | joint, no patches | 1.009 | 252.0 | 392.0 | 0 |
| 3 | exports | 1.042 | 43.0 | 40.0 | 7 |
| 4 | deaths (DRC) | 2.186 | 6.0 | 20.0 | 888 |
| 5 | cases (DRC) | 1.018 | 106.0 | 127.0 | 12 |
| 6 | confirmed (DRC) | 1.013 | 98.0 | 282.0 | 8 |
| 7 | confirmed deaths (DRC) | 1.009 | 214.0 | 402.0 | 9 |
| 8 | isolation (DRC) | 1.027 | 56.0 | 29.0 | 4 |
| 9 | onsets (DRC) | 1.062 | 35.0 | 35.0 | 0 |
| 10 | frozen (1wk back) | 1.12 | 16.0 | 39.0 | 1 |
| 11 | delay sensitivity | 1.107 | 18.0 | 18.0 | 5 |
| 12 | clock sensitivity (ExpGrowth) | 1.016 | 75.0 | 115.0 | 1 |
Data currency
The cut-off is the last date any stream reports.
Build the data currency table
stream_status = stream_report_status(obs)
stream_currency_table = let stale = stream_status[.!stream_status.reporting, :]
    DataFrame(
        "Stream" => stale.label,
        "Last reported" => [
            ismissing(d) ? "never" : string(d) for d in stale.last_date
        ],
        "Days before cut-off" => [
            ismissing(d) ? "-" : string(d) for d in stale.days_since
        ]
    )
end
stream_currency_summary = let n = length(stream_status.stream),
        n_current = count(stream_status.reporting),
        cutoff = format_report_date(obs.cutoff)

    Markdown.parse(
        if n_current == n
            "All $n streams report within " *
                "$(STREAM_REPORTING_GRACE_DAYS) days of the $cutoff cut-off."
        else
            "$n_current of the $n streams report within " *
                "$(STREAM_REPORTING_GRACE_DAYS) days of the $cutoff cut-off. " *
                "The other $(n - n_current) stopped earlier and are " *
                "carried frozen."
        end
    )
end;
11 of the 25 streams report within 7 days of the 20 October 2026 cut-off. The other 14 stopped earlier and are carried frozen.
Streams that stop before the cut-off
| Stream | Last reported | Days before cut-off |
|---|---|---|
| Suspected cases | 2026-05-26 | 147 |
| Suspected deaths | 2026-05-26 | 147 |
| New suspected deaths/day | 2026-07-11 | 101 |
| Specimens analysed (cumulative) | 2026-05-28 | 145 |
| Specimens received | 2026-05-28 | 145 |
| Bed capacity | 2026-10-08 | 12 |
| Admissions/day | 2026-08-02 | 79 |
| In-care deaths/day | 2026-08-02 | 79 |
| Rule-outs/day | 2026-08-02 | 79 |
| Absconded/day | 2026-08-02 | 79 |
| Confirmed in care | 2026-08-02 | 79 |
| Suspects in care | 2026-08-02 | 79 |
| Onset reports | 2026-10-10 | 10 |
| Uganda exports | 2026-05-23 | 150 |
Joint model estimates
Cumulative infection count summary table
cumulative_cases_summary = summary_table(
    chn_joint, [:C_T]; digits = 0
);| Row | Quantity | Lower 90% | Lower 60% | Lower 30% | Upper 30% | Upper 60% | Upper 90% |
|---|---|---|---|---|---|---|---|
| String | Float64 | Float64 | Float64 | Float64 | Float64 | Float64 | |
| 1 | C_T | 14896.0 | 17752.0 | 19852.0 | 23821.0 | 26643.0 | 32793.0 |
Cumulative infections, onsets and deaths figure
cumulative_traj_fig = plot_cumulative_trajectories(
    chn_joint;
    n = obs.n, seeding = obs.seeding
);
The per-province sizes, the modelled infections behind them and the importation between provinces are on the province estimates page.
The cumulative infection count is set by the reproduction number trajectory and the outbreak age.
Outbreak start date and seeding-time posterior
start_date_fig = plot_start_date_pair(
    chn_joint;
    as_of_date = string(obs.cutoff)
);
Infection-parameter summary table
infection_summary = summary_table(
    chn_joint,
    [:r, :doubling_time, :T, :R_T, :CFR, :C_T]; digits = 2
);| Row | Quantity | Lower 90% | Lower 60% | Lower 30% | Upper 30% | Upper 60% | Upper 90% |
|---|---|---|---|---|---|---|---|
| String | Float64 | Float64 | Float64 | Float64 | Float64 | Float64 | |
| 1 | r | -0.02 | -0.0 | 0.0 | 0.01 | 0.02 | 0.03 |
| 2 | doubling_time | -40.72 | -141.06 | 688.73 | 65.86 | 39.3 | 22.22 |
| 3 | T | 206.45 | 210.74 | 214.02 | 220.54 | 224.92 | 234.15 |
| 4 | R_T | 0.78 | 0.93 | 1.01 | 1.15 | 1.26 | 1.49 |
| 5 | CFR | 0.38 | 0.43 | 0.46 | 0.52 | 0.55 | 0.6 |
| 6 | C_T | 14896.4 | 17752.2 | 19852.0 | 23820.5 | 26643.0 | 32792.9 |
Infection-parameter pair plot (prior overlaid)
infection_pair_fig = plot_pair(
    chn_joint,
    [
        :R_T, :r, :T, :CFR,
        Symbol("rt_state.sigma_rw"), Symbol("rt_state.intervention_effect"),
    ];
    prior = prior_chn, labels = display_names
);
Infection-delay summary table
infection_delay_summary = summary_table(
    chn_joint,
    [
        Symbol("gi_state.gi_mean"), Symbol("gi_state.gi_sd"),
        Symbol("inc_state.delay_mean"), Symbol("inc_state.delay_sd"),
    ];
    digits = 2, labels = display_names
);
Show infection-delay summary table
| Row | Quantity | Lower 90% | Lower 60% | Lower 30% | Upper 30% | Upper 60% | Upper 90% |
|---|---|---|---|---|---|---|---|
| String | Float64 | Float64 | Float64 | Float64 | Float64 | Float64 | |
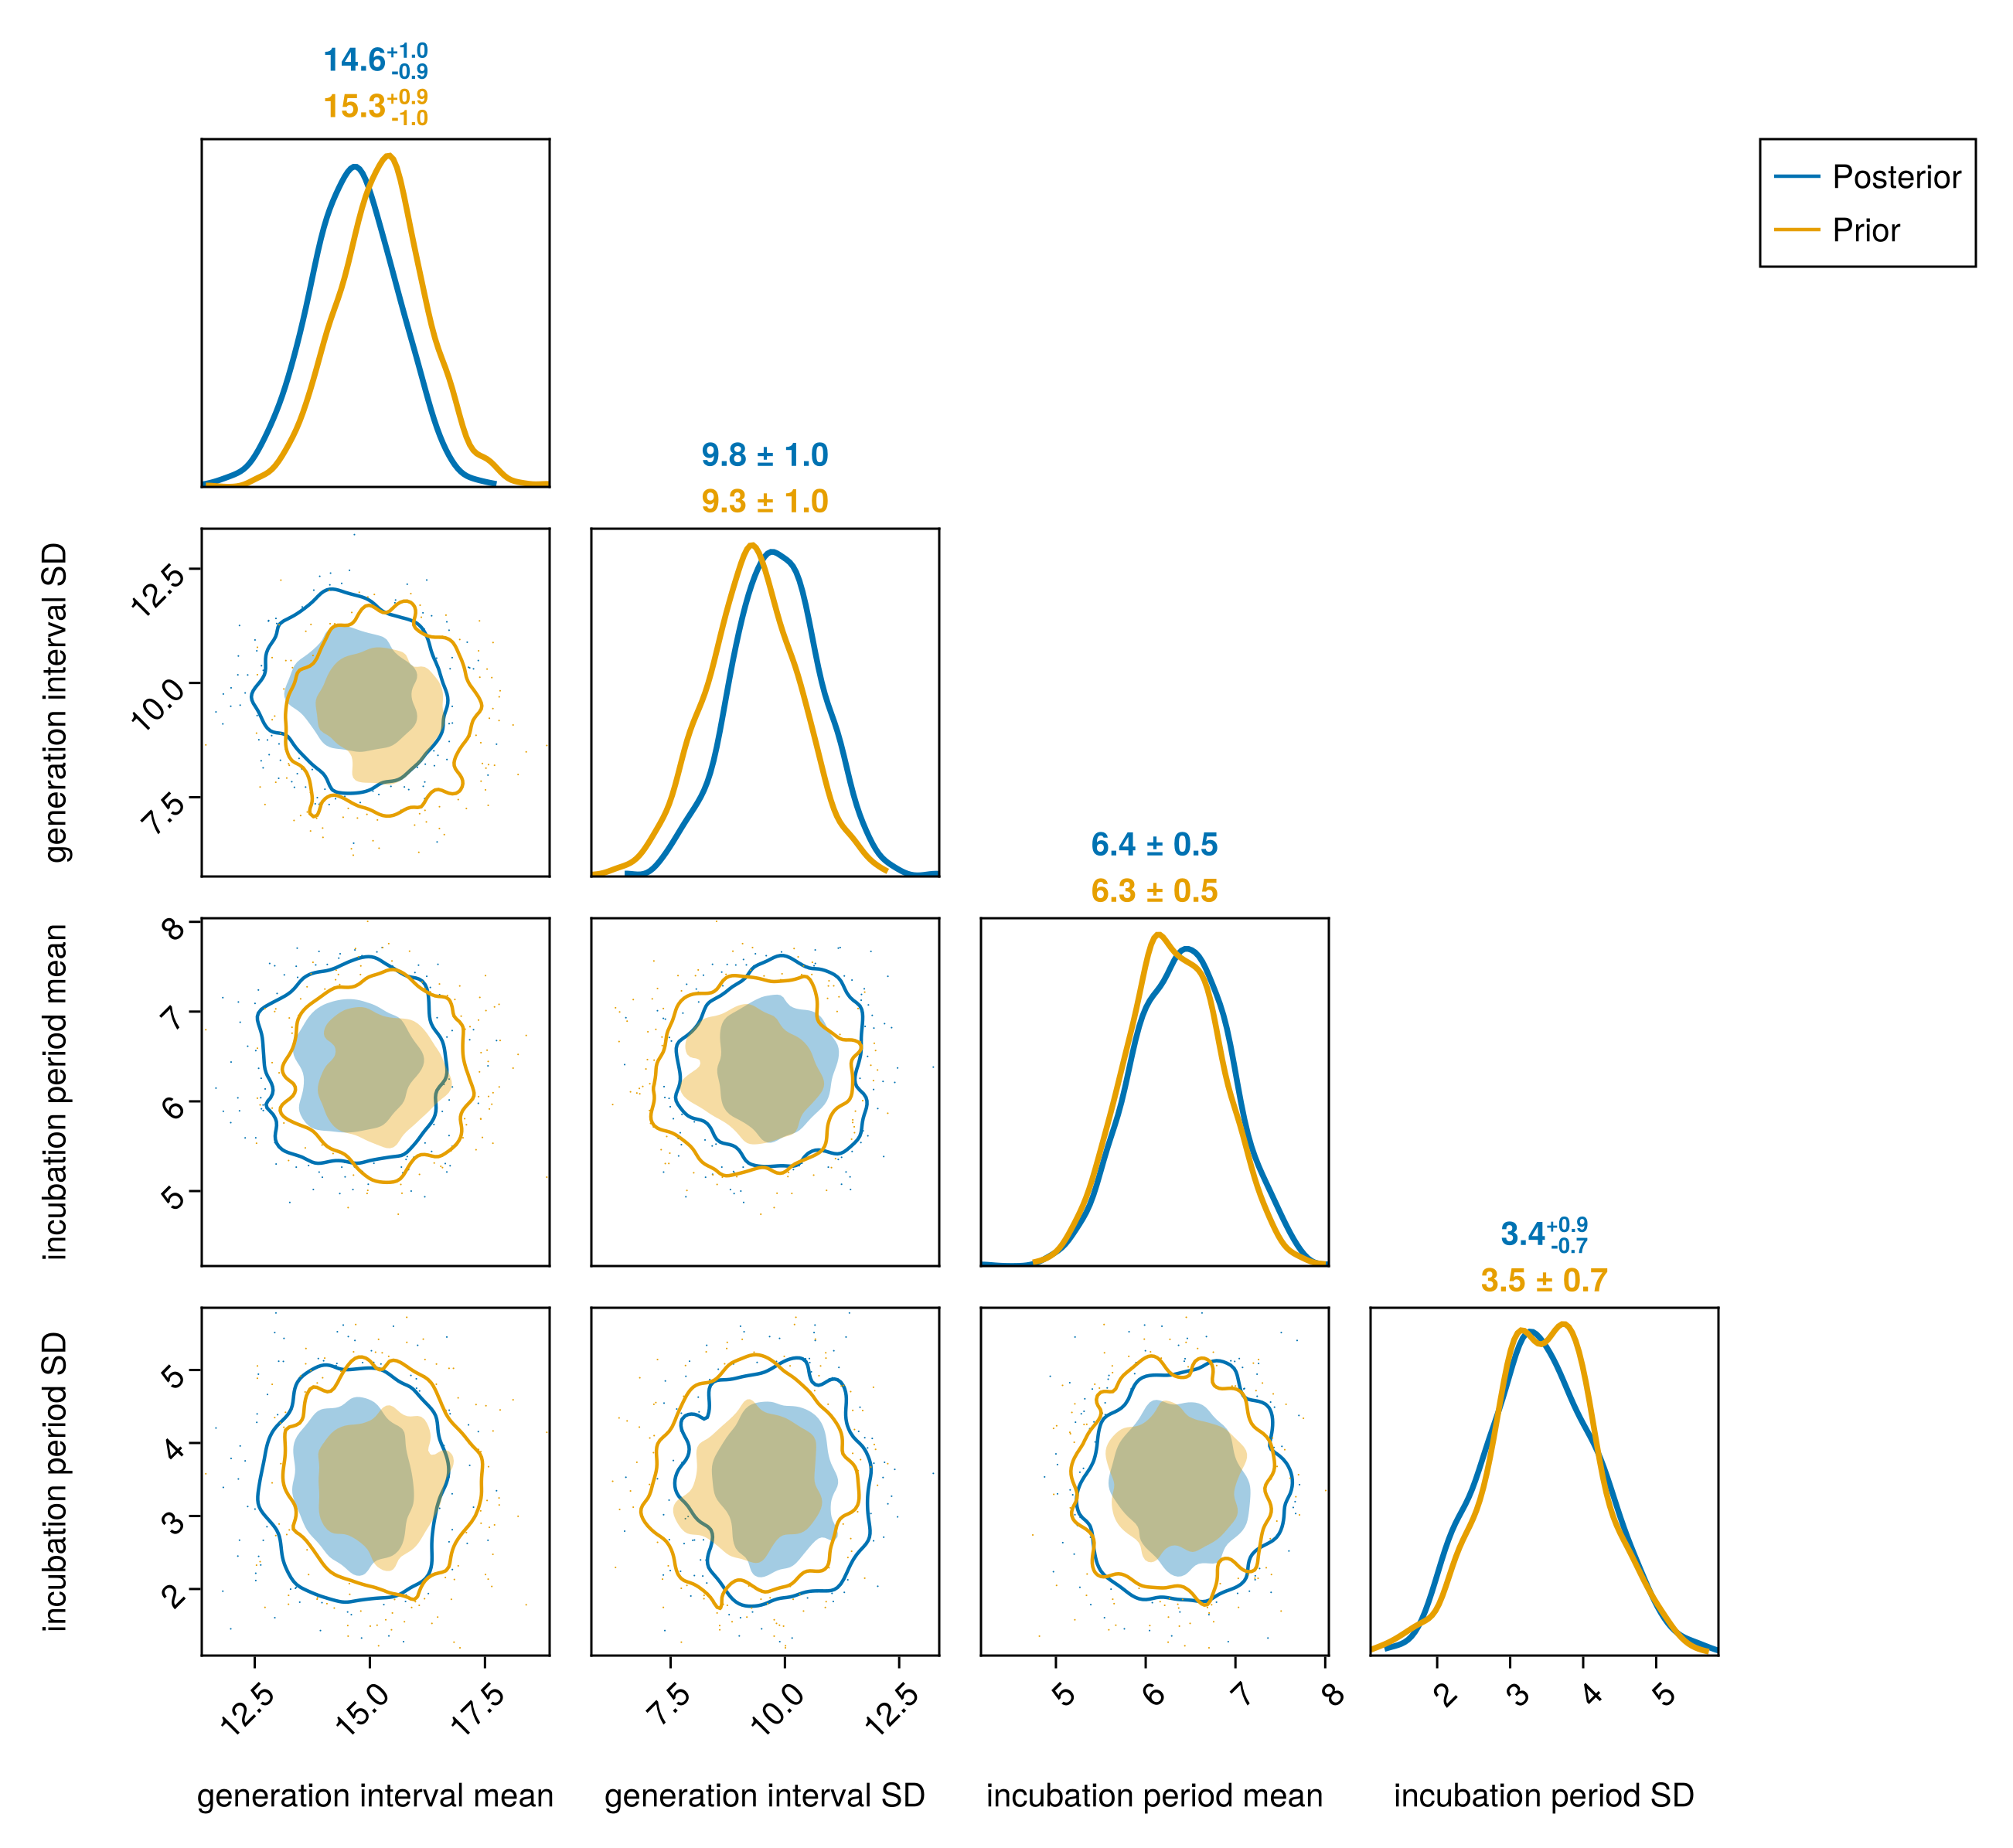
| 1 | generation interval mean | 13.0 | 13.82 | 14.23 | 14.98 | 15.44 | 16.19 |
| 2 | generation interval SD | 8.16 | 8.98 | 9.4 | 10.19 | 10.65 | 11.41 |
| 3 | incubation period mean | 5.52 | 5.9 | 6.18 | 6.62 | 6.86 | 7.27 |
| 4 | incubation period SD | 2.18 | 2.77 | 3.13 | 3.72 | 4.11 | 4.74 |
Infection-delay pair plot (prior overlaid)
infection_delay_pair_fig = plot_pair(
    chn_joint,
    [
        Symbol("gi_state.gi_mean"), Symbol("gi_state.gi_sd"),
        Symbol("inc_state.delay_mean"), Symbol("inc_state.delay_sd"),
    ];
    prior = prior_chn, labels = display_names
);
Reproduction number over time
Reproduction-number trajectory
# `rt_start` is the renewal/established-window start the plot shows from;
# `rt_walk_start` is where the random walk's knots begin — `RT_WALK_LEAD`
# days (a month) before the first situation report, matching `bvd_joint`'s
# `rt_walk_lead` — so the chain reconstruction uses the same knot grid the
# model did, floored at the renewal start. R_t is flat at R0 between the two.
rt_fig = plot_rt(
    chn_joint;
    n = obs.n, breakpoint = _BREAKPOINT,
    rt_start = _rt_start_plot,
    rt_walk_start = clamp(_BREAKPOINT - RT_WALK_LEAD, _rt_start_plot, obs.n),
    as_of_date = string(obs.cutoff), seeding = obs.seeding,
    ramp = RT_INTERVENTION_RAMP
);
The same trajectory split by province, the per-province summary and the spatial hyperparameters are on the province estimates page.
Intervention-effect summary table
intervention_effect = vec(
    Array(
        chn_joint[Symbol("rt_state.intervention_effect")]
    )
);
intervention_table = streams_table(
    "Rt multiplier exp(effect)" => exp.(intervention_effect);
    digits = 2
);| Row | Stream | Lower 90% | Lower 60% | Lower 30% | Upper 30% | Upper 60% | Upper 90% |
|---|---|---|---|---|---|---|---|
| String | Float64 | Float64 | Float64 | Float64 | Float64 | Float64 | |
| 1 | Rt multiplier exp(effect) | 0.45 | 0.57 | 0.64 | 0.79 | 0.86 | 0.96 |
Observation delays
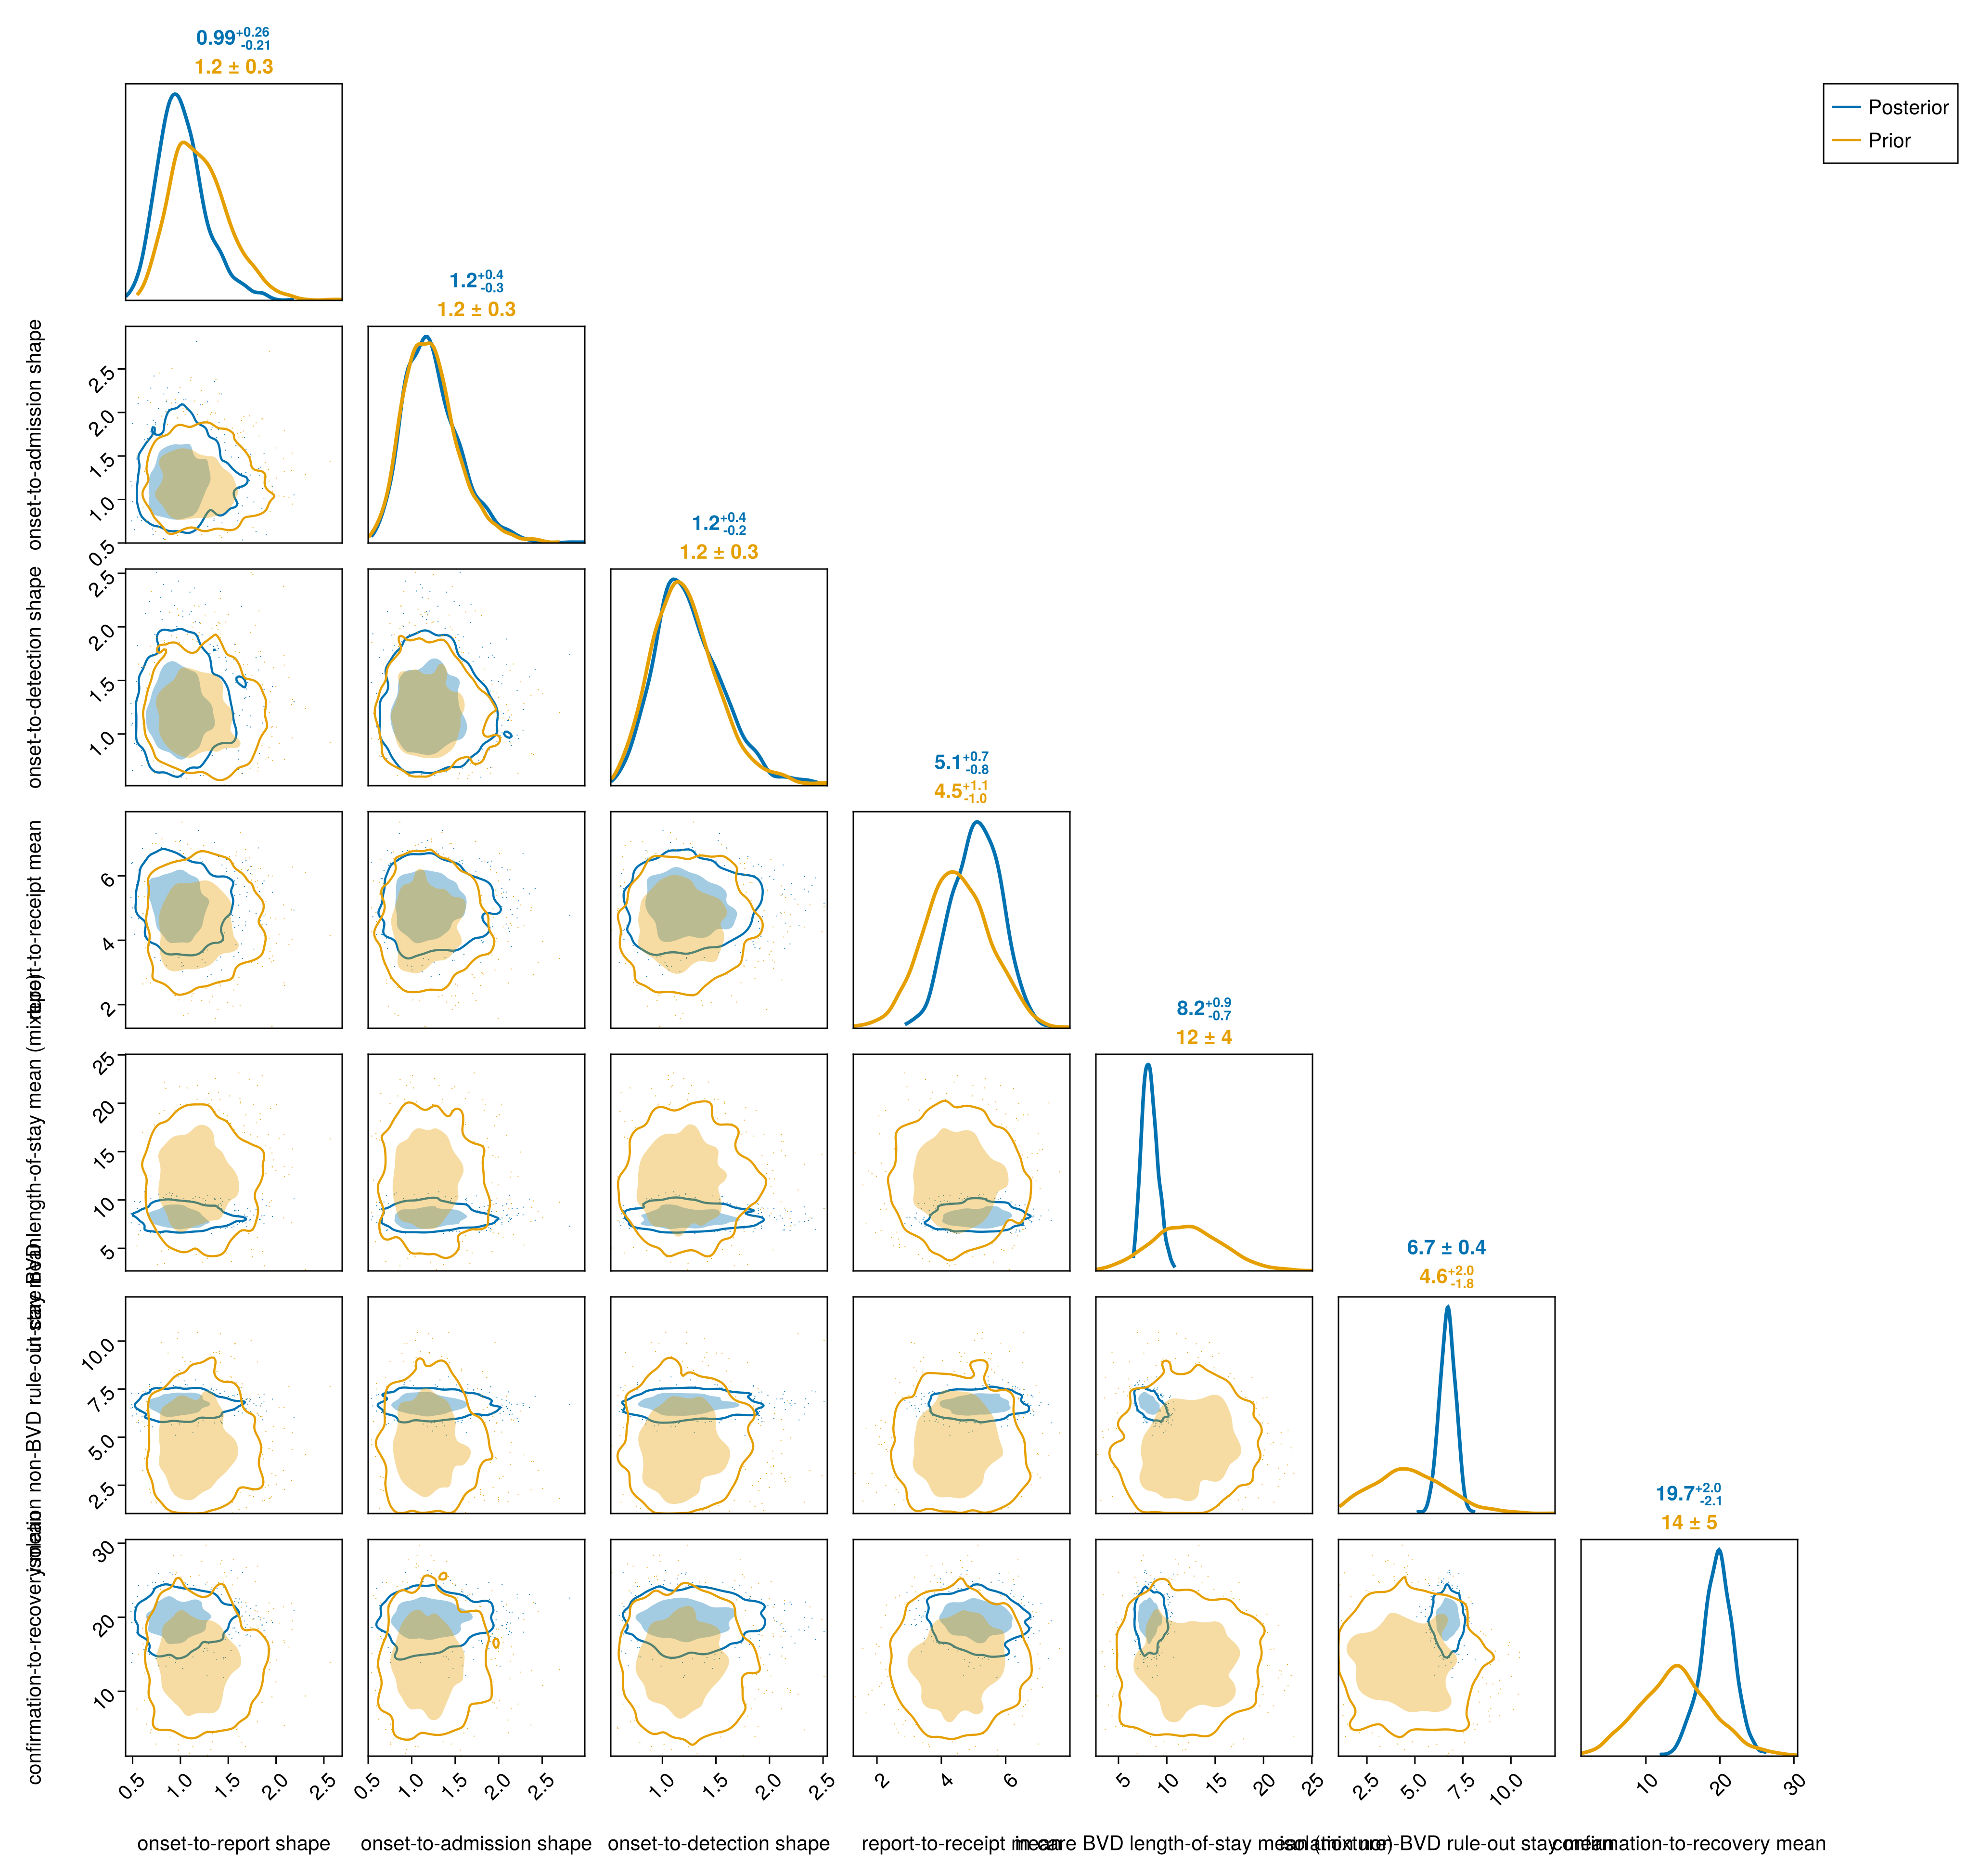
The delays carry latent infections through to each observed event, and the epidemiological process models give their parametrisation and priors.
Observation-delay summary table
obs_delay_summary = summary_table(
    chn_joint,
    [
        Symbol("cases_state.report_state.α"),
        Symbol("cases_state.report_state.θ"),
        Symbol("deaths_state.od_state.oa.α"),
        Symbol("deaths_state.od_state.oa.θ"),
        Symbol("deaths_state.od_state.ad.α"),
        Symbol("deaths_state.od_state.ad.θ"),
        Symbol("exports_state.detect_state.α"),
        Symbol("exports_state.detect_state.θ"),
        Symbol("confirmed_state.receipt_state.d.delay_mean"),
        Symbol("confirmed_state.receipt_state.d.delay_sd"),
        :isolation_bvd_los_mean,
        :isolation_ruleout_los_mean,
        :recovery_delay_mean,
    ];
    digits = 2, labels = display_names
);
Show observation-delay summary table
| Row | Quantity | Lower 90% | Lower 60% | Lower 30% | Upper 30% | Upper 60% | Upper 90% |
|---|---|---|---|---|---|---|---|
| String | Float64 | Float64 | Float64 | Float64 | Float64 | Float64 | |
| 1 | onset-to-report shape | 0.67 | 0.82 | 0.91 | 1.1 | 1.22 | 1.51 |
| 2 | onset-to-report scale | 0.92 | 1.57 | 2.04 | 2.77 | 3.25 | 4.15 |
| 3 | onset-to-admission shape | 0.79 | 0.96 | 1.09 | 1.32 | 1.49 | 1.81 |
| 4 | onset-to-admission scale | 1.93 | 2.92 | 3.42 | 4.3 | 4.81 | 5.79 |
| 5 | admission-to-death shape | 1.43 | 1.81 | 2.04 | 2.43 | 2.68 | 3.1 |
| 6 | admission-to-death scale | 2.58 | 3.43 | 3.91 | 4.77 | 5.27 | 6.22 |
| 7 | onset-to-detection shape | 0.8 | 0.99 | 1.1 | 1.34 | 1.5 | 1.82 |
| 8 | onset-to-detection scale | 1.82 | 2.75 | 3.31 | 4.21 | 4.78 | 5.71 |
| 9 | report-to-receipt mean | 3.86 | 4.43 | 4.81 | 5.41 | 5.74 | 6.34 |
| 10 | report-to-receipt SD | 2.76 | 3.29 | 3.63 | 4.22 | 4.54 | 5.11 |
| 11 | in-care BVD length-of-stay mean (mixture) | 7.07 | 7.58 | 7.89 | 8.49 | 8.88 | 9.66 |
| 12 | isolation non-BVD rule-out stay mean | 6.0 | 6.34 | 6.54 | 6.85 | 7.06 | 7.36 |
| 13 | confirmation-to-recovery mean | 16.16 | 18.03 | 18.95 | 20.5 | 21.46 | 23.24 |
Observation-delay pair plot (prior overlaid)
obs_delay_pair_fig = plot_pair(
    chn_joint,
    [
        Symbol("cases_state.report_state.α"),
        Symbol("deaths_state.od_state.oa.α"),
        Symbol("exports_state.detect_state.α"),
        Symbol("confirmed_state.receipt_state.d.delay_mean"),
        :isolation_bvd_los_mean,
        :isolation_ruleout_los_mean,
        :recovery_delay_mean,
    ];
    prior = prior_chn, labels = display_names
);
Surveillance parameters
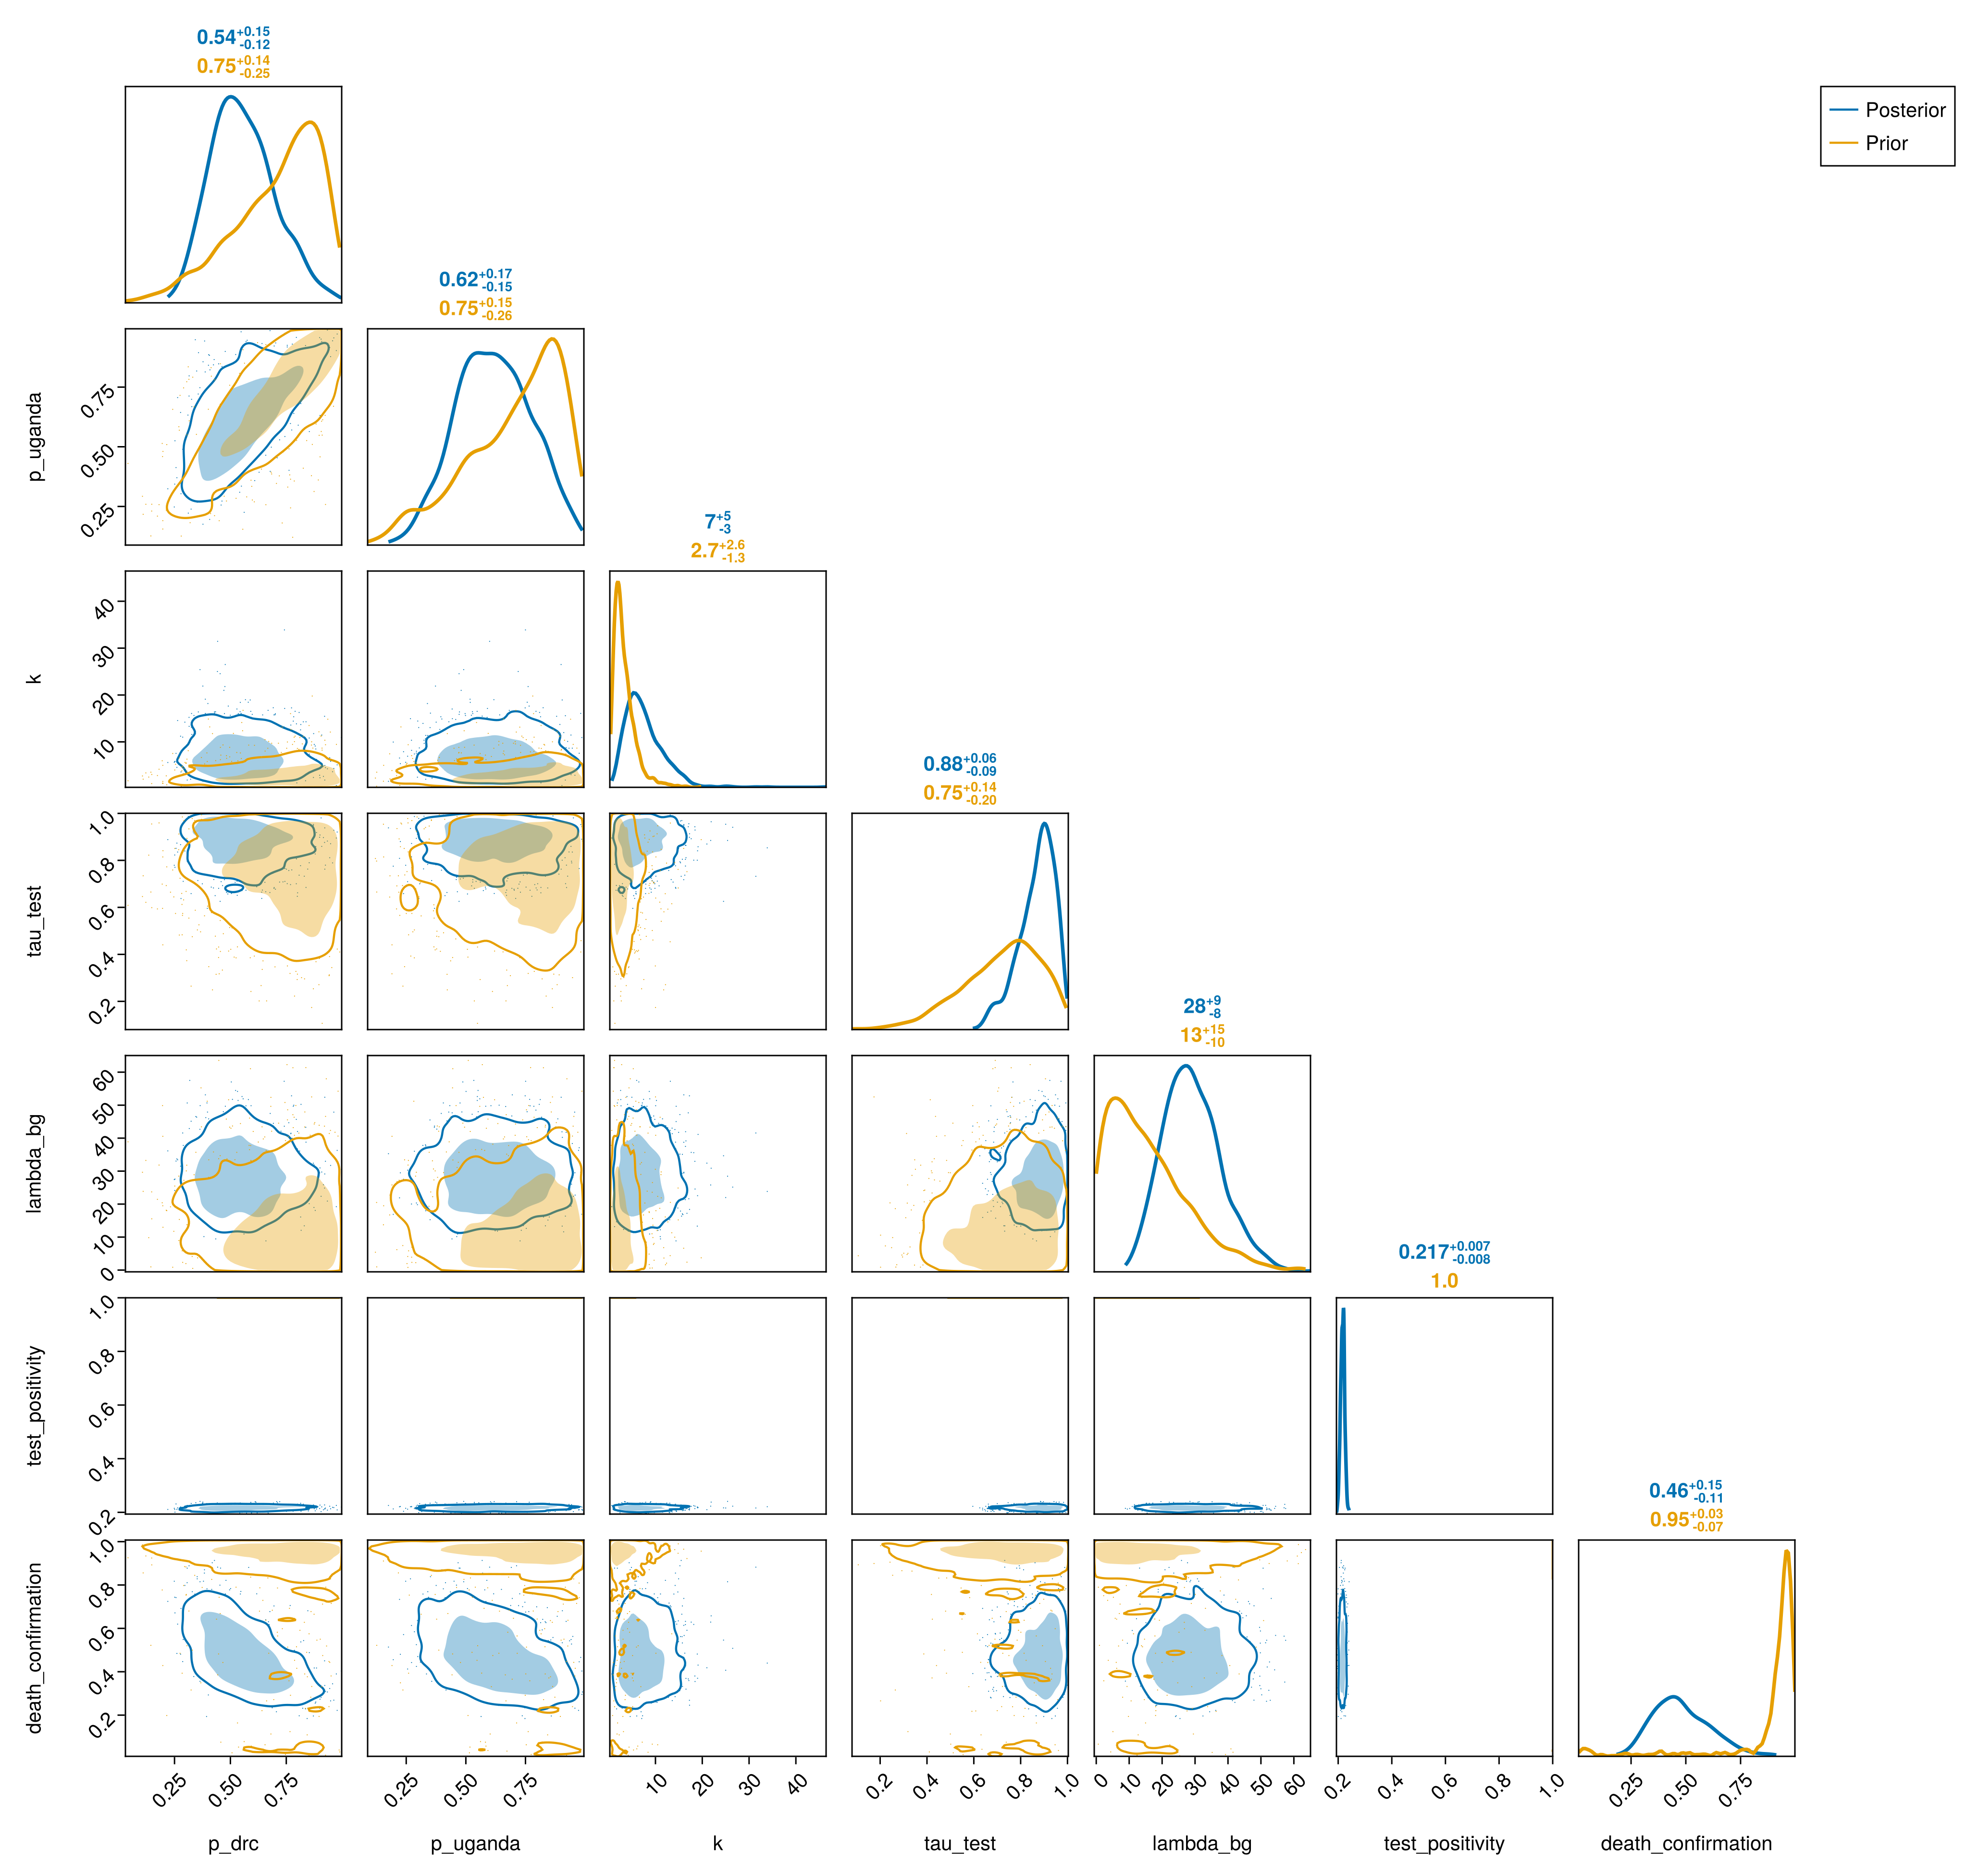
The surveillance parameters cover the reporting fractions, the stream dispersions, the laboratory pipeline and the isolation and recovered streams. The six count streams each have a negative-binomial dispersion, partially pooled around a population-level dispersion
Surveillance-parameter summary table
surveillance_summary = summary_table(
    chn_joint,
    [
        :p_drc, :p_uganda, :k, :k_cases, :k_deaths, :k_confirmed,
        :k_confirmed_deaths, :dispersion_sd, :tau_test,
        :specimens_per_suspect, :lambda_bg,
        :suspected_positivity, :test_positivity, :expected_confirmed_T,
        :expected_analysed_T, :death_ascertainment, :background_cfr,
        :tau_death, :death_composition,
        :death_confirmation, :expected_confirmed_deaths_T,
        :isolation_admission, :isolation_dispersion, :expected_isolation_T,
        :expected_bed_demand_T, :bed_capacity, :bed_shortfall_T,
        :incare_cfr, :incare_cfr_modifier, :incare_confirm_modifier,
        :isolation_death_los_mean,
        :isolation_recovery_los_mean, :abscond_fraction,
        :recovery_probability, :recovered_dispersion, :expected_recovered_T,
    ];
    digits = 3
);
Show surveillance-parameter summary table
| Row | Quantity | Lower 90% | Lower 60% | Lower 30% | Upper 30% | Upper 60% | Upper 90% |
|---|---|---|---|---|---|---|---|
| String | Float64 | Float64 | Float64 | Float64 | Float64 | Float64 | |
| 1 | p_drc | 0.343 | 0.435 | 0.49 | 0.604 | 0.673 | 0.815 |
| 2 | p_uganda | 0.361 | 0.483 | 0.553 | 0.686 | 0.757 | 0.886 |
| 3 | k | 2.547 | 4.214 | 5.438 | 8.244 | 10.41 | 15.357 |
| 4 | k_cases | 9.998 | 11.248 | 11.974 | 13.318 | 14.152 | 15.619 |
| 5 | k_deaths | 6.272 | 7.905 | 9.134 | 11.444 | 13.14 | 16.724 |
| 6 | k_confirmed | 7.001 | 7.805 | 8.246 | 9.082 | 9.633 | 10.698 |
| 7 | k_confirmed_deaths | 7.567 | 9.102 | 10.076 | 11.759 | 13.08 | 15.837 |
| 8 | dispersion_sd | 0.59 | 0.715 | 0.821 | 1.015 | 1.139 | 1.435 |
| 9 | tau_test | 0.718 | 0.805 | 0.848 | 0.909 | 0.938 | 0.971 |
| 10 | specimens_per_suspect | 1.1 | 1.166 | 1.207 | 1.3 | 1.371 | 1.52 |
| 11 | lambda_bg | 16.586 | 21.838 | 25.092 | 32.119 | 36.503 | 44.515 |
| 12 | suspected_positivity | 0.194 | 0.208 | 0.216 | 0.234 | 0.249 | 0.283 |
| 13 | test_positivity | 0.205 | 0.21 | 0.214 | 0.22 | 0.223 | 0.229 |
| 14 | expected_confirmed_T | 9799.13 | 10065.7 | 10237.3 | 10509.8 | 10654.3 | 10949.8 |
| 15 | expected_analysed_T | 47774.0 | 48860.5 | 49459.0 | 50607.8 | 51276.7 | 52339.1 |
| 16 | death_ascertainment | 0.788 | 0.851 | 0.88 | 0.916 | 0.932 | 0.954 |
| 17 | background_cfr | 0.076 | 0.133 | 0.168 | 0.231 | 0.266 | 0.324 |
| 18 | tau_death | 0.448 | 0.51 | 0.555 | 0.644 | 0.704 | 0.819 |
| 19 | death_composition | 0.29 | 0.369 | 0.426 | 0.543 | 0.625 | 0.768 |
| 20 | death_confirmation | 0.29 | 0.367 | 0.416 | 0.517 | 0.591 | 0.717 |
| 21 | expected_confirmed_deaths_T | 4204.21 | 4315.67 | 4376.97 | 4479.13 | 4550.48 | 4668.41 |
| 22 | isolation_admission | 0.293 | 0.304 | 0.311 | 0.323 | 0.331 | 0.351 |
| 23 | isolation_dispersion | 381.148 | 487.927 | 565.618 | 739.02 | 874.303 | 1192.48 |
| 24 | expected_isolation_T | 1038.13 | 1129.26 | 1153.55 | 1192.8 | 1214.03 | 1251.13 |
| 25 | expected_bed_demand_T | 1108.29 | 1143.43 | 1162.08 | 1197.76 | 1219.09 | 1258.36 |
| 26 | bed_capacity | 1045.16 | 1305.15 | 1453.84 | 1756.57 | 1952.52 | 2319.49 |
| 27 | bed_shortfall_T | 0.0 | 0.0 | 0.0 | 0.0 | 0.0 | 155.984 |
| 28 | incare_cfr | 0.421 | 0.445 | 0.462 | 0.489 | 0.508 | 0.537 |
| 29 | incare_cfr_modifier | -0.523 | -0.312 | -0.176 | 0.057 | 0.194 | 0.44 |
| 30 | incare_confirm_modifier | 0.732 | 0.908 | 1.036 | 1.293 | 1.482 | 1.853 |
| 31 | isolation_death_los_mean | 2.101 | 3.771 | 4.825 | 6.63 | 7.855 | 9.723 |
| 32 | isolation_recovery_los_mean | 6.31 | 8.413 | 9.455 | 11.243 | 12.367 | 14.344 |
| 33 | abscond_fraction | 0.009 | 0.01 | 0.01 | 0.011 | 0.011 | 0.012 |
| 34 | recovery_probability | 0.267 | 0.283 | 0.291 | 0.305 | 0.314 | 0.331 |
| 35 | recovered_dispersion | 5.352 | 6.225 | 6.716 | 7.743 | 8.429 | 9.744 |
| 36 | expected_recovered_T | 2484.74 | 2565.83 | 2610.09 | 2692.55 | 2743.82 | 2830.96 |
Surveillance-parameter pair plot (prior overlaid)
surveillance_pair_fig = plot_pair(
    chn_joint,
    [
        :p_drc, :p_uganda, :k, :tau_test, :lambda_bg, :test_positivity,
        :death_confirmation,
    ];
    prior = prior_chn
);
Model against observed
Whether the fit reproduces the data it was fitted to, stream by stream, is on the in-sample checks page.
Symptom-onset reporting delay and ascertainment
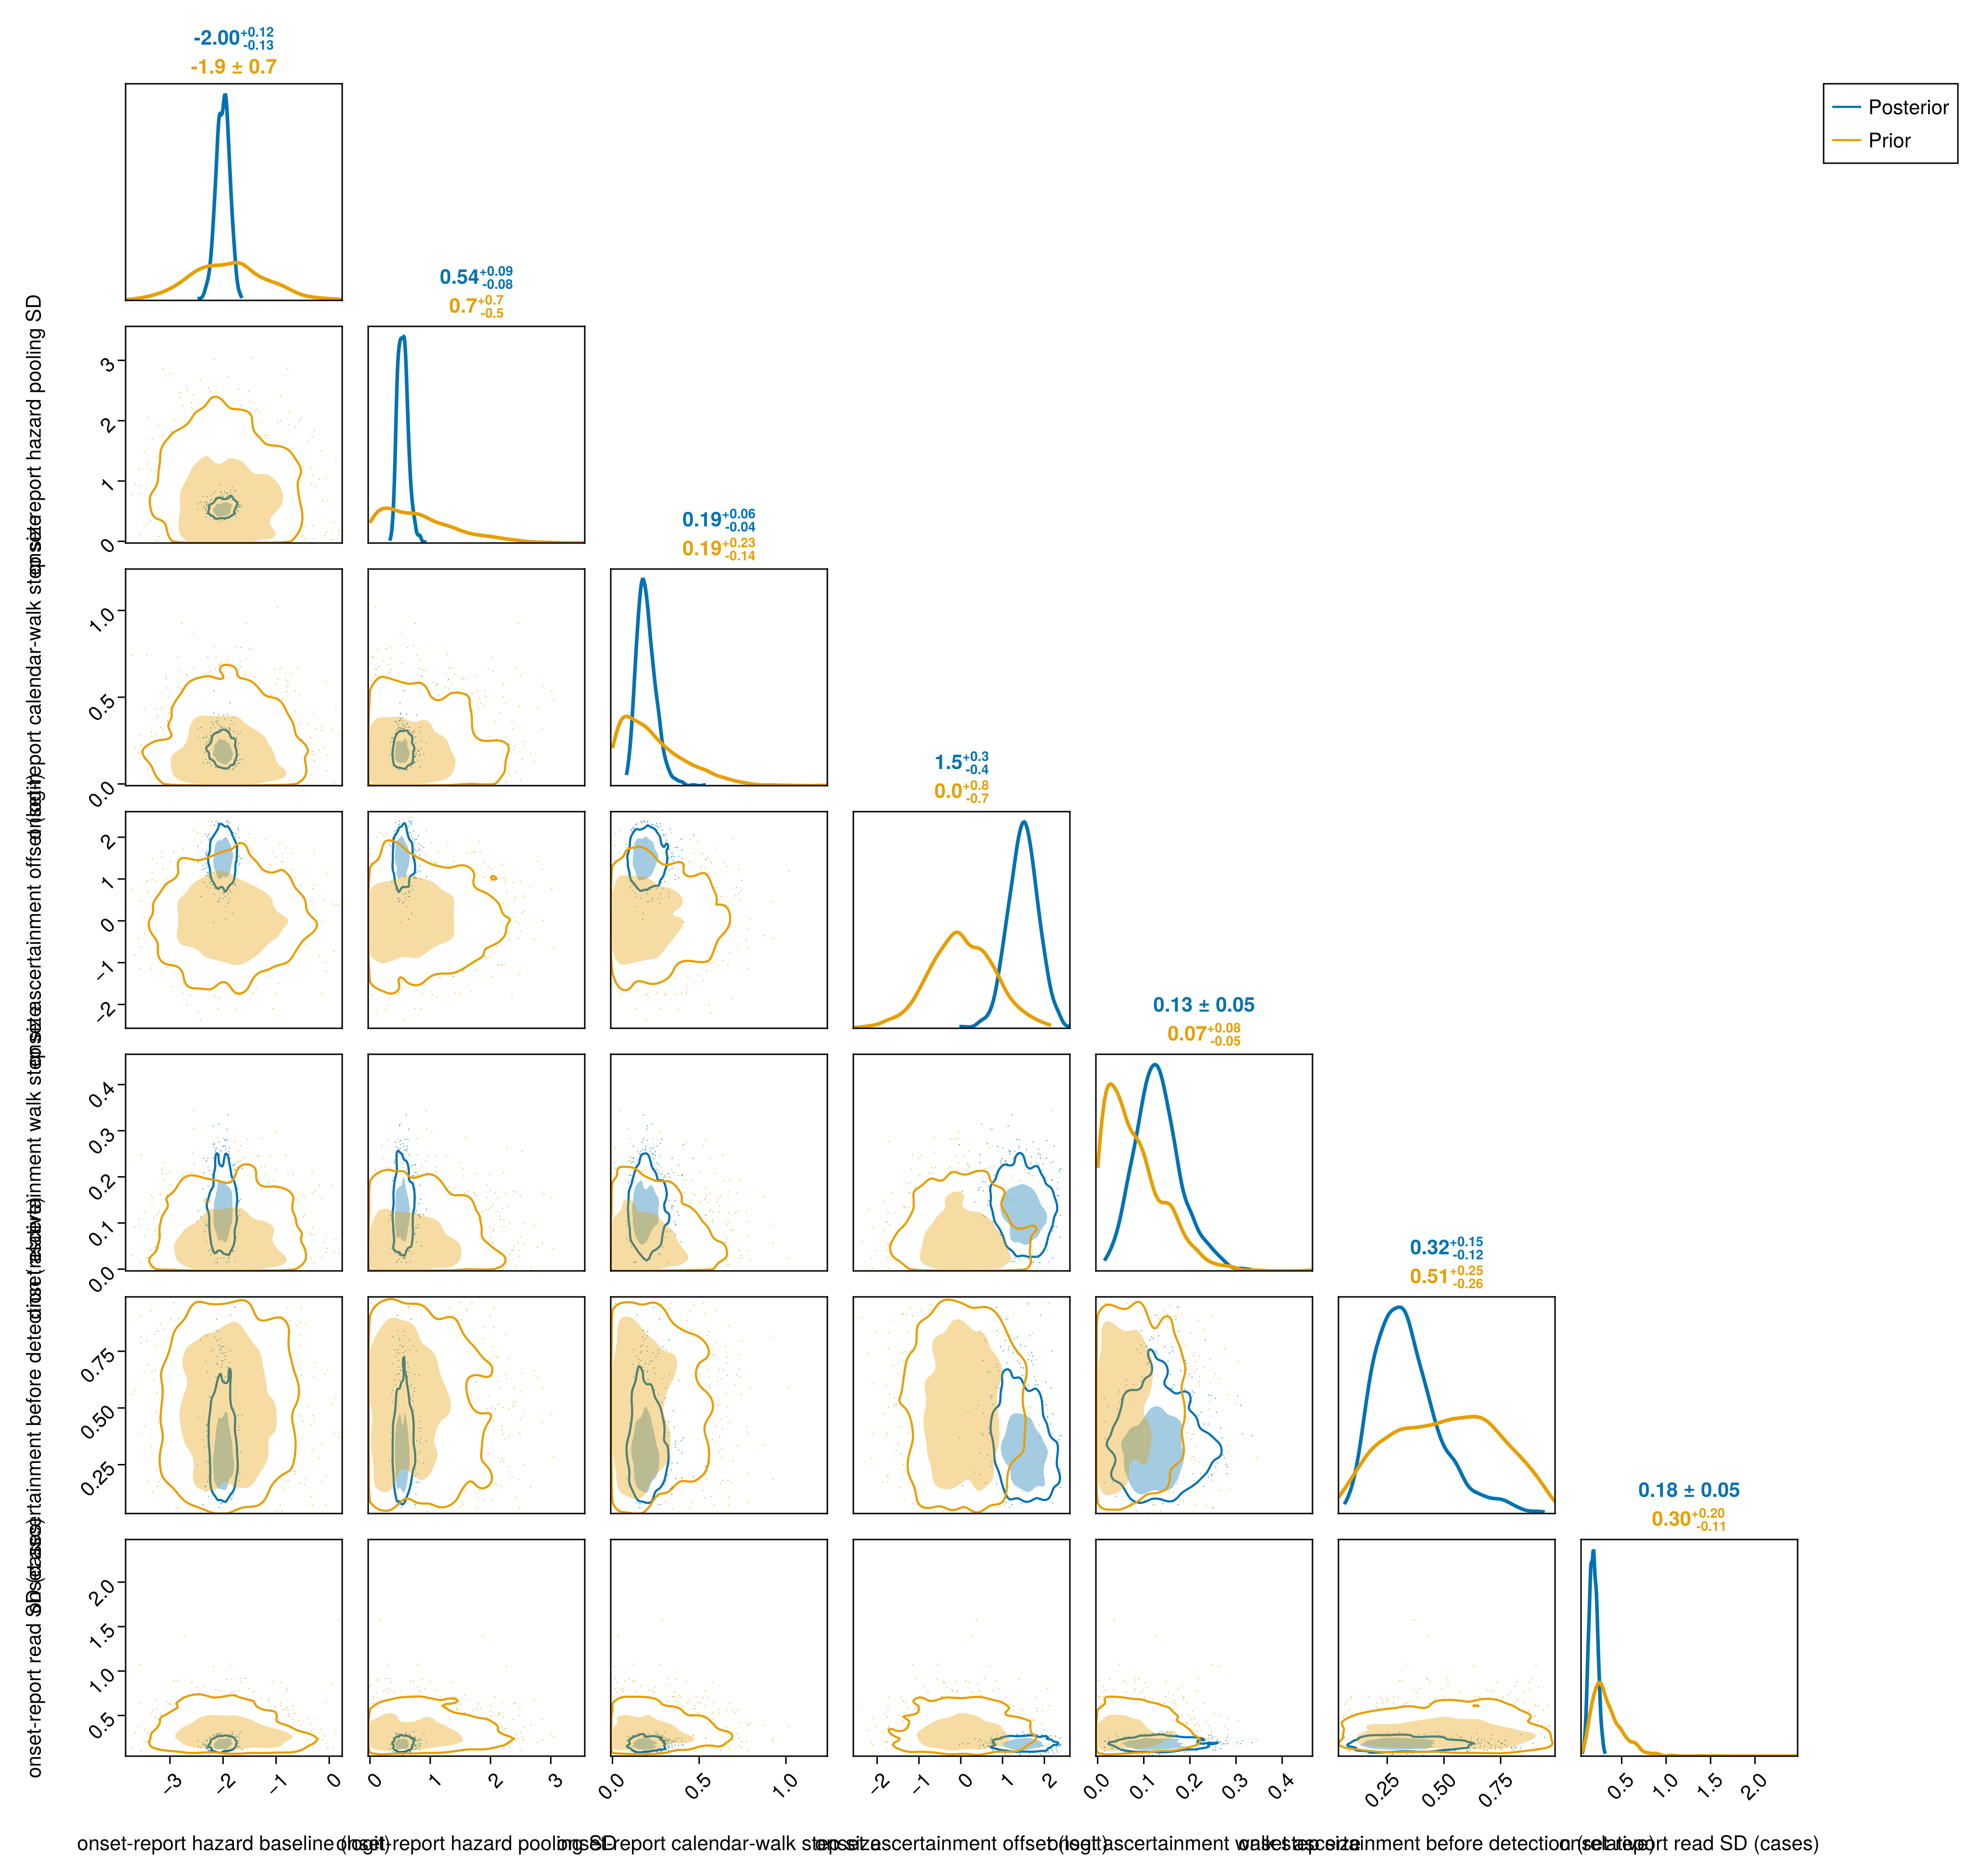
The symptom-onset reporting delay Methods section defines the quantities below.
Reconstruct the onset-report hazard and calendar walk
# The report-date grid the calendar walk spans, `_onset_grid_start` to
# `_onset_grid_end`, is a fixed function of the digitised triangle rather
# than chain contents, so the shared setup builds it once from
# `obs.onset_curve_history`.
# Every posterior draw's `logit_h0` (the baseline delay hazard), `γ` (the
# report-date calendar walk) and ascertainment level, read off the fitted
# model's own onset-reporting state at each draw.
_onset_hazard = fitted_onset_hazard(fit_model("joint"), chn_joint)

# A representative onset day (the median scored onset date), so the 7-day
# fraction below reflects a typical, not an edge, calendar day.
_onset_u_ref = isempty(obs.onset_curve_history.onset_days) ?
    _onset_grid_start :
    round(Int, quantile(obs.onset_curve_history.onset_days, 0.5))
# The delay profile is the normalised delay CDF, which reaches one by
# construction, so the 7-day fraction is read straight off it.
_onset_7d_fraction = [
    onset_report_G(
        6, _onset_hazard.logit_h0[i],
        _onset_hazard.γ[i], _onset_u_ref,
        _onset_grid_start
    )
        for i in eachindex(_onset_hazard.logit_h0)
]
filter!(isfinite, _onset_7d_fraction)

# Per-draw median ascertainment over the onset dates the ascertainment
# walk spans, then summarised across draws. Ascertainment is its own
# level rather than the delay hazard's asymptote (see the [symptom-onset
# reporting delay](@ref "Symptom-onset reporting delay") Methods section).
_onset_ascertainment_draws = [
    quantile(_onset_hazard.alpha[i], 0.5)
        for i in eachindex(_onset_hazard.alpha)
]

_onset_labels = merge(
    display_names,
    Dict(
        Symbol("onset_report_state.η0") => "onset-report hazard baseline (logit)",
        Symbol("onset_report_state.σ_h0") => "onset-report hazard pooling SD",
        Symbol("onset_report_state.σ_γ") => "onset-report calendar-walk step size",
        Symbol("onset_report_state.β") => "onset ascertainment offset (logit)",
        Symbol("onset_report_state.σ_a") => "onset ascertainment walk step size",
        Symbol("onset_report_state.ρ") =>
            "onset ascertainment before detection (relative)",
        Symbol("onset_report_state.τ") => "onset-report read SD (cases)"
    )
);
Symptom-onset reporting-delay summary table
# Derived-quantity rows built with the same pre-prettify column schema
# `summary_table` uses, so they `vcat` cleanly onto its output.
onset_derived_raw = DataFrame(
    quantity = String[],
    lower_90 = Float64[], lower_60 = Float64[],
    lower_30 = Float64[], upper_30 = Float64[],
    upper_60 = Float64[], upper_90 = Float64[]
)
for (label, draws) in [
        (
            "share of eventual reports arriving within 7 days (median onset date)",
            _onset_7d_fraction,
        ),
        ("median modelled ascertainment", _onset_ascertainment_draws),
    ]
    s = posterior_summary(draws)
    push!(
        onset_derived_raw,
        (
            label, round(s.lo90; digits = 3), round(s.lo60; digits = 3),
            round(s.lo30; digits = 3), round(s.hi30; digits = 3),
            round(s.hi60; digits = 3), round(s.hi90; digits = 3),
        )
    )
end
onset_derived_table = BVDOutbreakSize._prettify(onset_derived_raw)

onset_summary = vcat(
    summary_table(
        chn_joint,
        [
            Symbol("onset_report_state.η0"), Symbol("onset_report_state.σ_h0"),
            Symbol("onset_report_state.σ_γ"),
            Symbol("onset_report_state.τ"), Symbol("onset_report_state.ρ"),
        ];
        digits = 3, labels = _onset_labels
    ),
    onset_derived_table
);
Show symptom-onset reporting-delay summary table
| Row | Quantity | Lower 90% | Lower 60% | Lower 30% | Upper 30% | Upper 60% | Upper 90% |
|---|---|---|---|---|---|---|---|
| String | Float64 | Float64 | Float64 | Float64 | Float64 | Float64 | |
| 1 | onset-report hazard baseline (logit) | -2.217 | -2.111 | -2.053 | -1.953 | -1.902 | -1.802 |
| 2 | onset-report hazard pooling SD | 0.422 | 0.467 | 0.503 | 0.575 | 0.615 | 0.7 |
| 3 | onset-report calendar-walk step size | 0.118 | 0.148 | 0.17 | 0.209 | 0.24 | 0.297 |
| 4 | onset-report read SD (cases) | 0.11 | 0.141 | 0.161 | 0.197 | 0.218 | 0.252 |
| 5 | onset ascertainment before detection (relative) | 0.15 | 0.215 | 0.266 | 0.367 | 0.448 | 0.615 |
| 6 | share of eventual reports arriving within 7 days (median onset date) | 0.501 | 0.518 | 0.527 | 0.542 | 0.551 | 0.567 |
| 7 | median modelled ascertainment | 0.242 | 0.297 | 0.33 | 0.399 | 0.444 | 0.53 |
Symptom-onset reporting-delay pair plot (prior overlaid)
onset_pair_fig = plot_pair(
    chn_joint,
    [
        Symbol("onset_report_state.η0"), Symbol("onset_report_state.σ_h0"),
        Symbol("onset_report_state.σ_γ"),
        Symbol("onset_report_state.β"), Symbol("onset_report_state.σ_a"),
        Symbol("onset_report_state.ρ"), Symbol("onset_report_state.τ"),
    ];
    prior = prior_chn, labels = _onset_labels
);
The nowcast of each digitised snapshot and the check of the latest figure by onset date are on the in-sample checks page.
Counterfactual: lower bound under no further transmission
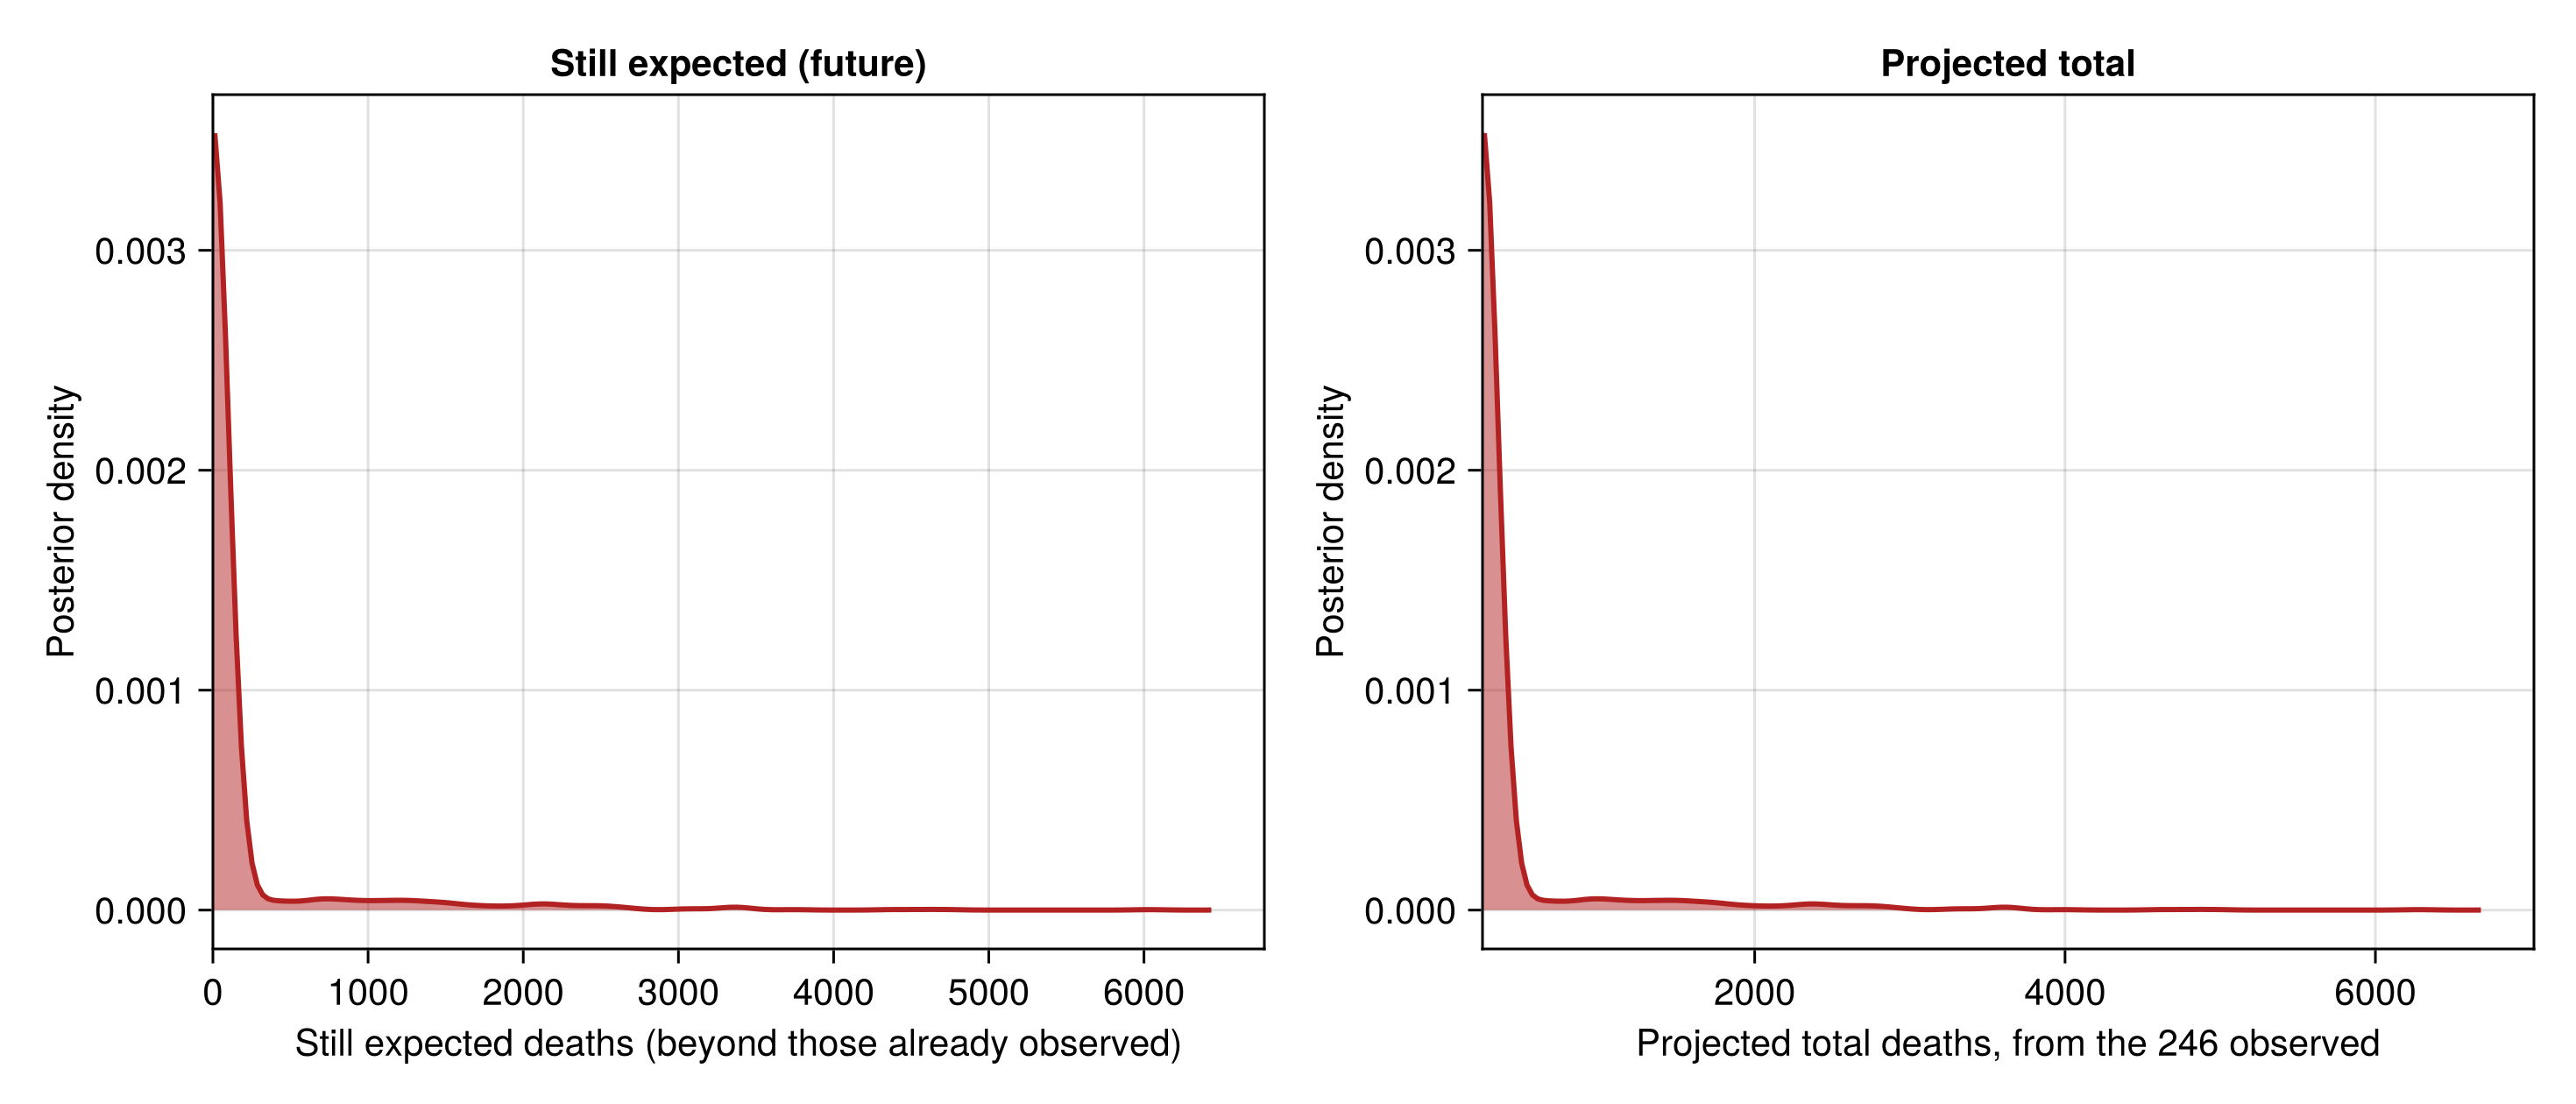
The no-onward-transmission counterfactual projects the deaths still to come if transmission stopped at the report date.
Project no-onward deaths and summarise
no_onward = predict_no_onward_deaths(
    chn_joint; obs_deaths = obs.total_deaths
);

no_onward_table = streams_table(
    "no-onward total" => no_onward.total_projected;
    digits = 0
);| Row | Stream | Lower 90% | Lower 60% | Lower 30% | Upper 30% | Upper 60% | Upper 90% |
|---|---|---|---|---|---|---|---|
| String | Float64 | Float64 | Float64 | Float64 | Float64 | Float64 | |
| 1 | no-onward total | 246.0 | 246.0 | 246.0 | 246.0 | 246.0 | 1364.0 |
No-onward projected-deaths plot
no_onward_fig = plot_no_onward_deaths(
    no_onward; obs_deaths = obs.total_deaths
);
Confirmed case-fatality ratio
The delay-corrected confirmed CFR is set against the naive confirmed ratio and the structural CFR the joint model fits.
Compute the confirmed-CFR comparison
confirmed_cfr = delay_corrected_confirmed_cfr(
    chn_joint;
    obs_confirmed = obs.confirmed_cases,
    obs_confirmed_deaths = obs.confirmed_deaths
);

confirmed_cfr_summary = confirmed_cfr_table(confirmed_cfr);

# Summary line carrying the data-anchored corrected estimate alongside the
# infection-based structural CFR, so both can be quoted together.
confirmed_cfr_line = let r = confirmed_cfr
    pct(x) = round(100 * x; digits = 1)
    corr = filter(isfinite, r.corrected)
    struc = filter(isfinite, r.structural)
    cs = posterior_summary(corr)
    ss = posterior_summary(struc)
    Markdown.parse(
        string(
            "**Delay-corrected confirmed CFR:** ",
            pct(quantile(corr, 0.5)), "% (90% CrI ",
            pct(cs.lo90), "–", pct(cs.hi90), "%), versus a naive confirmed ratio ",
            "of ", pct(r.naive_observed), "% and a structural (infection-based) ",
            "CFR of ", pct(quantile(struc, 0.5)), "% (90% CrI ",
            pct(ss.lo90), "–", pct(ss.hi90), "%)."
        )
    )
end;
Delay-corrected confirmed CFR: 46.9% (90% CrI 43.3–50.8%), versus a naive confirmed ratio of 48.3% and a structural (infection-based) CFR of 49.1% (90% CrI 38.0–60.0%).
| Row | Quantity | Estimate |
|---|---|---|
| String | String | |
| 1 | Delay-corrected confirmed CFR | 43.3–50.8% |
| 2 | Structural (infection-based) CFR | 38.0–60.0% |
| 3 | Uncorrected modelled confirmed ratio | 39.7–46.1% |
| 4 | Naive observed confirmed ratio | 48.3% |
Confirmed-CFR density plot
confirmed_cfr_fig = plot_confirmed_cfr(confirmed_cfr);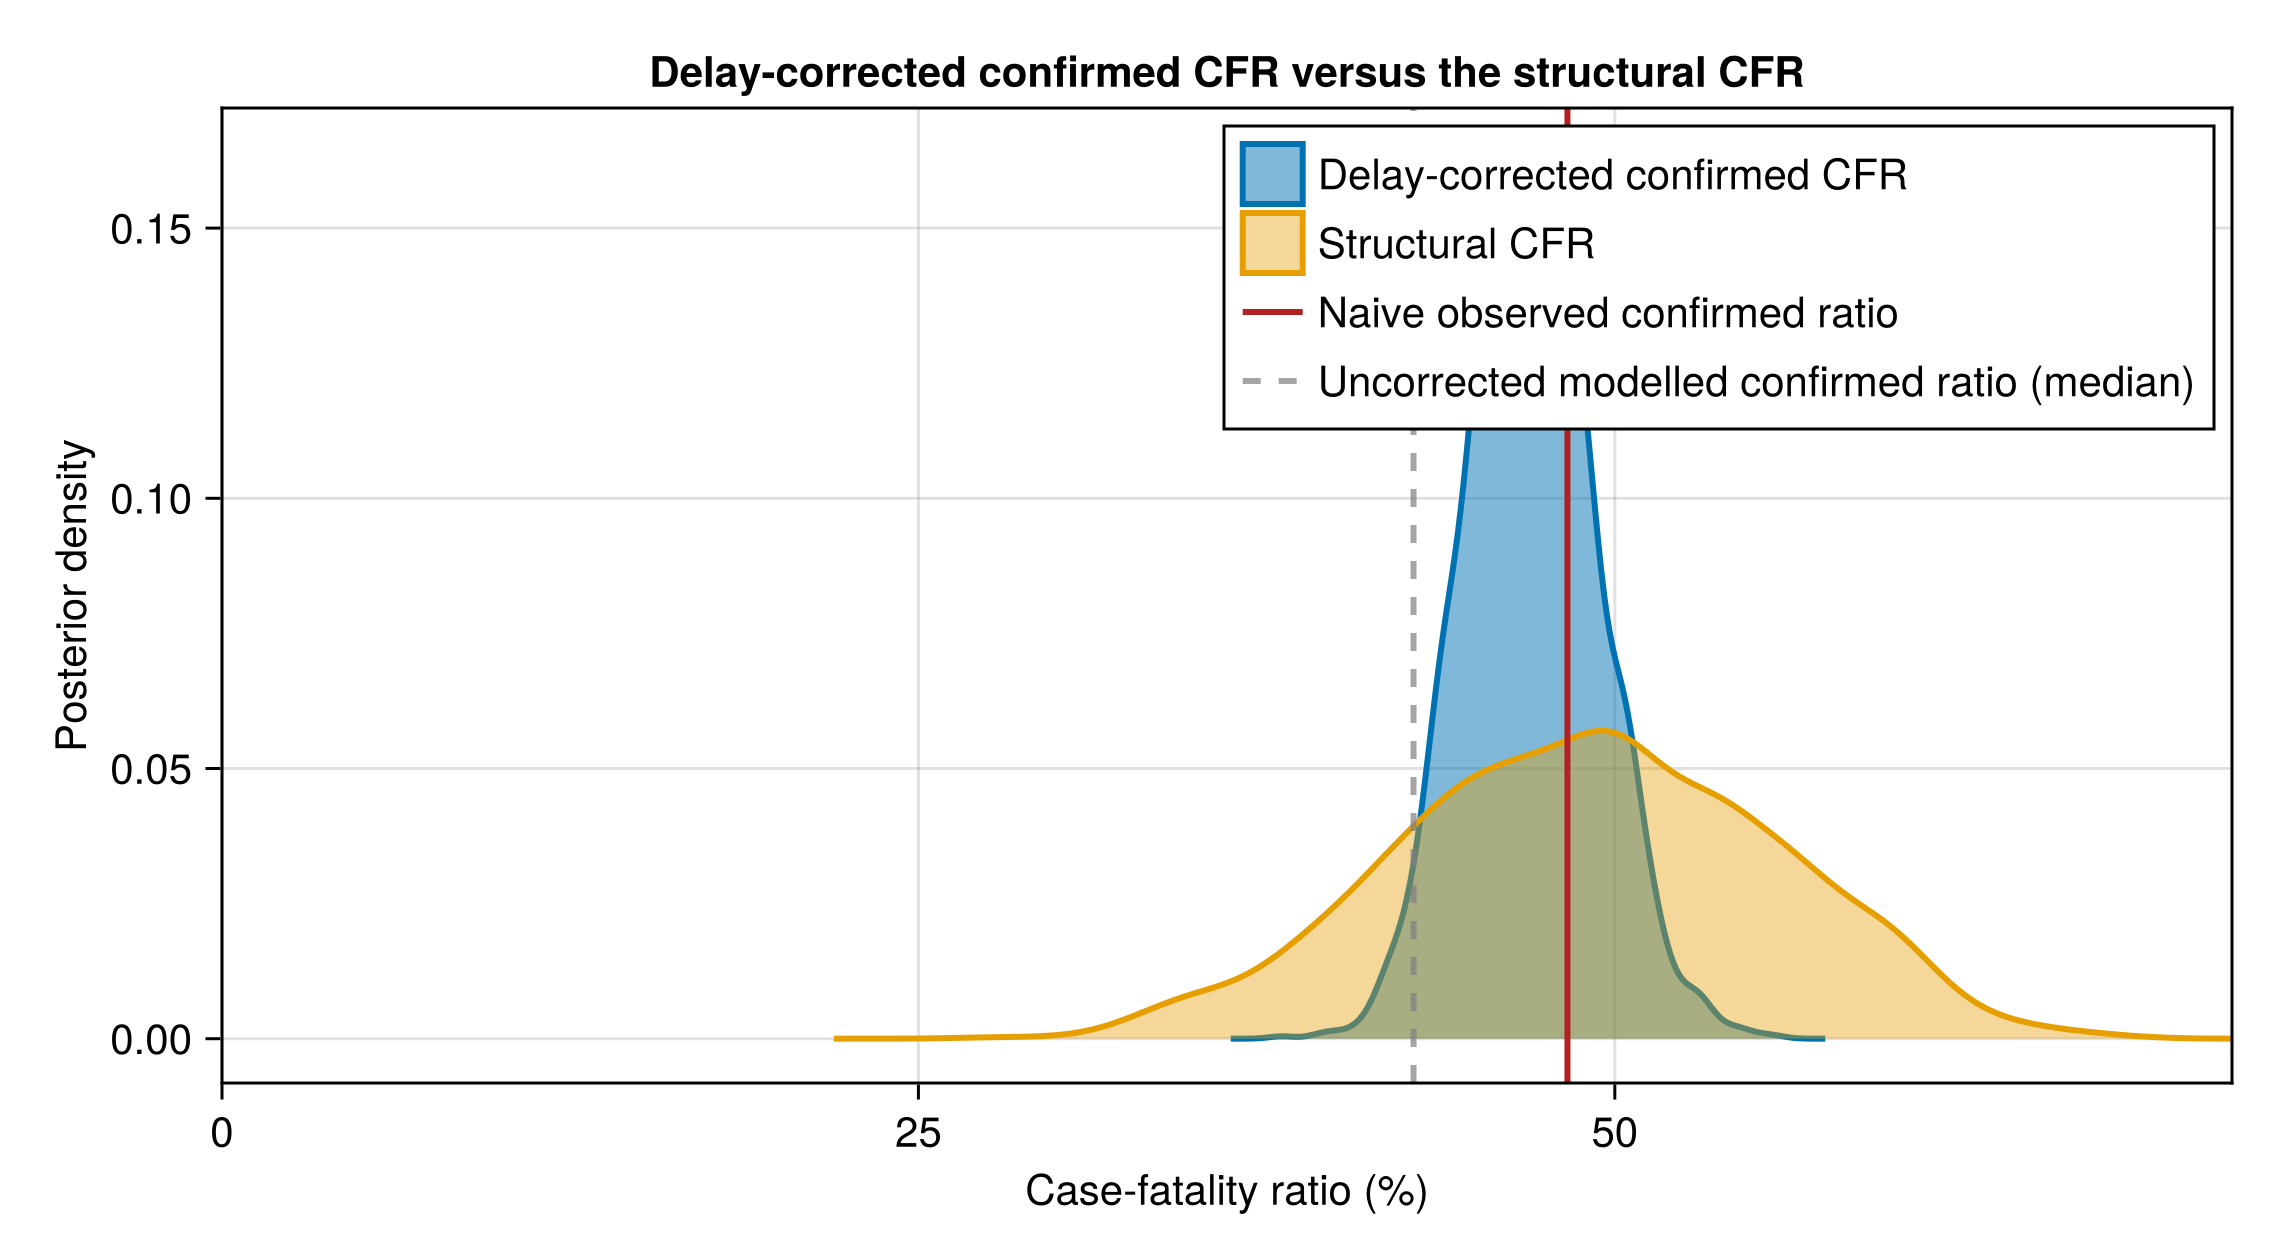
The same ratios by province are in the case-fatality ratio by province.
Forecast results
The one-week-ahead projection of every stream, the symptom-onset nowcast and the scoring against what arrived are on the forecasts page.
Saving results
The tables above are written to an output directory, which each push to the main branch publishes as a GitHub Release. The release holds the summary tables, thinned posterior draws, the latent symptom-onset trajectory, the one- to four-week-ahead forecasts and the input data manifest.
Write outputs to output/
# Outputs default to `output/` in the package directory (where the
# docs build and Release workflow expect them). Set `BVD_OUTPUT_DIR`
# to redirect them, e.g. when running from a read-only package
# install.
output_dir = get(
    ENV, "BVD_OUTPUT_DIR",
    joinpath(pkgdir(BVDOutbreakSize), "output")
)
mkpath(output_dir)

# Full parameter summary for the published CSV (infection, surveillance and
# export parameters together).
joint_summary = summary_table(
    chn_joint,
    [
        :r, :r0, :doubling_time, :T, :R_T, :CFR, :C_T,
        :p_drc, :p_uganda, :k, :tau_test, :lambda_bg,
        Symbol("exports_state.travel_state.daily_travellers"),
    ]; digits = 2
)
CSV.write(joinpath(output_dir, "posterior_summary.csv"), joint_summary)
CSV.write(
    joinpath(output_dir, "confirmed_cfr_summary.csv"),
    confirmed_cfr_summary
)

# Copy the input data so the release records what produced these
# results.
cp(
    joinpath(pkgdir(BVDOutbreakSize), "data", "observations.toml"),
    joinpath(output_dir, "observations.toml"); force = true
)

# Thinned posterior draws of the key joint parameters (every 10th
# draw) so downstream users can recompute their own summaries.
# `cumulative_onsets_T` is the cumulative symptom onsets by the cut-off,
# the latent "symptomatic cases" outcome (the onset analogue of `C_T`),
# read off the last day of each draw's `cumulative_onsets` trajectory.
_cum_onset_draws = vec(collect(chn_joint[:cumulative_onsets]))
cumulative_onsets_T = Float64[v[end] for v in _cum_onset_draws]
# Raw walk base `log_R0`, the renewal reproduction-number walk's starting
# point on the log scale, kept unexponentiated so downstream scoring takes
# its own exp. This is a distinct quantity from `r0`, the growth-clock
# initial rate, so both columns are published side by side.
log_R0_draws = vec(Array(chn_joint[Symbol("rt_state.log_R0")]))
posterior_draws = DataFrame(
    r = vec(Array(chn_joint[:r])),
    r0 = vec(Array(chn_joint[:r0])),
    doubling_time = vec(Array(chn_joint[:doubling_time])),
    T = vec(Array(chn_joint[:T])),
    R_T = vec(Array(chn_joint[:R_T])),
    CFR = vec(Array(chn_joint[:CFR])),
    p_drc = vec(Array(chn_joint[:p_drc])),
    p_uganda = vec(Array(chn_joint[:p_uganda])),
    C_T = vec(Array(chn_joint[:C_T])),
    cumulative_onsets_T = cumulative_onsets_T,
    confirmed_cfr_corrected = confirmed_cfr.corrected
)
posterior_draws[!, Symbol("rt_state.log_R0")] = log_R0_draws
posterior_draws = posterior_draws[1:10:end, :]
CSV.write(joinpath(output_dir, "posterior_draws.csv"), posterior_draws);

# One- to four-week-ahead forecasts of the observed streams, saved as a
# release asset so each release records the forecast it made and it can later
# be scored against what is observed. Only the incident and level quantities
# are archived (see `forecast_archive`), thinned to keep the asset compact.
forecast_horizons = (7, 14, 21, 28)
forecast_joint_draws = fit_forecast("joint")
forecast_runs = [
    (
        h,
        forecast_reported(
            forecast_joint_draws; horizon = h,
            obs_cases = obs.reported_cases,
            obs_deaths = obs.total_deaths,
            obs_confirmed = obs.confirmed_cases,
            obs_confirmed_deaths = obs.confirmed_deaths,
            obs_recovered = obs.recovered_cases
        ),
    )
        for h in forecast_horizons
]
CSV.write(
    joinpath(output_dir, "forecast.csv"),
    forecast_archive(forecast_runs; made_date = obs.cutoff, thin = 5)
);

# The province forecast archive, in the `forecast.csv` schema plus the
# province each row belongs to, so a release records the provincial forecast
# it made alongside the national one.
CSV.write(
    joinpath(output_dir, "province_forecast.csv"),
    province_forecast_archive(
        forecast_joint_draws, forecast_runs;
        made_date = obs.cutoff, n_patches = N_PATCHES, thin = 5
    )
);

# The same one- to four-week-ahead forecast made from each FROZEN joint
# re-fit (the McCabe-matched cut-offs, the Chamla anchor and the one-week-back
# validation fit), each stamped with its OWN cut-off as the made date. This
# gives historical forecast evaluation using the current model at past data
# cut-offs, scored against what has since been observed, without
# reconstructing old release tags. Each frozen fit uses its own frozen
# observations for the cut-off counts. The May cut-offs predate the isolation
# and recovered streams, so those are simply absent for them; the per-stream
# guard in `forecast_archive` skips a stream a fit does not carry.
frozen_forecast_ids = unique(
    id -> load_fit(id).o.cutoff,
    [
        ["frozen_$c" for c in frozen_cutoffs];
        "frozen_$chamla_cutoff"; "frozen_validation"
    ]
)
# The `fit` column tells the frozen joint and each frozen single-stream fit
# apart when scored. `score_release` falls back to one default where an
# archive carries no such column, so an older release still scores as the
# joint.
frozen_forecast_archive = DataFrame(
    made_date = Date[], horizon = Int[],
    target_date = Date[], stream = String[], draw = Int[], value = Float64[],
    fit = String[]
)
# Each frozen model is rebuilt from its own frozen observations, so the May
# cut-offs, which predate the digitised onset figure, carry no onset
# forecast.
for id in frozen_forecast_ids
    _fo = load_fit(id).o
    _fpp = fit_forecast(id)
    runs = [
        (
            h,
            forecast_reported(
                _fpp; horizon = h,
                obs_cases = _fo.reported_cases,
                obs_deaths = _fo.total_deaths,
                obs_confirmed = _fo.confirmed_cases,
                obs_confirmed_deaths = _fo.confirmed_deaths,
                obs_recovered = _fo.recovered_cases
            ),
        )
            for h in forecast_horizons
    ]
    _rows = forecast_archive(runs; made_date = _fo.cutoff, thin = 5)
    _rows[!, :fit] = fill(FROZEN_FIT, size(_rows, 1))
    append!(frozen_forecast_archive, _rows)
end

# The frozen single-stream fits, forecast from their own chains as
# `stream_forecasts.csv` forecasts the live ones. They are registered only
# at the validation cut-off and only for still-reported streams.
_frozen_stream_of = Dict(
    "cases" => (:reported_cases, "reported cases"),
    "deaths" => (:suspected_deaths, "suspected deaths"),
    "confirmed" => (:confirmed_cases, "confirmed cases"),
    "confirmed_deaths" => (:confirmed_deaths, "confirmed deaths"),
    "treatment" => (:isolation_beds, "isolation beds")
)
for (_sid, _sf) in sort(collect(pairs(frozen_lastweek_streams)); by = first)
    _stream, _label = _frozen_stream_of[_sid]
    _o = _sf.o
    _spp = fit_forecast("frozen_validation_$_sid")
    for h in forecast_horizons
        _vals = forecast_stream(_spp, _stream; horizon = h)
        for (_d, _i) in enumerate(1:5:length(_vals))
            push!(
                frozen_forecast_archive,
                (
                    _o.cutoff, h, _o.cutoff + Day(h), _label, _d,
                    Float64(_vals[_i]), _sid,
                )
            )
        end
    end
end
CSV.write(
    joinpath(output_dir, "forecast_frozen.csv"),
    frozen_forecast_archive
);

# Per-fit release assets: the reproduction number, outbreak size and forecasts
# for every fit rather than the joint alone, so a release records what each
# dataset implies on its own and can later be scored against the joint. The
# single-stream fits walk Rt from day 1 while the joint walks from
# `RT_WALK_LEAD` days before the first situation report, so each fit carries
# the starts its own fit used. Each single-stream fit forecasts only the
# dataset it observes; the joint forecasts every shared stream. Recovered has
# no single-stream fit, so the joint is the only fit that carries it.
stream_thin = 5
_rt_walk_start_joint = clamp(_BREAKPOINT - RT_WALK_LEAD, _rt_start_plot, obs.n)
stream_fits = [
    (;
        fit = "joint", chn = chn_joint, rt_start = _rt_start_plot,
        rt_walk_start = _rt_walk_start_joint,
        streams = [
            (:reported_cases, "reported cases"),
            (:suspected_deaths, "suspected deaths"),
            (:confirmed_cases, "confirmed cases"),
            (:confirmed_deaths, "confirmed deaths"),
            (:recovered, "recovered"),
            (:isolation_beds, "isolation beds"),
            (:exports, "exports"),
            (:onset_reports, "onset reports"),
        ],
    ),
    (;
        fit = "cases", chn = chn_cases, rt_start = 1, rt_walk_start = 1,
        streams = [(:reported_cases, "reported cases")],
    ),
    (;
        fit = "deaths", chn = chn_deaths, rt_start = 1, rt_walk_start = 1,
        streams = [(:suspected_deaths, "suspected deaths")],
    ),
    (;
        fit = "confirmed", chn = chn_confirmed, rt_start = 1, rt_walk_start = 1,
        streams = [(:confirmed_cases, "confirmed cases")],
    ),
    (;
        fit = "confirmed_deaths", chn = chn_confirmed_deaths, rt_start = 1,
        rt_walk_start = 1,
        streams = [
            (:confirmed_deaths, "confirmed deaths"),
        ],
    ),
    (;
        fit = "treatment", chn = chn_treatment, rt_start = 1,
        rt_walk_start = 1,
        streams = [(:isolation_beds, "isolation beds")],
    ),
    (;
        fit = "exports", chn = chn_exports, rt_start = 1, rt_walk_start = 1,
        streams = [(:exports, "exports")],
    ),
    (;
        fit = "onsets", chn = chn_onsets, rt_start = 1, rt_walk_start = 1,
        streams = [(:onset_reports, "onset reports")],
    ),
]

# Cut-off reproduction number per fit. The joint exposes it as `R_T`; the
# single-stream composers do not (the alias lives in `bvd_joint`, not the
# shared latent submodel), so theirs is rebuilt from the walk parameters every
# chain carries and read at the cut-off, the last day of the reconstructed
# path. `ramp` matches the model's 21-day intervention scale-up.
function _fit_rt_draws(f)
    f.fit == "joint" && return vec(Array(f.chn[:R_T]))
    rt = reconstruct_rt(
        f.chn; n = obs.n, breakpoint = _BREAKPOINT,
        rt_start = f.rt_start, rt_walk_start = f.rt_walk_start, ramp = RT_INTERVENTION_RAMP
    )
    return Float64[rt[i, obs.n] for i in axes(rt, 1)]
end

# Basic reproduction number per fit, the renewal walk's starting value, a
# single distribution per fit rather than a daily series. Every current
# single-stream composer shares the joint's latent submodel and so carries
# its own walk base, but `r0_walk_draws` probes rather than assumes, so a
# single-stream model built without its own renewal walk drops out of this
# quantity instead of breaking the release.
_stream_quantities = [
    (
        f.fit, _fit_rt_draws(f), vec(Array(f.chn[:C_T])),
        r0_walk_draws(f.chn),
    ) for f in stream_fits
]

# One row per fit and quantity, with the median and the 30/60/90% credible
# bounds the report's tables use.
function _stream_estimate_row(fit, quantity, draws)
    s = posterior_summary(draws)
    return (
        fit = fit, quantity = quantity, median = quantile(draws, 0.5),
        lo30 = s.lo30, hi30 = s.hi30, lo60 = s.lo60, hi60 = s.hi60,
        lo90 = s.lo90, hi90 = s.hi90,
    )
end
stream_estimates = DataFrame(
    [
        _stream_estimate_row(fit, q, d)
            for (fit, rt, ct, r0) in _stream_quantities
            for (q, d) in (
                ("R_T", rt), ("C_T", ct),
                ("R0", r0),
            )
            if !isnothing(d)
    ]
)
CSV.write(joinpath(output_dir, "stream_estimates.csv"), stream_estimates);

# Thinned reproduction-number and outbreak-size draws per fit, so downstream
# scoring can recompute its own summaries rather than reuse the intervals.
stream_draws = DataFrame(
    [
        (fit = fit, quantity = q, draw = d, value = v)
            for (fit, rt, ct, r0) in _stream_quantities
            for (q, vals) in (
                ("R_T", rt), ("C_T", ct),
                ("R0", r0),
            )
            if !isnothing(vals)
            for (d, v) in enumerate(vals[1:stream_thin:end])
    ]
)
CSV.write(joinpath(output_dir, "stream_draws.csv"), stream_draws);

# Per-fit forecasts of each fit's own observed stream, in the `forecast.csv`
# long schema plus the fit that made them, each drawn from that fit's own
# model run past the cut-off.
stream_forecasts = DataFrame(
    made_date = Date[], horizon = Int[],
    target_date = Date[], stream = String[], draw = Int[], value = Float64[],
    fit = String[]
)
for f in stream_fits, (stream, label) in f.streams,
        h in forecast_horizons
    _vals = forecast_stream(fit_forecast(f.fit), stream; horizon = h)
    for (d, i) in enumerate(1:stream_thin:length(_vals))
        push!(
            stream_forecasts, (
                obs.cutoff, h, obs.cutoff + Day(h), label,
                d, Float64(_vals[i]), f.fit,
            )
        )
    end
end

# Confirmed/suspect ward-bed occupancy for the joint, read from the joint's
# own `forecast_reported` runs so the ward beds are scored on the same
# footing as the total occupancy in the preferred `stream_forecasts.csv`
# asset. `forecast_stream` cannot project these. The split is not a growable
# stream but a partition of the total.
#
# Dead as it stands. `forecast_reported` projects the total occupancy alone
# and emits neither column, so the guard below always skips and nothing
# reaches `stream_forecasts.csv` under these two labels. The joint does
# carry the cut-off split (`expected_confirmed_incare_T`), so what is
# missing is the partition of the projected level, not the quantity to
# partition it by. Kept, with the guard, so the loop starts writing the
# moment `forecast_reported` grows those columns.
for (h, fc) in forecast_runs,
        (col, label) in (
            (:suspect_occupancy, "isolation beds (suspected)"),
            (:confirmed_occupancy, "treatment beds"),
        )

    col in propertynames(fc) || continue
    _wvals = fc[!, col]
    for (d, i) in enumerate(1:stream_thin:length(_wvals))
        push!(
            stream_forecasts, (
                obs.cutoff, h, obs.cutoff + Day(h), label,
                d, Float64(_wvals[i]), "joint",
            )
        )
    end
end
CSV.write(joinpath(output_dir, "stream_forecasts.csv"), stream_forecasts);

# Latent symptom-onset trajectory over time, the "symptomatic cases" curve,
# showing outbreak growth: one row per grid day with the 30/60/90%
# credible intervals of both the daily new and cumulative onsets.
onsets_over_time_table = onsets_over_time(
    chn_joint;
    n = obs.n, seeding = obs.seeding
)
CSV.write(
    joinpath(output_dir, "onsets_over_time.csv"),
    onsets_over_time_table
);
Summary-page assets
The one-page Summary dashboard reuses the results above rather than refitting. This step saves its headline text, tables and figures for the dashboard page to embed.
Write the dashboard assets
dashboard_dir = joinpath(
    pkgdir(BVDOutbreakSize), "docs", "src", "summary_assets"
)
mkpath(dashboard_dir)

# Figures: estimated R(t) nationally and latent infections over time, both
# produced in the Results sections above and written here at the dashboard
# size. The province and in-sample pages write the figures they own.
CairoMakie.save(joinpath(dashboard_dir, "rt.png"), rt_fig)
CairoMakie.save(
    joinpath(dashboard_dir, "infections.png"),
    cumulative_traj_fig
)

# Headline prose: the same bullet summary shown at the top of the Results
# section, serialised to markdown so the dashboard renders it verbatim.
open(joinpath(dashboard_dir, "headline.md"), "w") do io
    print(io, sprint(Markdown.plain, summary_ranges))
end

# Headline tables: outbreak size and timing as whole numbers, and the
# growth and severity parameters to two decimals, each with reader-friendly
# quantity names.
dashboard_counts = summary_table(
    chn_joint, [:C_T, :T]; digits = 0,
    labels = Dict(
        :C_T => "Cumulative infections",
        :T => "Outbreak age (days)"
    )
)
dashboard_rates = summary_table(
    chn_joint,
    [:R0, :R_T, :r, :doubling_time, :CFR]; digits = 2,
    labels = Dict(
        :R0 => "Initial reproduction number",
        :R_T => "Latest reproduction number",
        :r => "Latest growth rate (per day)",
        :doubling_time => "Latest doubling time (days)",
        :CFR => "Case-fatality ratio"
    )
)
open(joinpath(dashboard_dir, "headline_counts.md"), "w") do io
    print(io, markdown_table(dashboard_counts))
end
open(joinpath(dashboard_dir, "headline_rates.md"), "w") do io
    print(io, markdown_table(dashboard_rates))
end

# Fit diagnostics: the same summary and table the Results section shows,
# so the dashboard reports how the fit behind its numbers sampled without
# building a second table.
open(joinpath(dashboard_dir, "diagnostics.md"), "w") do io
    print(io, fit_diagnostics_detail_md, "\n\n")
    print(io, markdown_table(fit_diagnostics_table))
end
open(joinpath(dashboard_dir, "diagnostics_summary.md"), "w") do io
    print(io, fit_convergence_summary.verdict)
end

# The data cut-off the dashboard reports as of, written as a plain date.
open(joinpath(dashboard_dir, "cutoff.md"), "w") do io
    print(io, string(obs.cutoff))
end
The full analysis code, data and model definitions are in the epiforecasts/BVDOutbreakSize repository. Issues, corrections and suggestions are welcome there. Maintained by Sam Abbott, Kath Sherratt, Samuel Brand and Sebastian Funk.