Province estimates
This page gives the province estimates from the joint model, whose methods are on the Methods page. The national estimates are the sum of the provinces here. The per-province forecast is on the province forecasts page and its scoring is in the forecast by province.
This page is generated from docs/pages/estimates/province.jl. The model code it calls is in src/. See aim and origins and limitations.
Load packages, data and fitted chains
# Shared setup: packages, observations and the fit registry. See
# `docs/pages/_setup.jl`.
using BVDOutbreakSize
include(joinpath(pkgdir(BVDOutbreakSize), "docs", "pages", "_setup.jl"))
validation_forecast_from (generic function with 1 method)# The fits this page reads, loaded from the cache here.
chn_joint = load_fit("joint");Last updated: 18 November 2026.
Data as of: 16 November 2026.
Summary
Compute the weekly cases and reproduction number by province
# The provincial Rt trajectories, rebuilt on the same grid as the
# reproduction number by province figure further down.
province_summary_rt = reconstruct_patch_rt(
    chn_joint;
    n = obs.n, breakpoint = _BREAKPOINT, n_patches = N_PATCHES,
    rt_start = _rt_start_plot,
    rt_walk_start = clamp(_BREAKPOINT - RT_WALK_LEAD, _rt_start_plot, obs.n),
    ramp = RT_INTERVENTION_RAMP
);
# The week-ahead province forecast, read from the same draws as the
# province forecasts page.
province_summary_forecast = forecast_provinces(
    fit_forecast("joint"); horizon = 7, n_patches = N_PATCHES
);
province_cases_rt = cases_rt_table(
    province_summary_rt, province_cases.days, province_cases.increments;
    cutoff = obs.cutoff, n = obs.n, forecast = province_summary_forecast
);
province_cases_rt_fig = plot_cases_rt(province_cases_rt);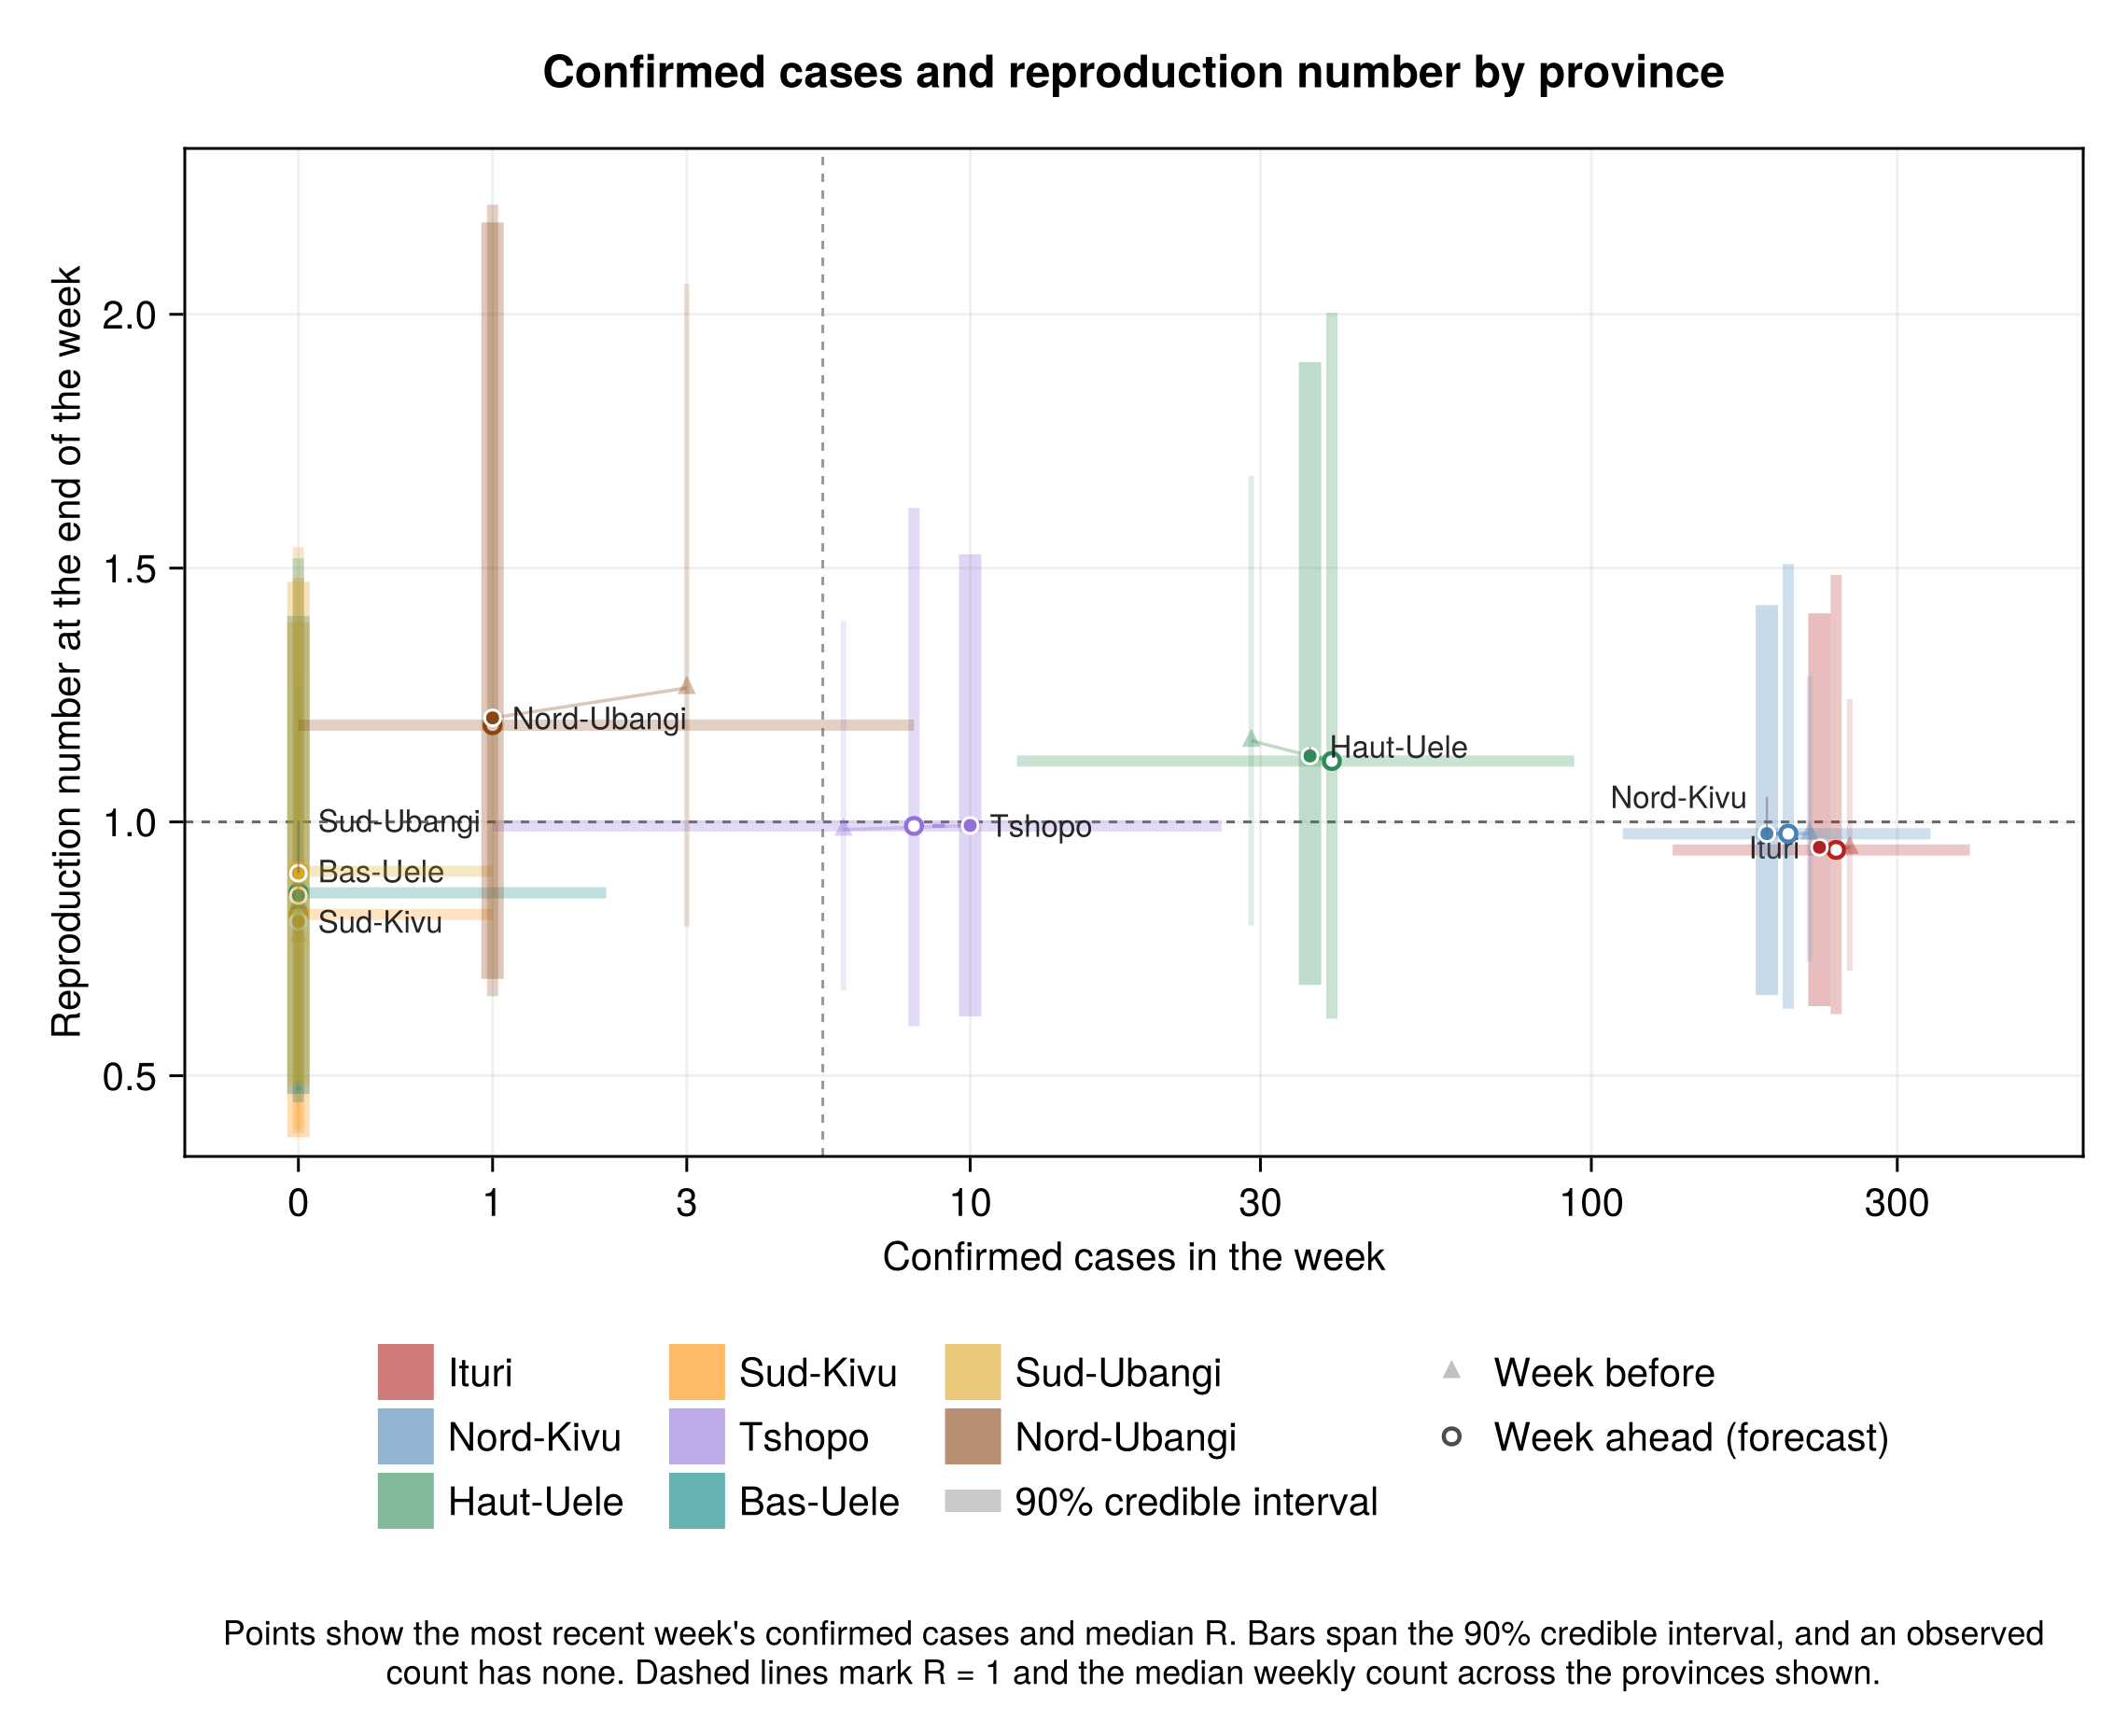
Compute the province comparison
province_headline_md = patch_headline(chn_joint, N_PATCHES)
province_headline = Markdown.parse(province_headline_md);| Province | Share of infections (%) | R at the cut-off | P(R > 1) | CFR (%) | Relative ascertainment |
|---|---|---|---|---|---|
| Ituri | 61–71 | 0.64–1.41 | 41% | 38.9–64.0 | 0.8–1.19 |
| Nord-Kivu | 23–33 | 0.66–1.43 | 45% | 41.9–67.2 | 0.69–1.12 |
| Haut-Uele | 4–6 | 0.68–1.91 | 66% | 38.5–63.4 | 0.78–1.19 |
| Sud-Kivu | 0–0 | 0.38–1.39 | 26% | 38.7–64.4 | 0.69–1.39 |
| Tshopo | 1–1 | 0.62–1.53 | 48% | 38.7–63.1 | 0.88–1.43 |
| Bas-Uele | 0–0 | 0.46–1.41 | 29% | 38.5–63.6 | 0.79–1.42 |
| Sud-Ubangi | 0–0 | 0.48–1.47 | 35% | 38.8–64.9 | 0.67–1.35 |
| Nord-Ubangi | 0–0 | 0.69–2.18 | 72% | 38.5–64.4 | 0.78–1.48 |
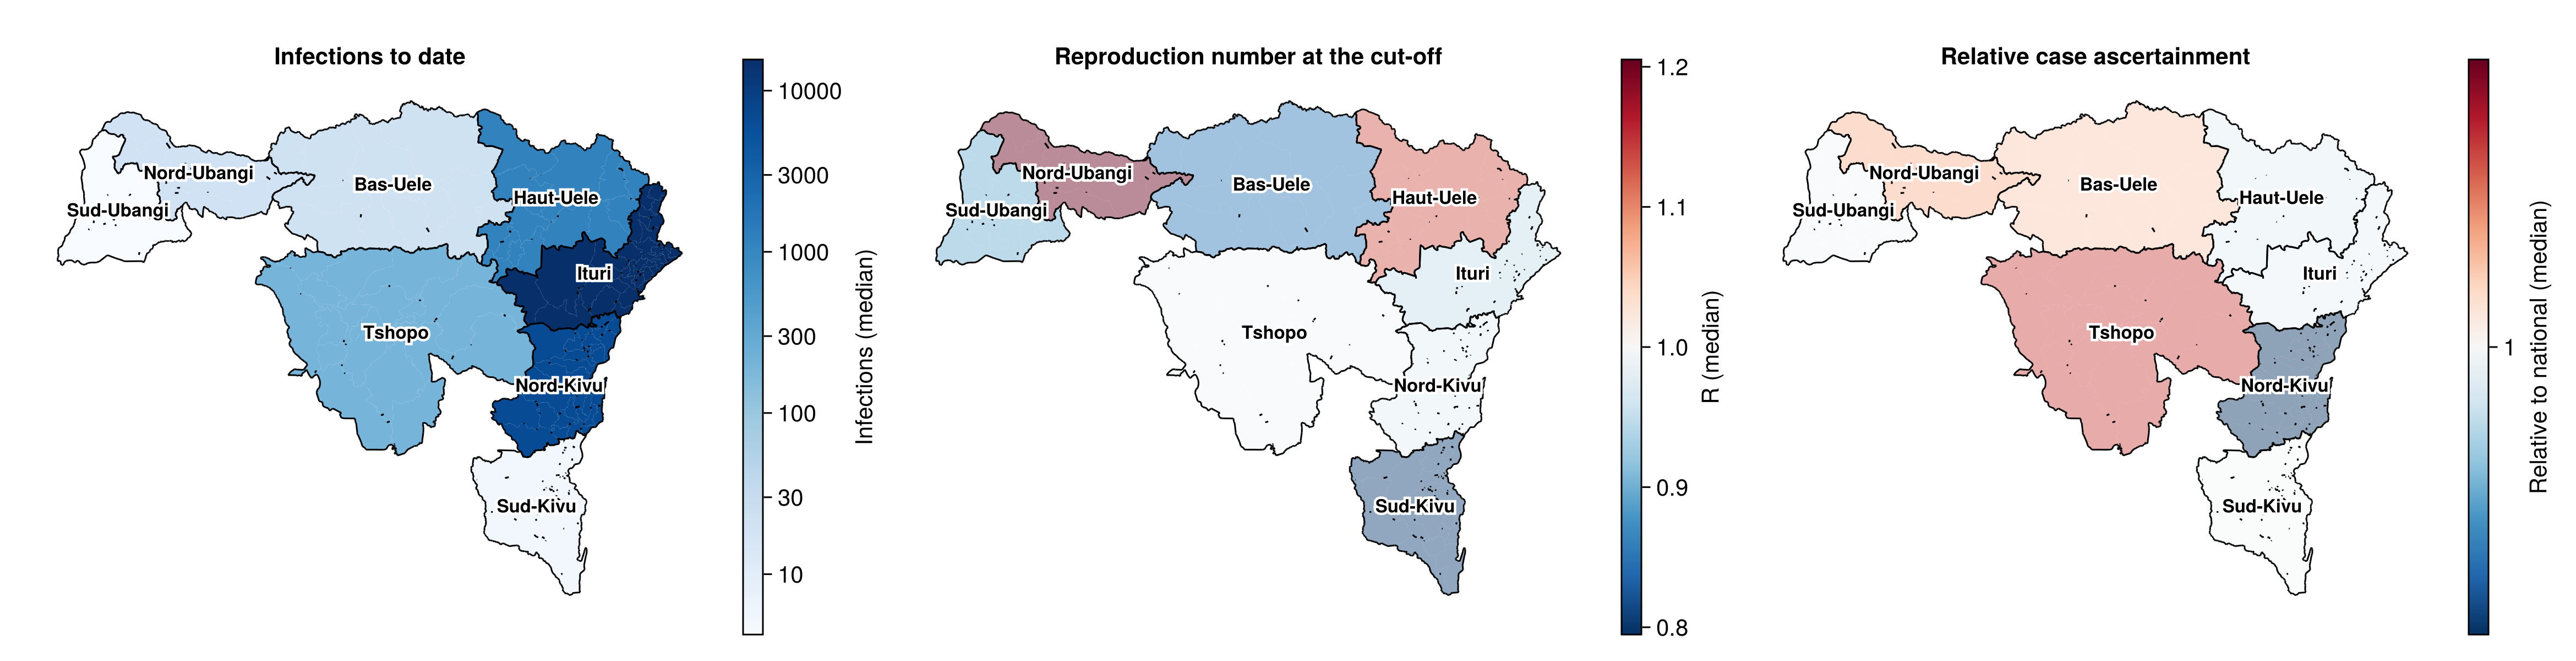
Ituri has the most infections with probability over 99%, and 2 of 8 provinces are more likely than not to be growing. Infections imported from another province make up 0.2–2.9% of infections to date.
Maps
Maps of infections, reproduction number and ascertainment
# The infections panel is also drawn alone for the summary page.
province_infections_panel = (;
    values = province_map_summary(chn_joint, :C_T_patch, N_PATCHES).values,
    title = "Infections to date", scale = log10,
    colorbar_label = "Infections (median)",
)
province_map_fig = plot_province_map(
    [
        province_infections_panel,
        (;
            province_map_summary(chn_joint, :R_T_patch, N_PATCHES)...,
            title = "Reproduction number at the cut-off",
            diverging_at = 1.0, colorbar_label = "R (median)",
        ),
        (;
            province_map_summary(
                chn_joint, :province_ascertainment, N_PATCHES
            )...,
            title = "Relative case ascertainment", diverging_at = 1.0,
            scale = log10, colorbar_label = "Relative to national (median)",
        ),
    ]
);
Detail by province
Each province's case-fatality ratio is in the case-fatality ratio by province.
Compute the per-province tables and figure
# The tables below and the pair-plot dropdowns further down name the
# provinces in this order.
@assert PROVINCE_LABELS[1:N_PATCHES] == [
    "Ituri", "Nord-Kivu", "Haut-Uele",
    "Sud-Kivu", "Tshopo", "Bas-Uele", "Sud-Ubangi", "Nord-Ubangi",
]
province_detail_tables = [
    patch_summary_table(chn_joint, N_PATCHES; patch = p) for p in 1:N_PATCHES
];
province_detail_fig = plot_patch_summary(chn_joint, N_PATCHES);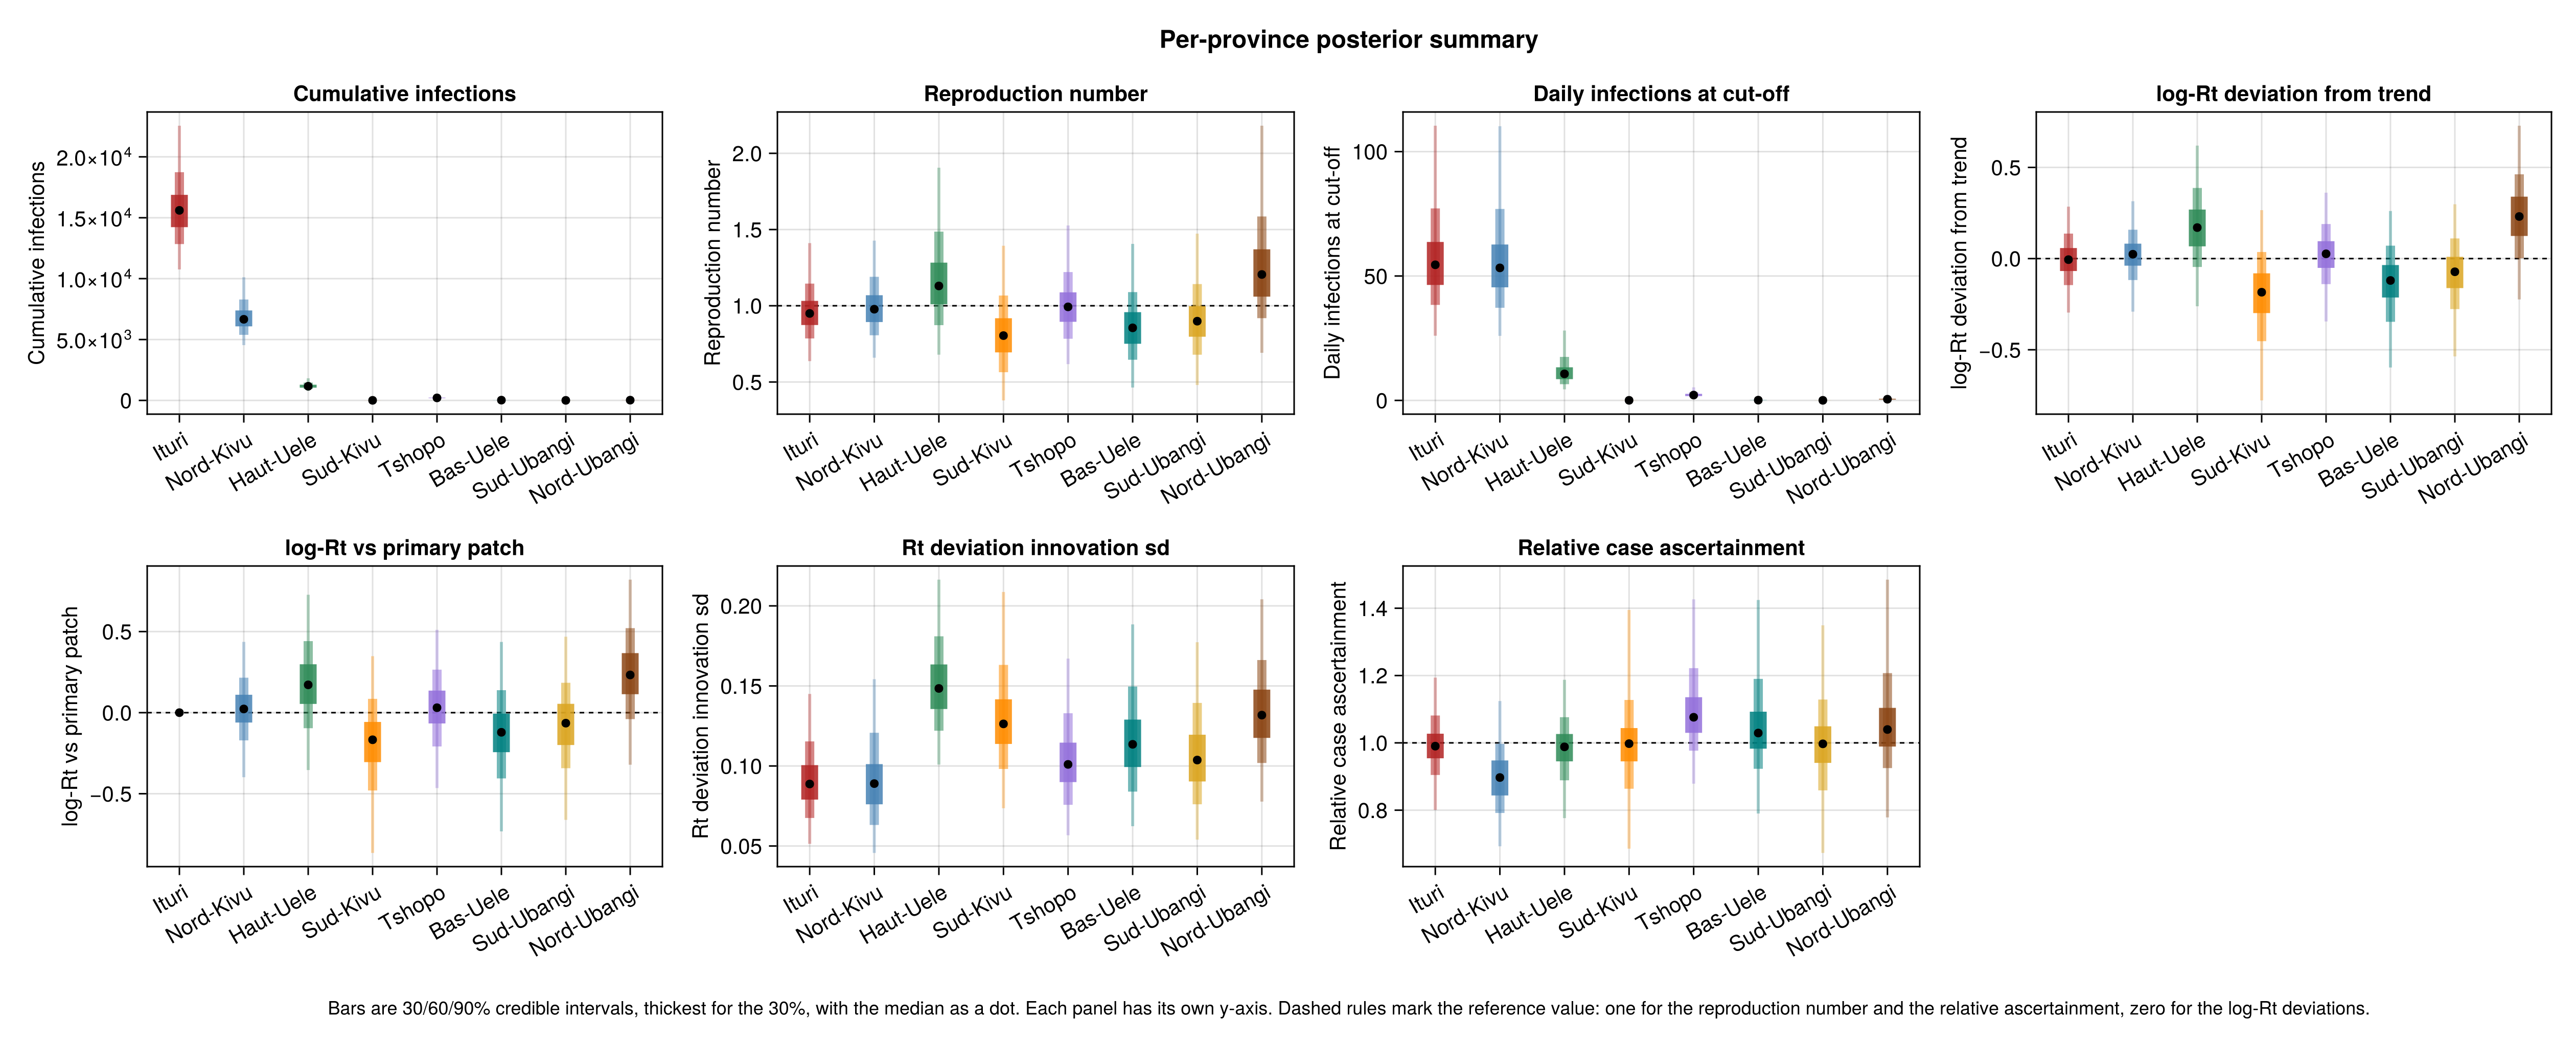
Ituri
| Row | Quantity | Lower 90% | Lower 60% | Lower 30% | Upper 30% | Upper 60% | Upper 90% |
|---|---|---|---|---|---|---|---|
| String | Float64 | Float64 | Float64 | Float64 | Float64 | Float64 | |
| 1 | Cumulative infections | 10755.0 | 12839.0 | 14227.0 | 16879.0 | 18740.0 | 22558.0 |
| 2 | Reproduction number | 0.64 | 0.79 | 0.87 | 1.03 | 1.15 | 1.41 |
| 3 | Daily infections at cut-off | 26.0 | 38.0 | 46.0 | 64.0 | 77.0 | 110.0 |
| 4 | log-Rt deviation from trend | -0.3 | -0.15 | -0.07 | 0.06 | 0.14 | 0.28 |
| 5 | log-Rt vs primary patch | 0.0 | 0.0 | 0.0 | 0.0 | 0.0 | 0.0 |
| 6 | Rt deviation innovation sd | 0.051 | 0.068 | 0.079 | 0.101 | 0.115 | 0.145 |
| 7 | Relative case ascertainment | 0.8 | 0.9 | 0.95 | 1.03 | 1.08 | 1.19 |
Nord-Kivu
| Row | Quantity | Lower 90% | Lower 60% | Lower 30% | Upper 30% | Upper 60% | Upper 90% |
|---|---|---|---|---|---|---|---|
| String | Float64 | Float64 | Float64 | Float64 | Float64 | Float64 | |
| 1 | Cumulative infections | 4540.0 | 5385.0 | 6082.0 | 7387.0 | 8287.0 | 10116.0 |
| 2 | Reproduction number | 0.66 | 0.81 | 0.89 | 1.07 | 1.19 | 1.43 |
| 3 | Daily infections at cut-off | 26.0 | 37.0 | 45.0 | 63.0 | 77.0 | 110.0 |
| 4 | log-Rt deviation from trend | -0.29 | -0.12 | -0.04 | 0.08 | 0.16 | 0.31 |
| 5 | log-Rt vs primary patch | -0.4 | -0.17 | -0.06 | 0.11 | 0.22 | 0.44 |
| 6 | Rt deviation innovation sd | 0.046 | 0.063 | 0.076 | 0.101 | 0.121 | 0.154 |
| 7 | Relative case ascertainment | 0.69 | 0.79 | 0.84 | 0.95 | 1.0 | 1.12 |
Haut-Uele
| Row | Quantity | Lower 90% | Lower 60% | Lower 30% | Upper 30% | Upper 60% | Upper 90% |
|---|---|---|---|---|---|---|---|
| String | Float64 | Float64 | Float64 | Float64 | Float64 | Float64 | |
| 1 | Cumulative infections | 781.0 | 943.0 | 1048.0 | 1289.0 | 1462.0 | 1818.0 |
| 2 | Reproduction number | 0.68 | 0.87 | 1.01 | 1.28 | 1.49 | 1.91 |
| 3 | Daily infections at cut-off | 4.0 | 7.0 | 9.0 | 13.0 | 17.0 | 28.0 |
| 4 | log-Rt deviation from trend | -0.26 | -0.05 | 0.07 | 0.27 | 0.39 | 0.62 |
| 5 | log-Rt vs primary patch | -0.35 | -0.1 | 0.05 | 0.3 | 0.44 | 0.73 |
| 6 | Rt deviation innovation sd | 0.101 | 0.122 | 0.136 | 0.163 | 0.181 | 0.216 |
| 7 | Relative case ascertainment | 0.78 | 0.89 | 0.95 | 1.03 | 1.08 | 1.19 |
Sud-Kivu
| Row | Quantity | Lower 90% | Lower 60% | Lower 30% | Upper 30% | Upper 60% | Upper 90% |
|---|---|---|---|---|---|---|---|
| String | Float64 | Float64 | Float64 | Float64 | Float64 | Float64 | |
| 1 | Cumulative infections | 2.0 | 3.0 | 4.0 | 7.0 | 9.0 | 14.0 |
| 2 | Reproduction number | 0.38 | 0.56 | 0.69 | 0.92 | 1.07 | 1.39 |
| 3 | Daily infections at cut-off | 0.0 | 0.0 | 0.0 | 0.0 | 0.0 | 0.0 |
| 4 | log-Rt deviation from trend | -0.78 | -0.45 | -0.3 | -0.08 | 0.04 | 0.27 |
| 5 | log-Rt vs primary patch | -0.87 | -0.48 | -0.31 | -0.06 | 0.09 | 0.35 |
| 6 | Rt deviation innovation sd | 0.074 | 0.098 | 0.114 | 0.142 | 0.163 | 0.209 |
| 7 | Relative case ascertainment | 0.69 | 0.86 | 0.95 | 1.04 | 1.13 | 1.39 |
Tshopo
| Row | Quantity | Lower 90% | Lower 60% | Lower 30% | Upper 30% | Upper 60% | Upper 90% |
|---|---|---|---|---|---|---|---|
| String | Float64 | Float64 | Float64 | Float64 | Float64 | Float64 | |
| 1 | Cumulative infections | 133.0 | 165.0 | 187.0 | 229.0 | 260.0 | 330.0 |
| 2 | Reproduction number | 0.62 | 0.78 | 0.89 | 1.09 | 1.22 | 1.53 |
| 3 | Daily infections at cut-off | 1.0 | 1.0 | 2.0 | 3.0 | 3.0 | 5.0 |
| 4 | log-Rt deviation from trend | -0.34 | -0.14 | -0.05 | 0.1 | 0.19 | 0.36 |
| 5 | log-Rt vs primary patch | -0.47 | -0.21 | -0.07 | 0.14 | 0.27 | 0.51 |
| 6 | Rt deviation innovation sd | 0.057 | 0.076 | 0.09 | 0.115 | 0.133 | 0.167 |
| 7 | Relative case ascertainment | 0.88 | 0.98 | 1.03 | 1.14 | 1.22 | 1.43 |
Bas-Uele
| Row | Quantity | Lower 90% | Lower 60% | Lower 30% | Upper 30% | Upper 60% | Upper 90% |
|---|---|---|---|---|---|---|---|
| String | Float64 | Float64 | Float64 | Float64 | Float64 | Float64 | |
| 1 | Cumulative infections | 12.0 | 16.0 | 19.0 | 26.0 | 30.0 | 40.0 |
| 2 | Reproduction number | 0.46 | 0.65 | 0.75 | 0.96 | 1.09 | 1.41 |
| 3 | Daily infections at cut-off | 0.0 | 0.0 | 0.0 | 0.0 | 0.0 | 0.0 |
| 4 | log-Rt deviation from trend | -0.6 | -0.35 | -0.21 | -0.04 | 0.07 | 0.26 |
| 5 | log-Rt vs primary patch | -0.73 | -0.41 | -0.24 | -0.01 | 0.14 | 0.44 |
| 6 | Rt deviation innovation sd | 0.062 | 0.084 | 0.099 | 0.129 | 0.15 | 0.188 |
| 7 | Relative case ascertainment | 0.79 | 0.92 | 0.98 | 1.09 | 1.19 | 1.42 |
Sud-Ubangi
| Row | Quantity | Lower 90% | Lower 60% | Lower 30% | Upper 30% | Upper 60% | Upper 90% |
|---|---|---|---|---|---|---|---|
| String | Float64 | Float64 | Float64 | Float64 | Float64 | Float64 | |
| 1 | Cumulative infections | 1.0 | 2.0 | 3.0 | 5.0 | 7.0 | 11.0 |
| 2 | Reproduction number | 0.48 | 0.68 | 0.8 | 1.0 | 1.14 | 1.47 |
| 3 | Daily infections at cut-off | 0.0 | 0.0 | 0.0 | 0.0 | 0.0 | 0.0 |
| 4 | log-Rt deviation from trend | -0.54 | -0.28 | -0.16 | 0.01 | 0.11 | 0.3 |
| 5 | log-Rt vs primary patch | -0.66 | -0.34 | -0.2 | 0.05 | 0.18 | 0.47 |
| 6 | Rt deviation innovation sd | 0.054 | 0.076 | 0.09 | 0.12 | 0.139 | 0.177 |
| 7 | Relative case ascertainment | 0.67 | 0.86 | 0.94 | 1.05 | 1.13 | 1.35 |
Nord-Ubangi
| Row | Quantity | Lower 90% | Lower 60% | Lower 30% | Upper 30% | Upper 60% | Upper 90% |
|---|---|---|---|---|---|---|---|
| String | Float64 | Float64 | Float64 | Float64 | Float64 | Float64 | |
| 1 | Cumulative infections | 9.0 | 14.0 | 18.0 | 26.0 | 32.0 | 46.0 |
| 2 | Reproduction number | 0.69 | 0.92 | 1.06 | 1.37 | 1.59 | 2.18 |
| 3 | Daily infections at cut-off | 0.0 | 0.0 | 0.0 | 1.0 | 1.0 | 2.0 |
| 4 | log-Rt deviation from trend | -0.22 | 0.0 | 0.12 | 0.34 | 0.46 | 0.73 |
| 5 | log-Rt vs primary patch | -0.32 | -0.04 | 0.11 | 0.37 | 0.52 | 0.82 |
| 6 | Rt deviation innovation sd | 0.078 | 0.102 | 0.118 | 0.148 | 0.166 | 0.204 |
| 7 | Relative case ascertainment | 0.78 | 0.93 | 0.99 | 1.1 | 1.21 | 1.48 |
Isolation beds
Province bed table
province_bed_overview = province_bed_table(chn_joint, N_PATCHES);| Row | Province | Beds | Bed demand | Occupied beds | Utilisation (%) | Patients above beds |
|---|---|---|---|---|---|---|
| String | String | String | String | String | String | |
| 1 | Ituri | 836 (290–2542) | 512 (425–604) | 437 (365–518) | 52.1 (16.8–151.0) | 0 (0–146) |
| 2 | Nord-Kivu | 468 (162–1453) | 528 (448–615) | 453 (383–531) | 96.2 (31.6–289.7) | 0 (0–301) |
| 3 | Haut-Uele | 122 (41–371) | 64 (46–89) | 55 (39–77) | 45.4 (14.1–137.7) | 0 (0–16) |
| 4 | Sud-Kivu | 17 (5–56) | 13 (2–84) | 11 (1–72) | 69.4 (8.2–406.1) | 0 (0–44) |
| 5 | Tshopo | 32 (11–98) | 24 (16–36) | 21 (14–31) | 63.8 (19.9–192.5) | 0 (0–11) |
| 6 | Bas-Uele | 16 (4–69) | 44 (29–65) | 38 (25–56) | 231.9 (50.3–1095.5) | 20 (0–43) |
| 7 | Sud-Ubangi | 37 (12–115) | 3 (1–9) | 3 (1–8) | 8.0 (1.8–34.0) | 0 (0–0) |
| 8 | Nord-Ubangi | 18 (6–56) | 24 (8–56) | 21 (7–48) | 111.1 (25.0–430.6) | 2 (0–31) |
Size and infections
Modelled infections by province
province_infections_fig = plot_infections_patches(
    chn_joint;
    n = obs.n, seeding = obs.seeding, n_patches = N_PATCHES
);
The provinces are coupled by the gravity kernel in the mixing and importation Methods section. The distances between the patches' population centres run from 191 km between Sud-Ubangi and Nord-Ubangi to 1 220 km between Sud-Kivu and Sud-Ubangi. Ituri is 324 km from Nord-Kivu and 216 km from Haut-Uele. About half of what leaves Nord-Kivu lands in Sud-Kivu, 260 km away and the second most populous of the eight. Nord-Ubangi sends about a third of its exports to Sud-Ubangi, its nearest neighbour.
Importation intensity and imports by province
importation_table = summary_table(
    chn_joint, [:importation_epsilon];
    digits = 4,
    labels = Dict(:importation_epsilon => "Importation intensity")
);

province_imports_fig = plot_imports_patches(
    chn_joint;
    n = obs.n, seeding = obs.seeding, n_patches = N_PATCHES
);| Row | Quantity | Lower 90% | Lower 60% | Lower 30% | Upper 30% | Upper 60% | Upper 90% |
|---|---|---|---|---|---|---|---|
| String | Float64 | Float64 | Float64 | Float64 | Float64 | Float64 | |
| 1 | Importation intensity | 0.0027 | 0.006 | 0.0086 | 0.0138 | 0.0187 | 0.0282 |

Point prevalence
Point prevalence is the number of people infected at the cut-off who are still in the community, having not yet died, recovered or been detected as a suspected case. It splits into people not yet symptomatic and people with symptoms not yet detected, as the point prevalence Methods section sets out. A province's undetected count depends on its suspected-case detection probability. The province compositions see that probability only as a product with case confirmation, so the province occupancy splits and its prior set it. The table gives each rate per 100,000 residents and the number of people in the community, as medians with 90% credible intervals.
Compute point prevalence by province
province_prevalence = prevalence_overview(
    patch_prevalence(chn_joint, N_PATCHES),
    PROVINCE_POPULATIONS[1:N_PATCHES];
    labels = PROVINCE_LABELS[1:N_PATCHES], patch = collect(1:N_PATCHES)
);
province_prevalence_fig = plot_prevalence_ranking(
    province_prevalence; title = "Point prevalence by province"
);| Province | Population | Infected but not yet symptomatic per 100,000 | Symptomatic, undetected per 100,000 | In the community per 100,000 | Number in the community |
|---|---|---|---|---|---|
| Ituri | 4008000 | 8.8 (4.7–16.8) | 12.4 (4.8–26.0) | 21.4 (10.1–41.4) | 857 (406–1660) |
| Nord-Kivu | 7574000 | 4.5 (2.4–8.9) | 6.1 (2.4–13.1) | 10.7 (5.1–21.5) | 811 (384–1629) |
| Haut-Uele | 2046000 | 3.2 (1.5–7.6) | 3.6 (1.4–8.5) | 7.0 (3.1–15.7) | 143 (62–321) |
| Tshopo | 2582000 | 0.5 (0.2–1.2) | 0.6 (0.2–1.5) | 1.2 (0.5–2.6) | 30 (12–68) |
| Nord-Ubangi | 1425000 | 0.2 (0.1–0.8) | 0.2 (0.1–0.7) | 0.4 (0.1–1.5) | 6 (2–21) |
| Bas-Uele | 1250000 | 0.1 (0.0–0.2) | 0.1 (0.0–0.2) | 0.1 (0.0–0.4) | 2 (0–5) |
| Sud-Ubangi | 2755000 | 0.0 (0.0–0.0) | 0.0 (0.0–0.0) | 0.0 (0.0–0.1) | 0 (0–2) |
| Sud-Kivu | 6565000 | 0.0 (0.0–0.0) | 0.0 (0.0–0.0) | 0.0 (0.0–0.0) | 0 (0–2) |
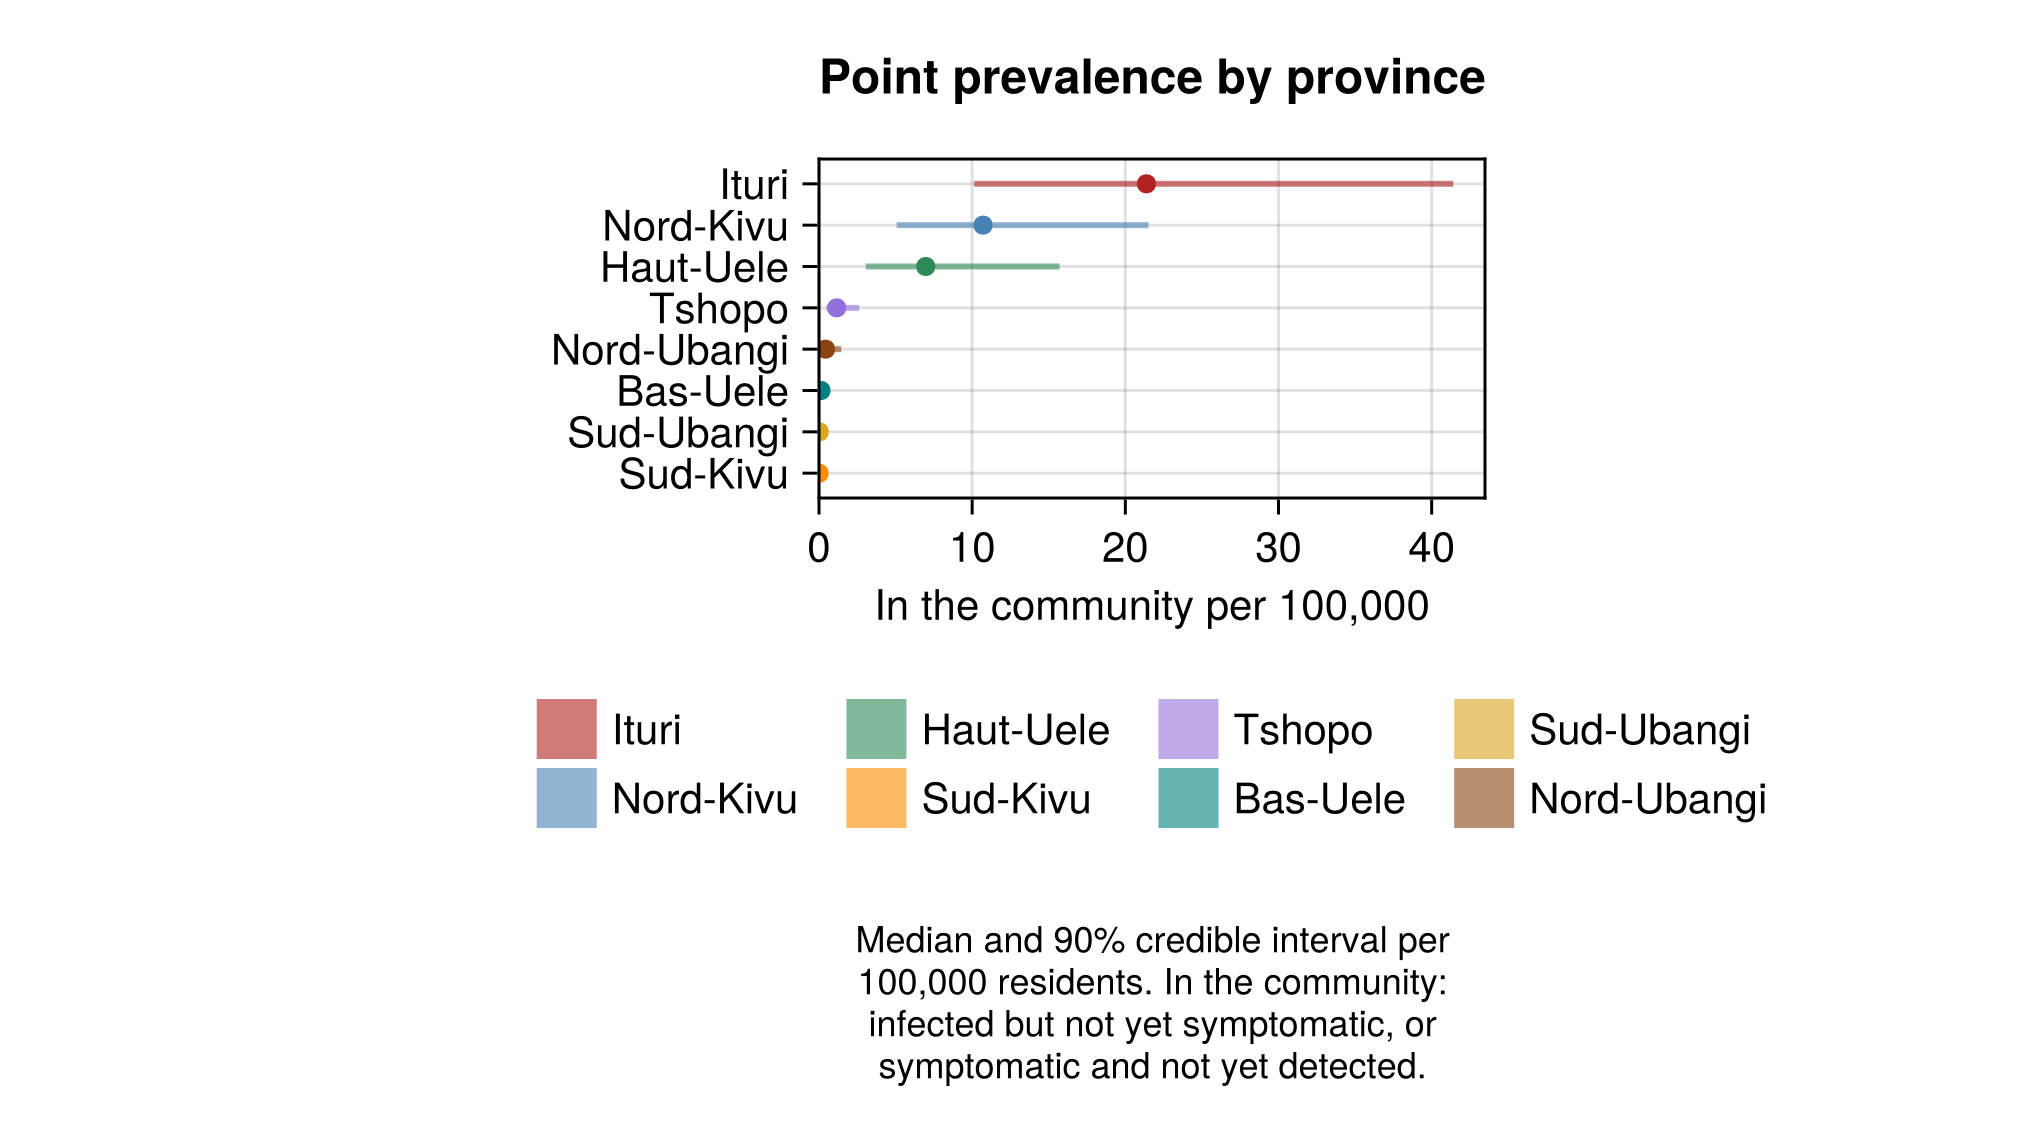
A province rate is an average over zones with different levels of transmission. The health-zone estimates give the same rates zone by zone.
Reproduction number by province
The national reproduction number is in reproduction number over time.
Reproduction number by province
province_rt_fig = plot_rt_patches(
    chn_joint;
    n = obs.n, breakpoint = _BREAKPOINT,
    n_patches = N_PATCHES,
    rt_start = _rt_start_plot,
    rt_walk_start = clamp(_BREAKPOINT - RT_WALK_LEAD, _rt_start_plot, obs.n),
    display_start = _rt_start_plot,
    as_of_date = string(obs.cutoff), seeding = obs.seeding,
    ramp = RT_INTERVENTION_RAMP
);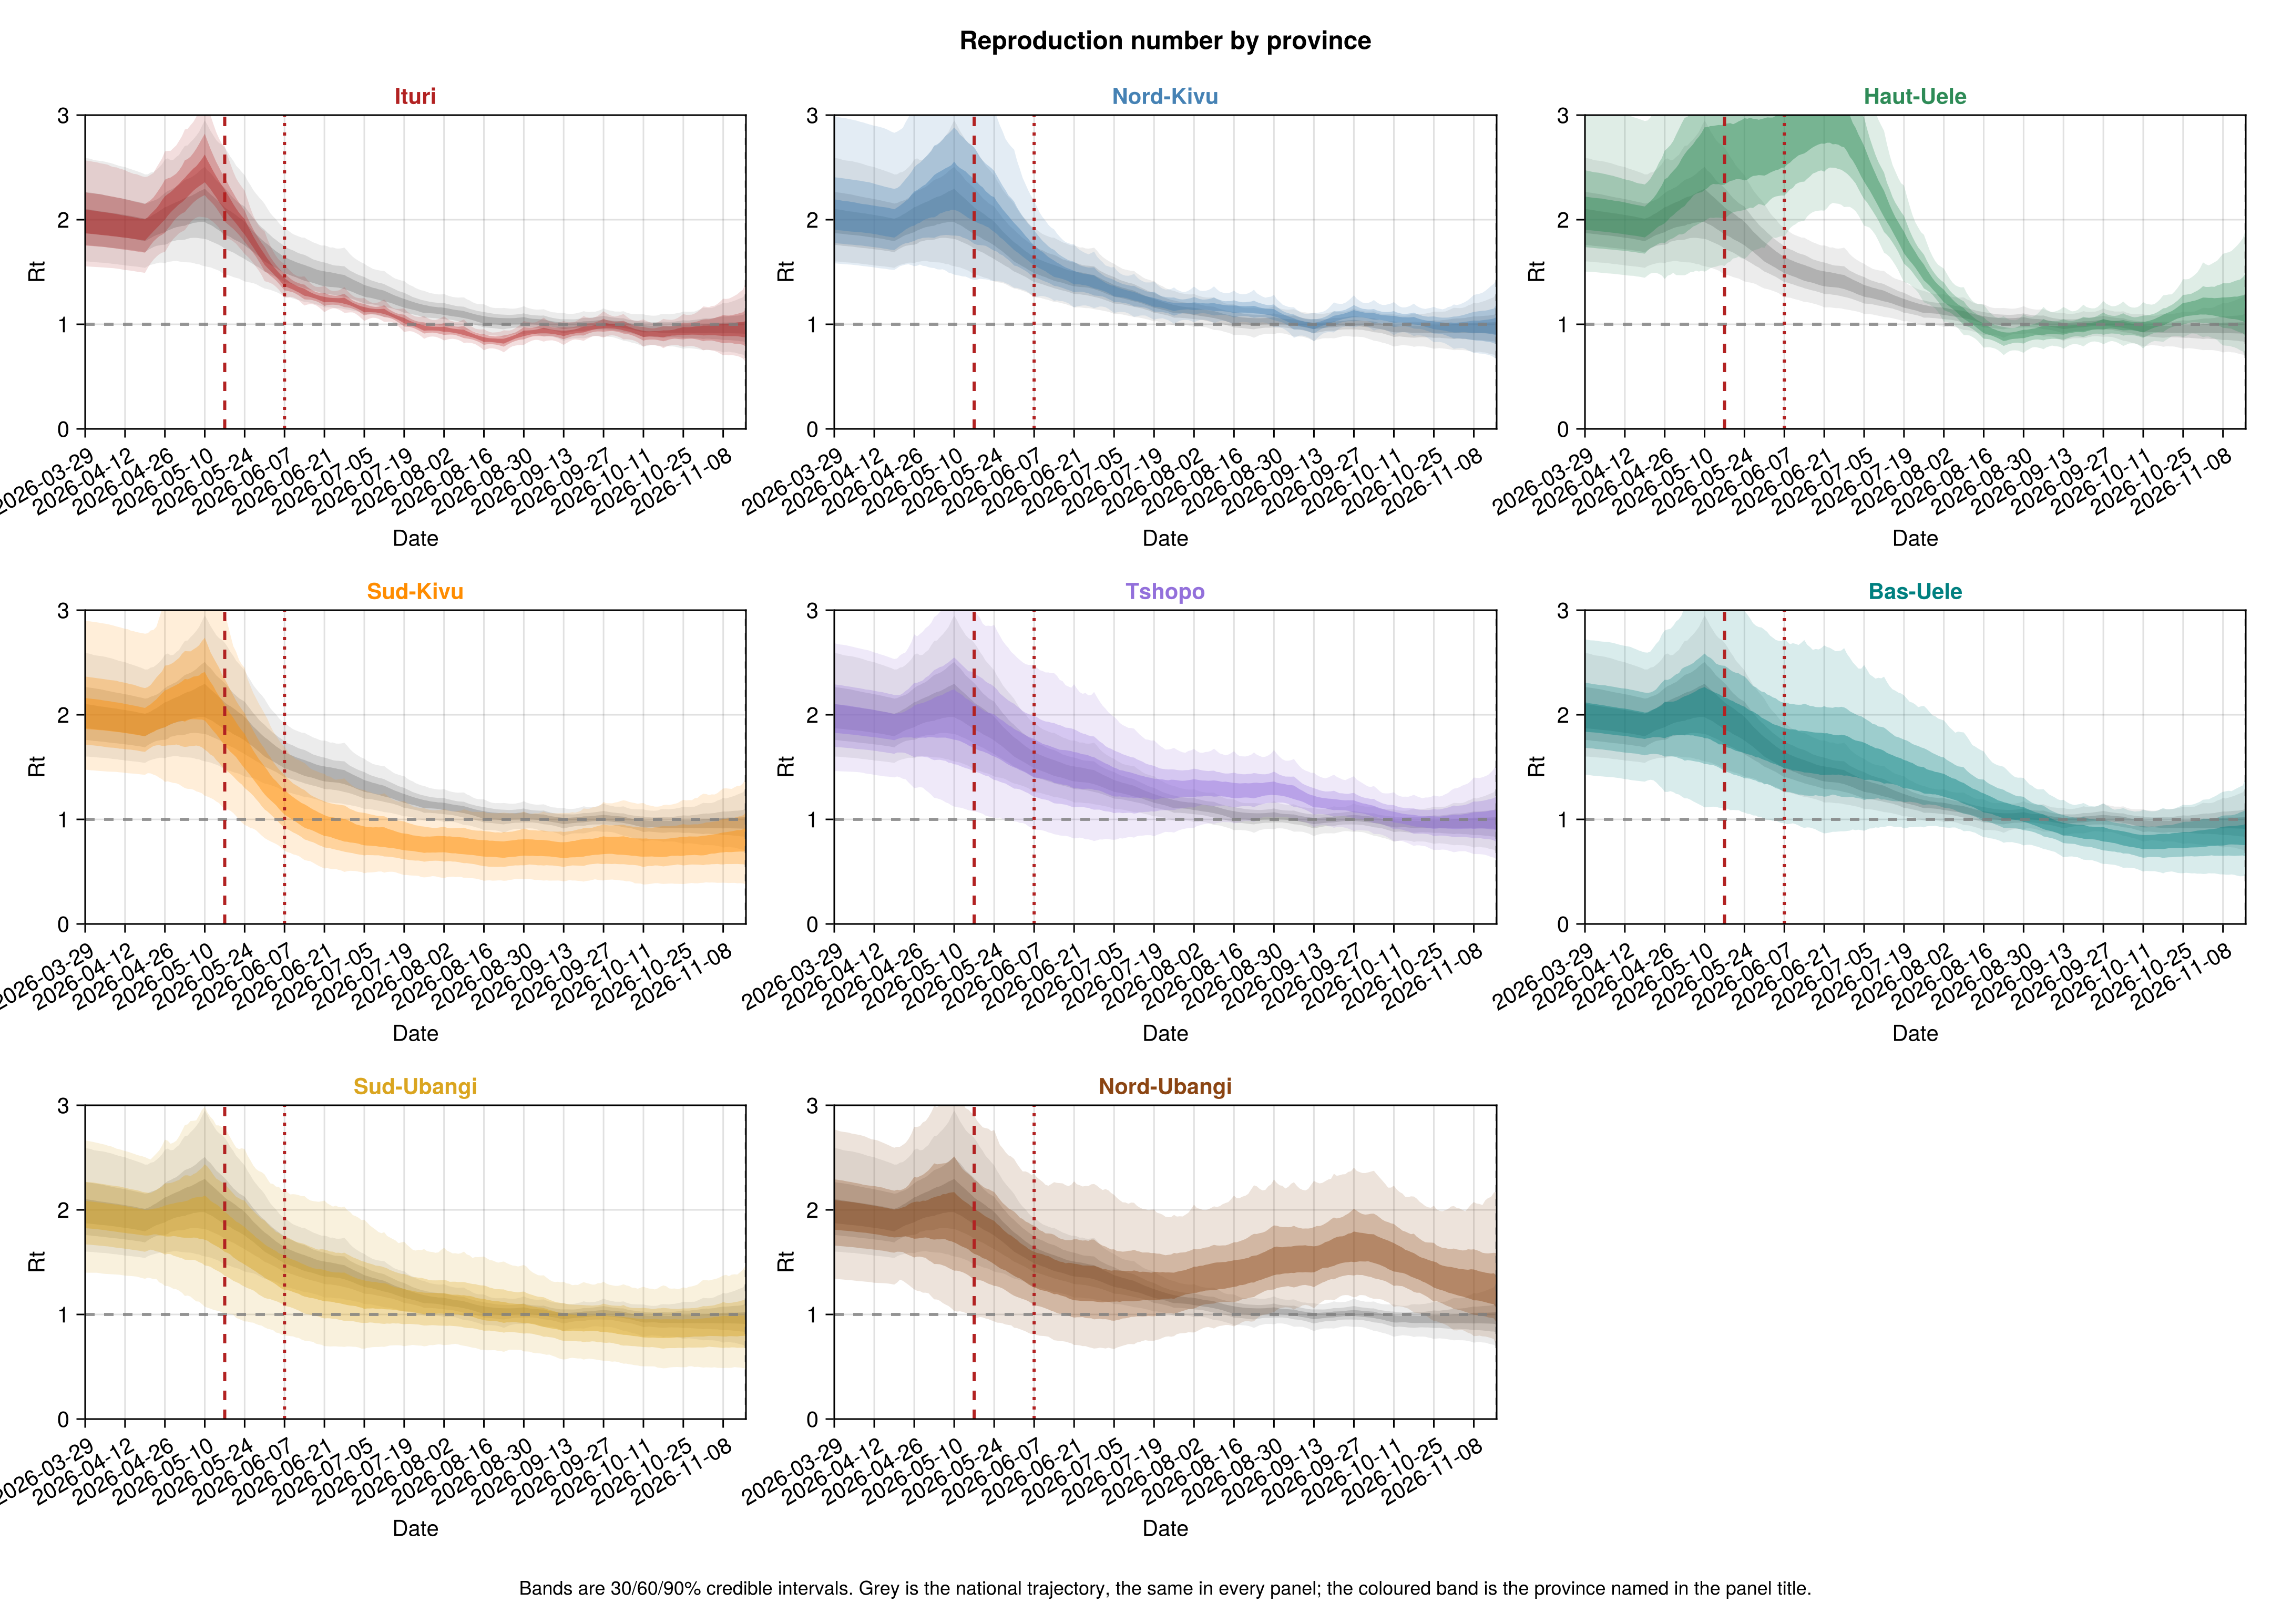
The spread of the provinces' log-Rt deviations is the spatial diagnostic. With eight patches and five of them carrying little signal, the cross-province correlation is not identified and tracks its prior.
Spatial hyperparameter summary table
spatial_hyper_table = summary_table(
    chn_joint,
    [
        :region_sd, :region_halflife, :region_corr_primary_secondary,
        :province_suspected_ascertainment_sd, :province_ascertainment_sd,
    ];
    digits = 3, labels = spatial_labels
);| Row | Quantity | Lower 90% | Lower 60% | Lower 30% | Upper 30% | Upper 60% | Upper 90% |
|---|---|---|---|---|---|---|---|
| String | Float64 | Float64 | Float64 | Float64 | Float64 | Float64 | |
| 1 | Rt deviation spread | 0.008 | 0.034 | 0.066 | 0.141 | 0.199 | 0.31 |
| 2 | Rt deviation half-life (days) | 26.693 | 37.253 | 45.575 | 66.338 | 83.709 | 128.464 |
| 3 | Ituri-N.Kivu Rt correlation | -0.709 | -0.448 | -0.257 | 0.083 | 0.281 | 0.609 |
| 4 | Detection spread (logit) | 0.027 | 0.101 | 0.174 | 0.356 | 0.482 | 0.758 |
| 5 | Confirmation spread | 0.01 | 0.044 | 0.081 | 0.172 | 0.228 | 0.352 |
Case-fatality ratio by province
The case-fatality ratio of each province is set against the national ratios in the confirmed case-fatality ratio. Only the product of a province's lethality and death confirmation is identified, and the province compositions Methods section says how the priors split it.
Province case-fatality spread
province_cfr_spread = summary_table(
    chn_joint,
    [:province_cfr_sd, :province_death_ascertainment_sd];
    digits = 3, labels = spatial_labels
);| Row | Quantity | Lower 90% | Lower 60% | Lower 30% | Upper 30% | Upper 60% | Upper 90% |
|---|---|---|---|---|---|---|---|
| String | Float64 | Float64 | Float64 | Float64 | Float64 | Float64 | |
| 1 | Lethality spread (logit) | 0.01 | 0.042 | 0.076 | 0.157 | 0.218 | 0.308 |
| 2 | Death-confirmation spread | 0.008 | 0.03 | 0.055 | 0.107 | 0.146 | 0.212 |
Province case-fatality table
confirmed_cfr = delay_corrected_confirmed_cfr(
    chn_joint;
    obs_confirmed = obs.confirmed_cases,
    obs_confirmed_deaths = obs.confirmed_deaths
);
province_cfr = province_cfr_table(
    chn_joint, confirmed_cfr;
    province_cases = vec(sum(province_cases.increments; dims = 2)),
    province_deaths = vec(sum(province_deaths.increments; dims = 2)),
    n_patches = N_PATCHES
);| Row | Province | Naive observed confirmed ratio | Delay-corrected confirmed CFR | Structural (infection-based) CFR |
|---|---|---|---|---|
| String | String | String | String | |
| 1 | Ituri | 47.3% | 46.9% (39.7–57.1%) | 51.5% (38.9–64.0%) |
| 2 | Nord-Kivu | 55.5% | 60.7% (51.0–74.9%) | 54.6% (41.9–67.2%) |
| 3 | Haut-Uele | 43.1% | 47.2% (39.1–58.6%) | 51.5% (38.5–63.4%) |
| 4 | Sud-Kivu | 33.3% | 47.4% (31.9–71.9%) | 52.0% (38.7–64.4%) |
| 5 | Tshopo | 30.6% | 42.1% (31.6–53.1%) | 51.2% (38.7–63.1%) |
| 6 | Bas-Uele | 30.8% | 45.0% (30.8–62.0%) | 51.7% (38.5–63.6%) |
| 7 | Sud-Ubangi | 50.0% | 47.8% (32.5–73.1%) | 51.9% (38.8–64.9%) |
| 8 | Nord-Ubangi | 10.0% | 44.0% (30.0–61.5%) | 51.5% (38.5–64.4%) |
Province parameters against their priors
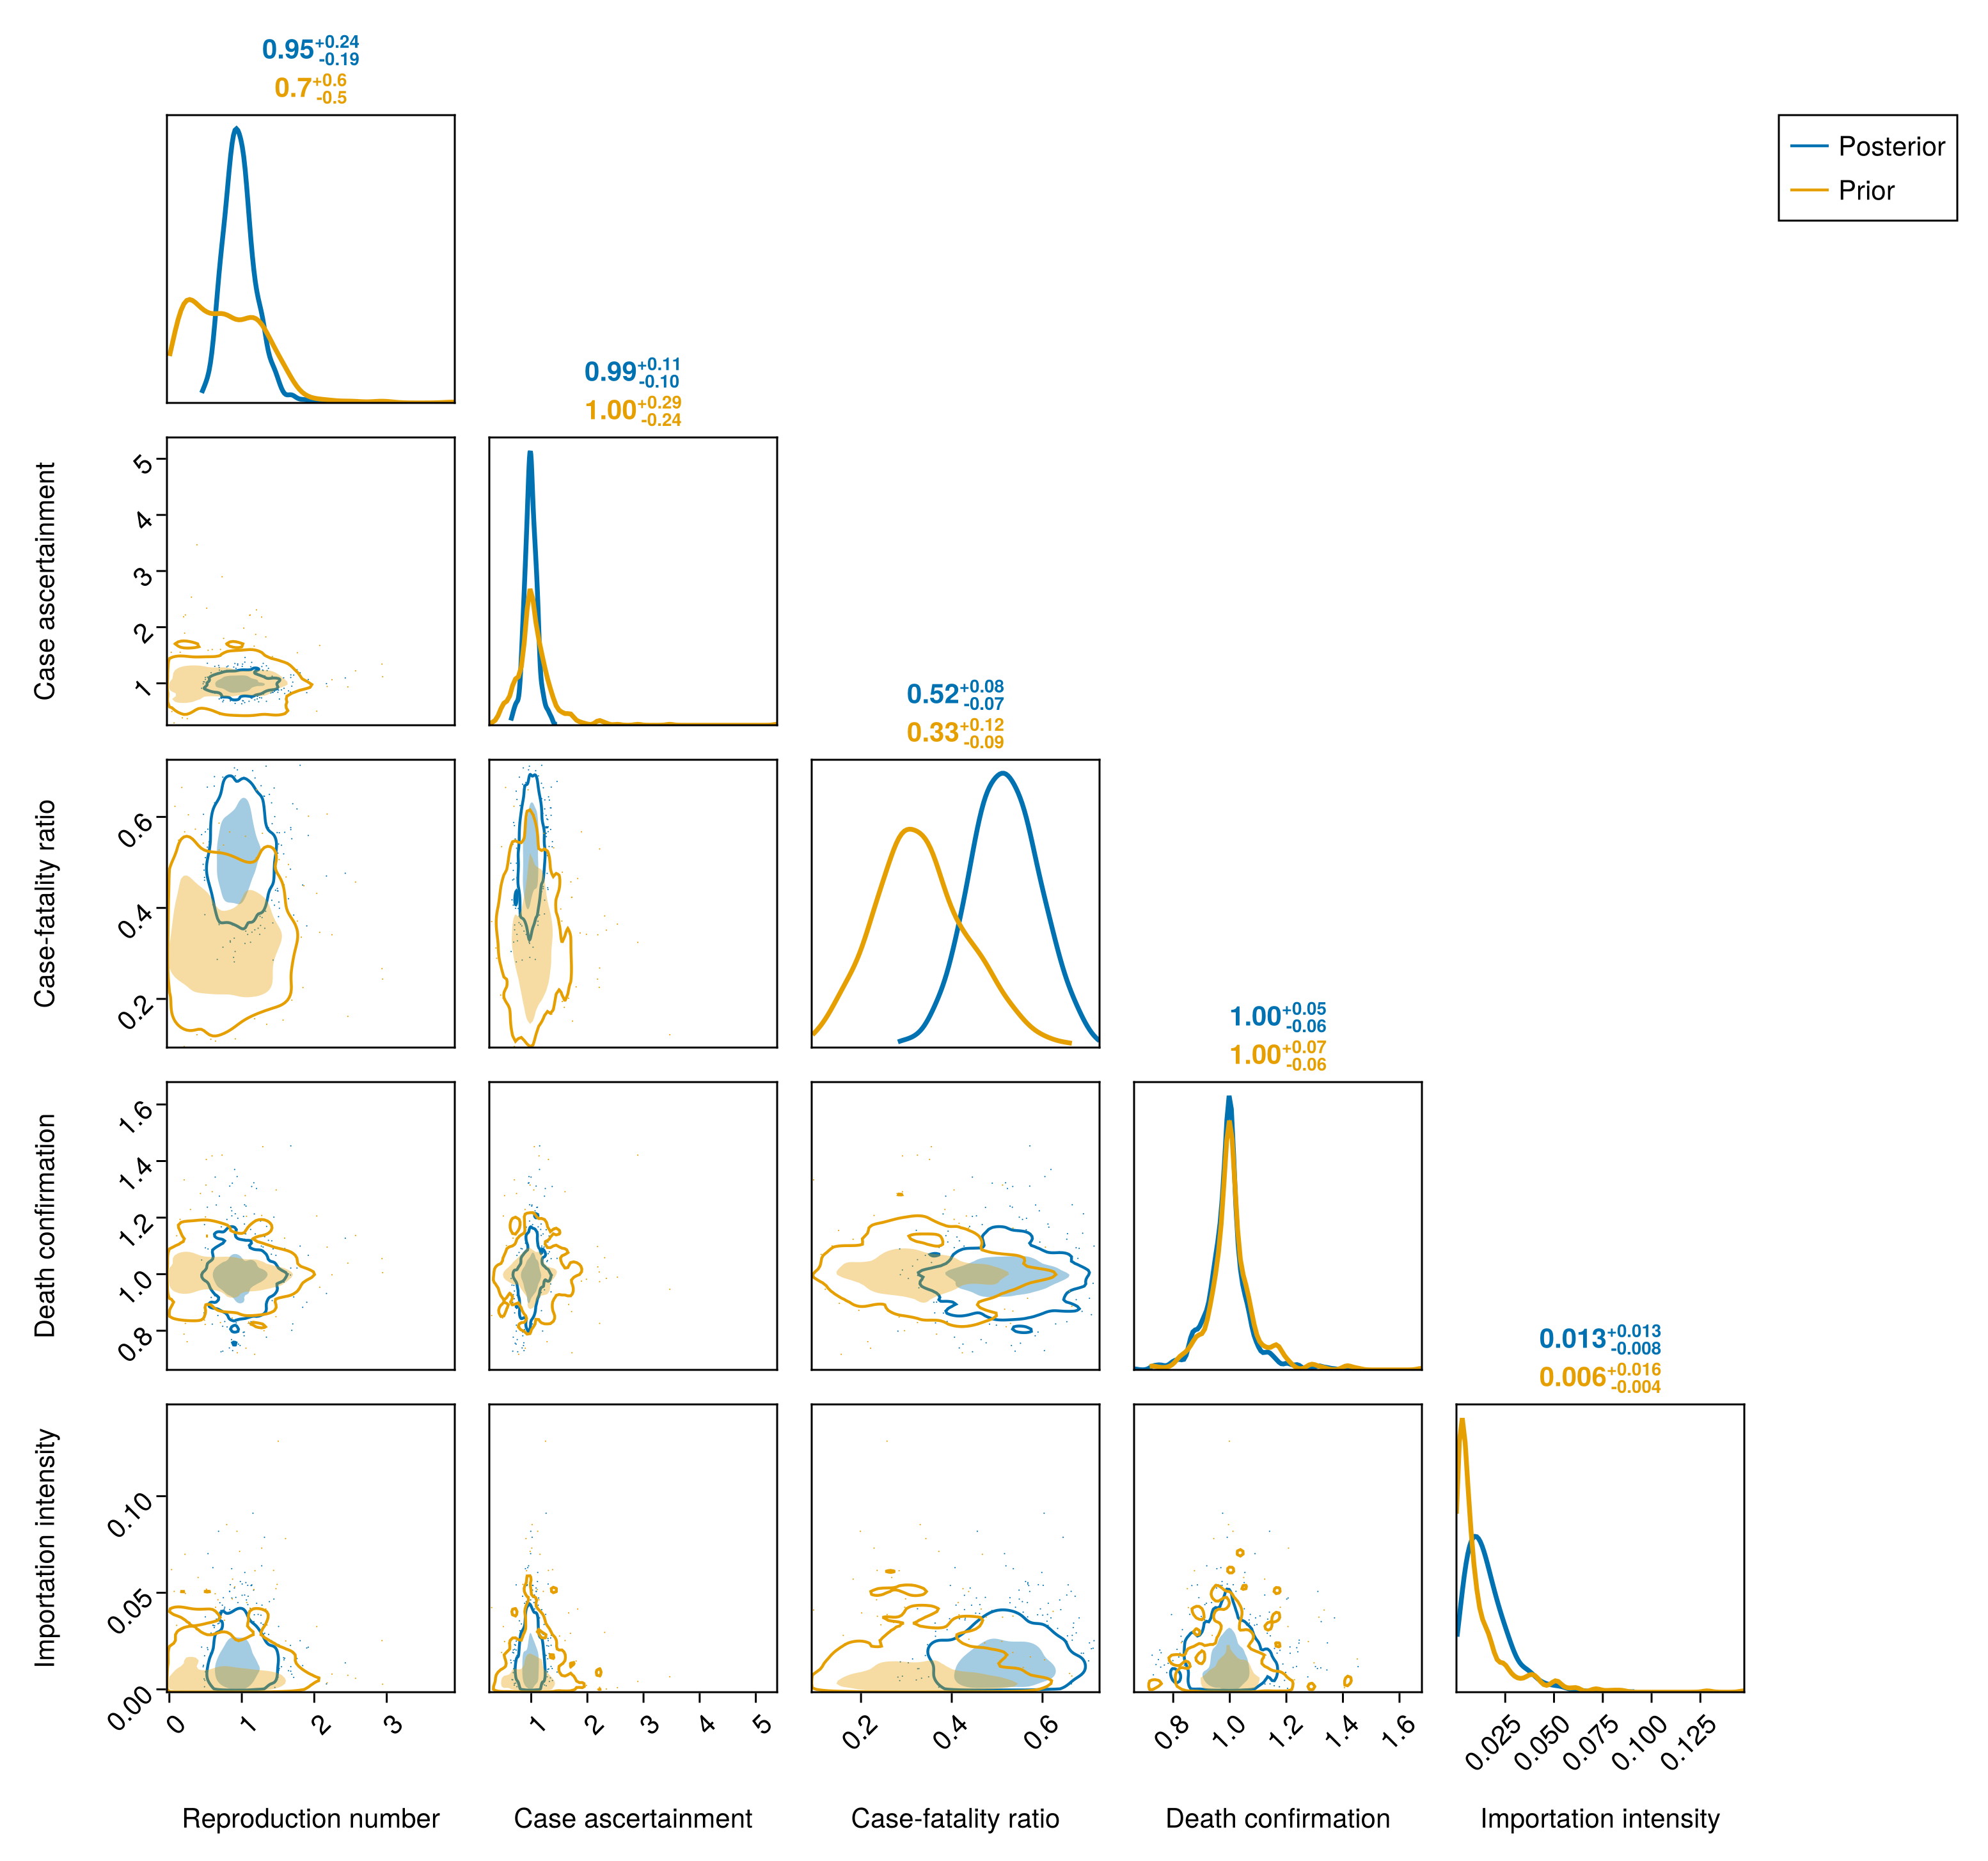
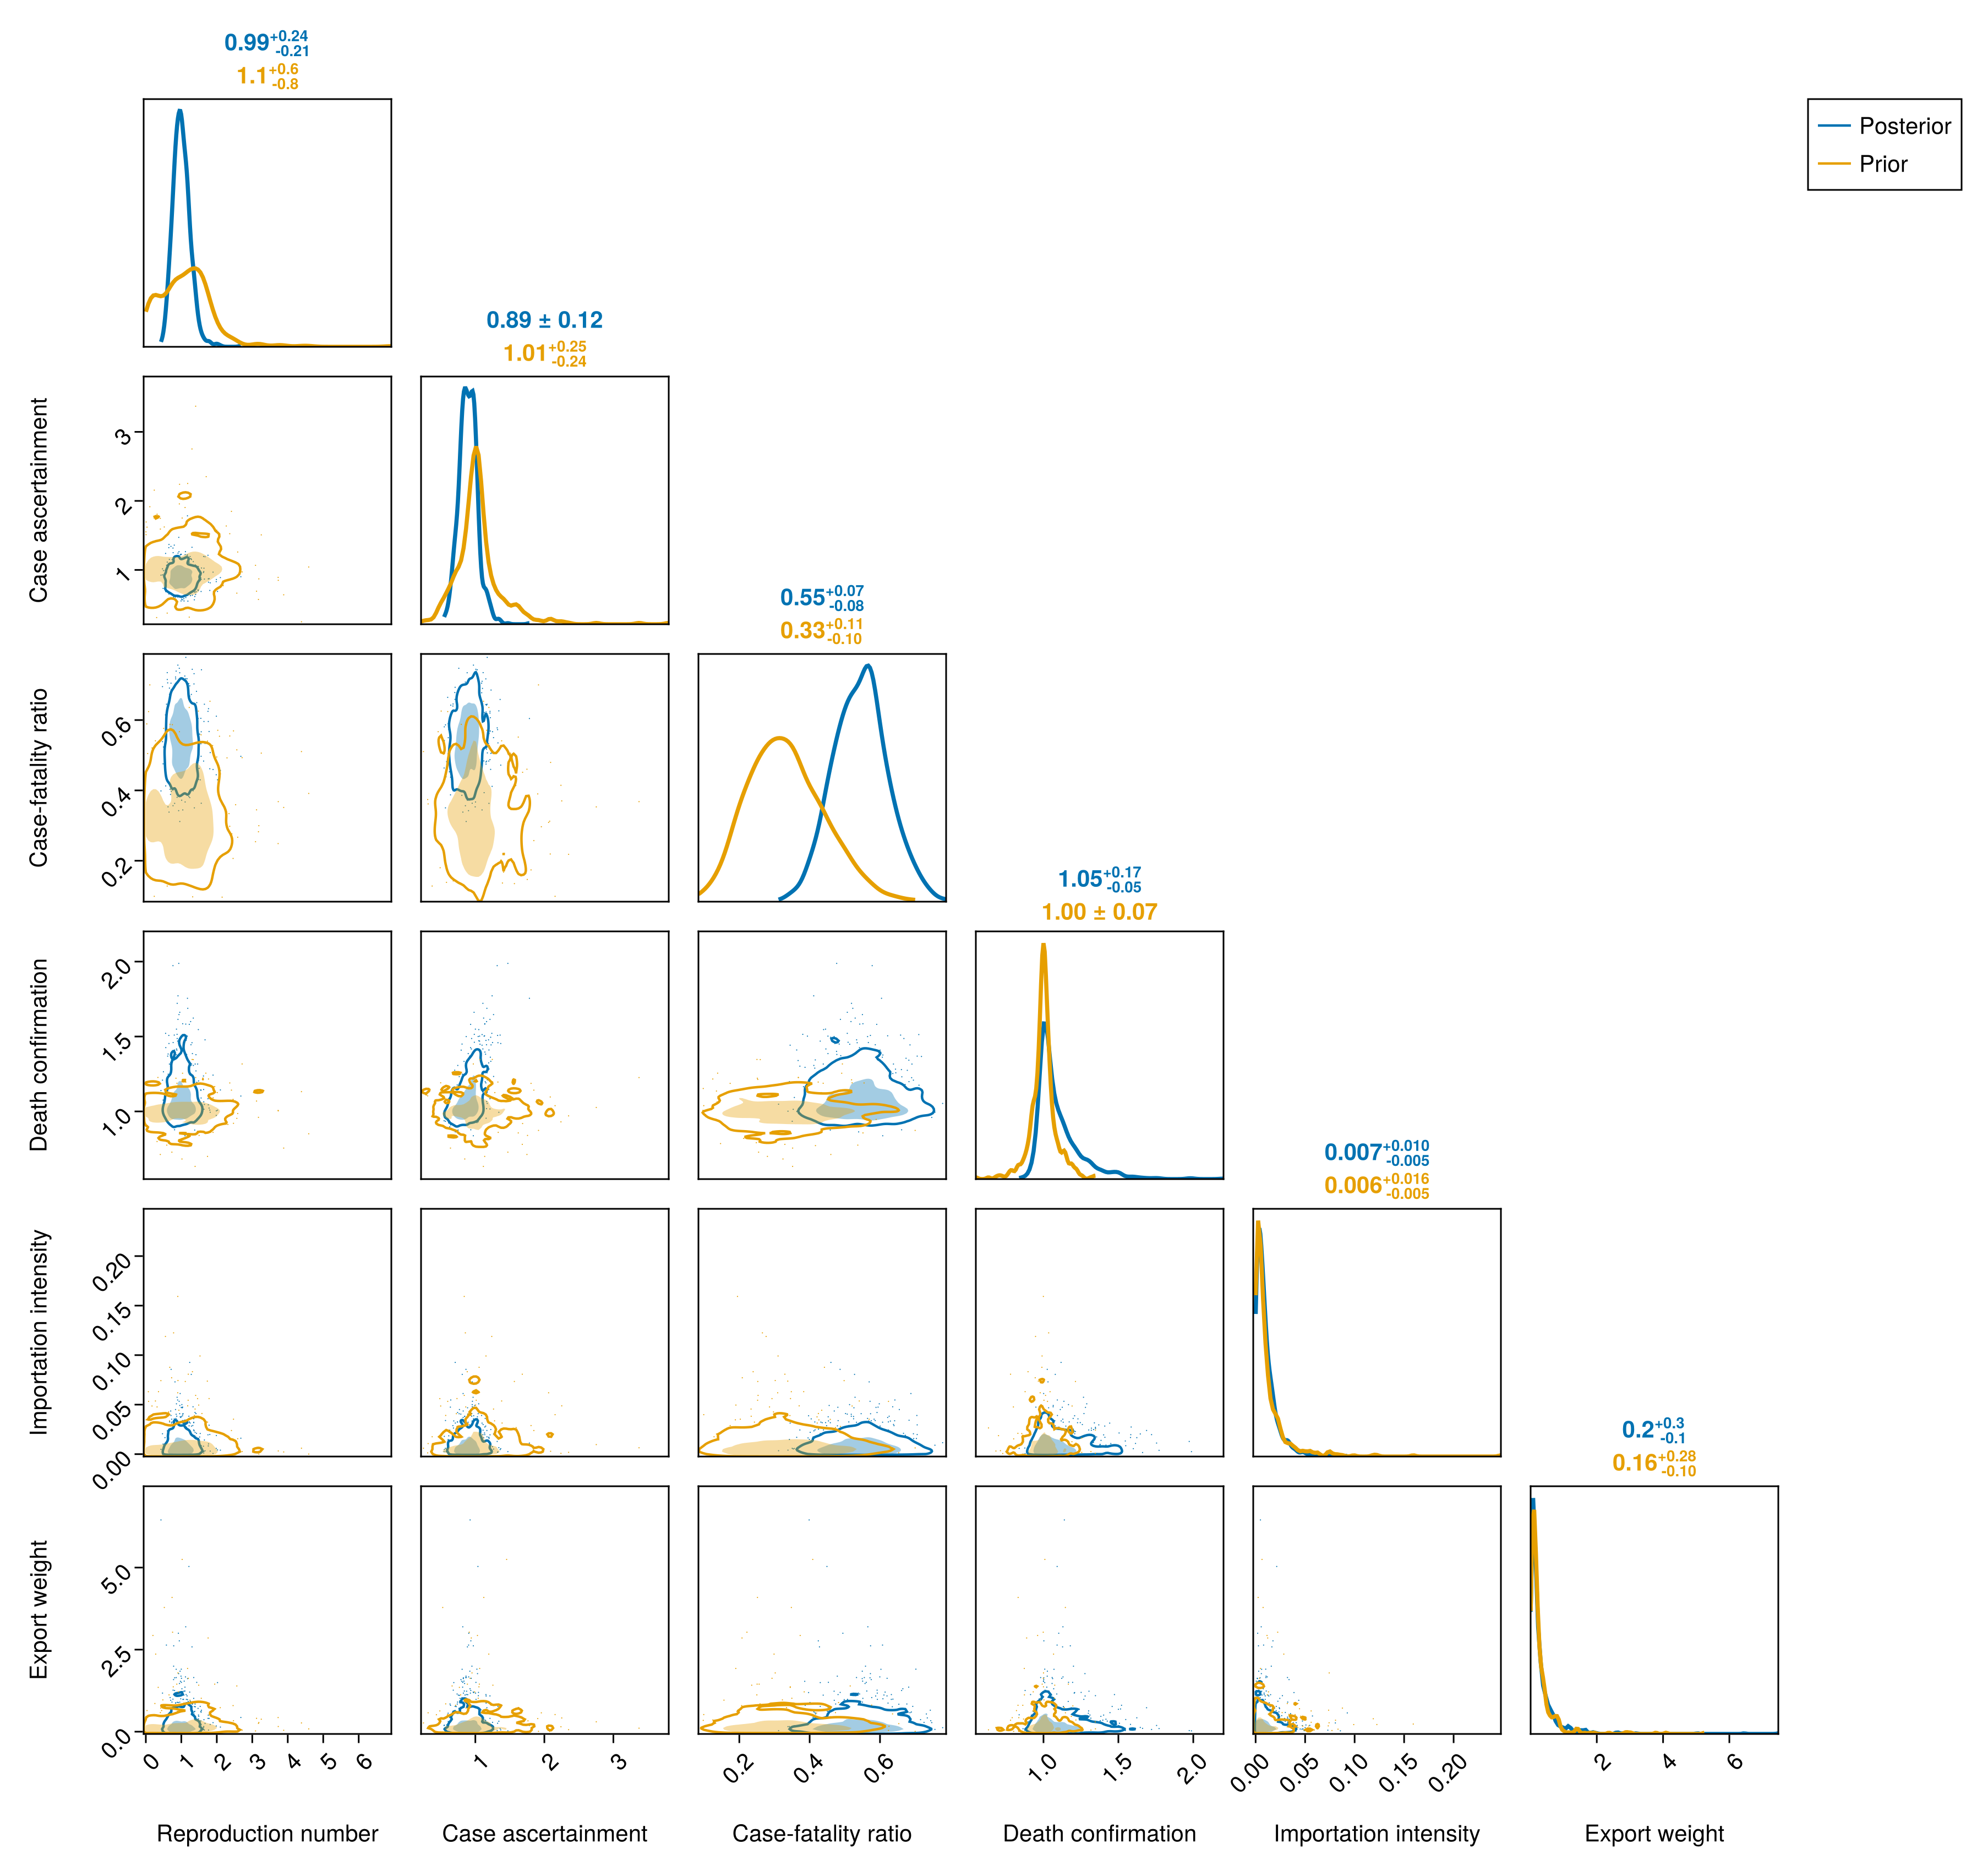
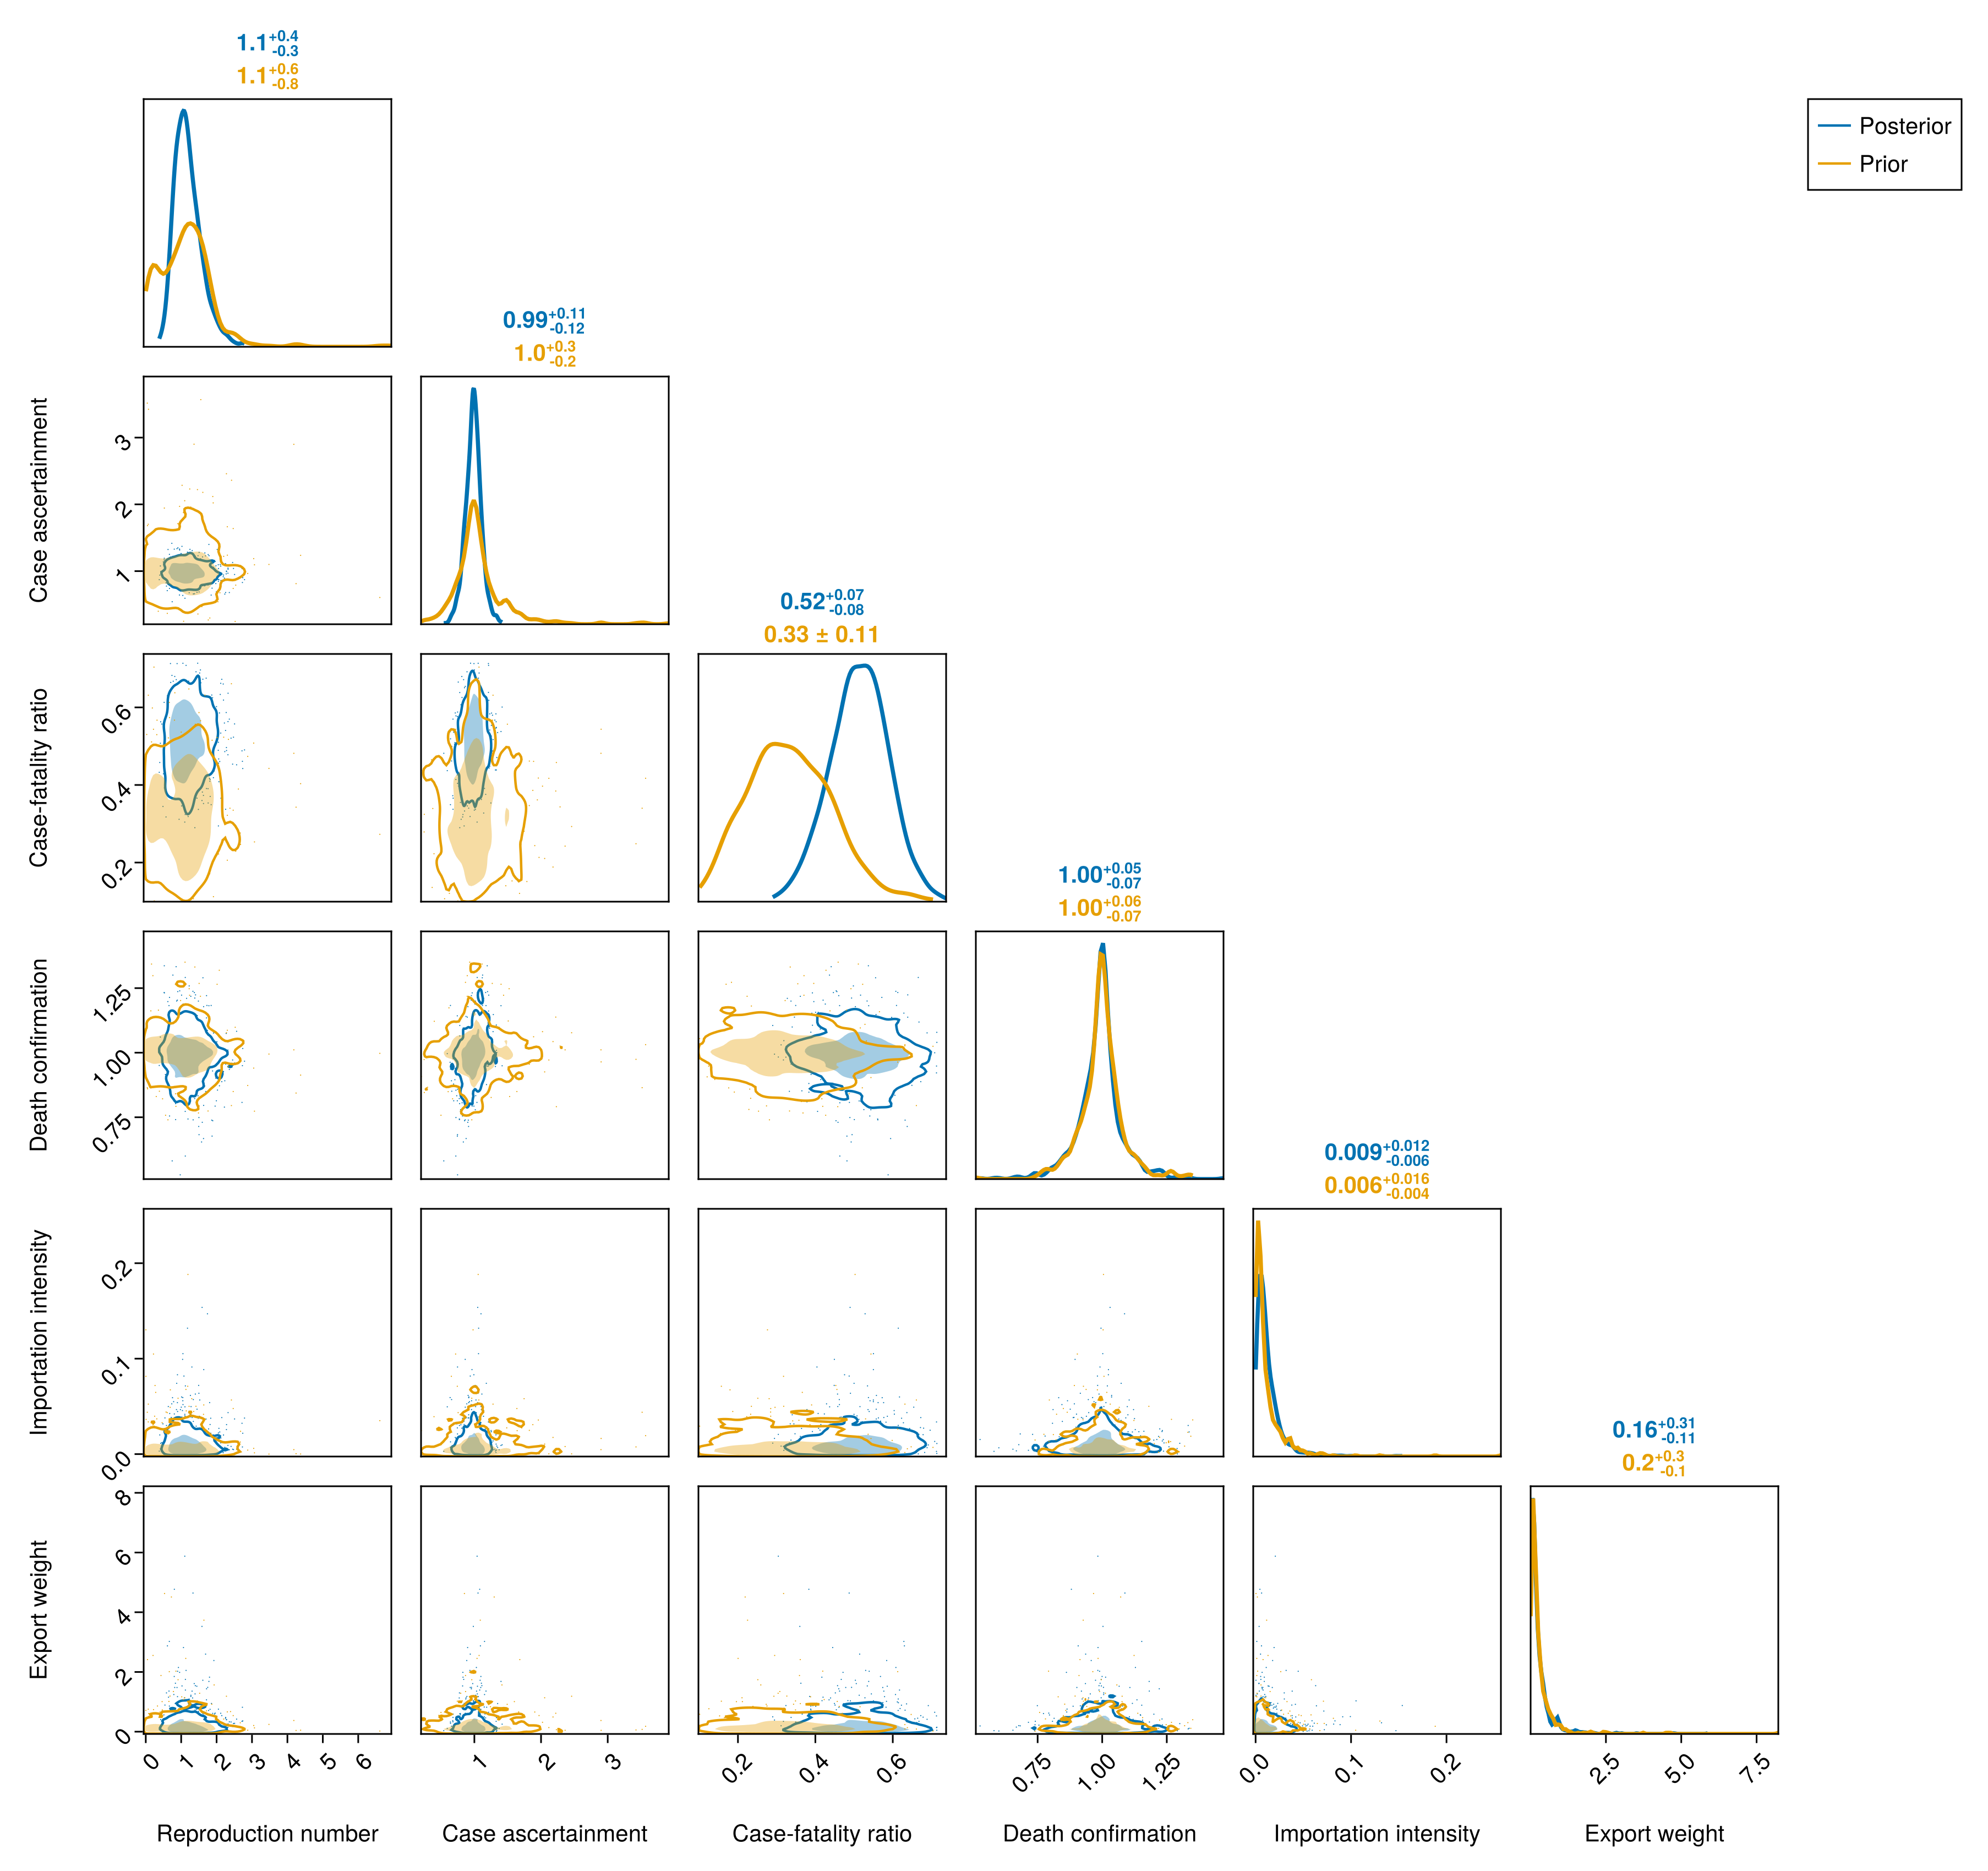
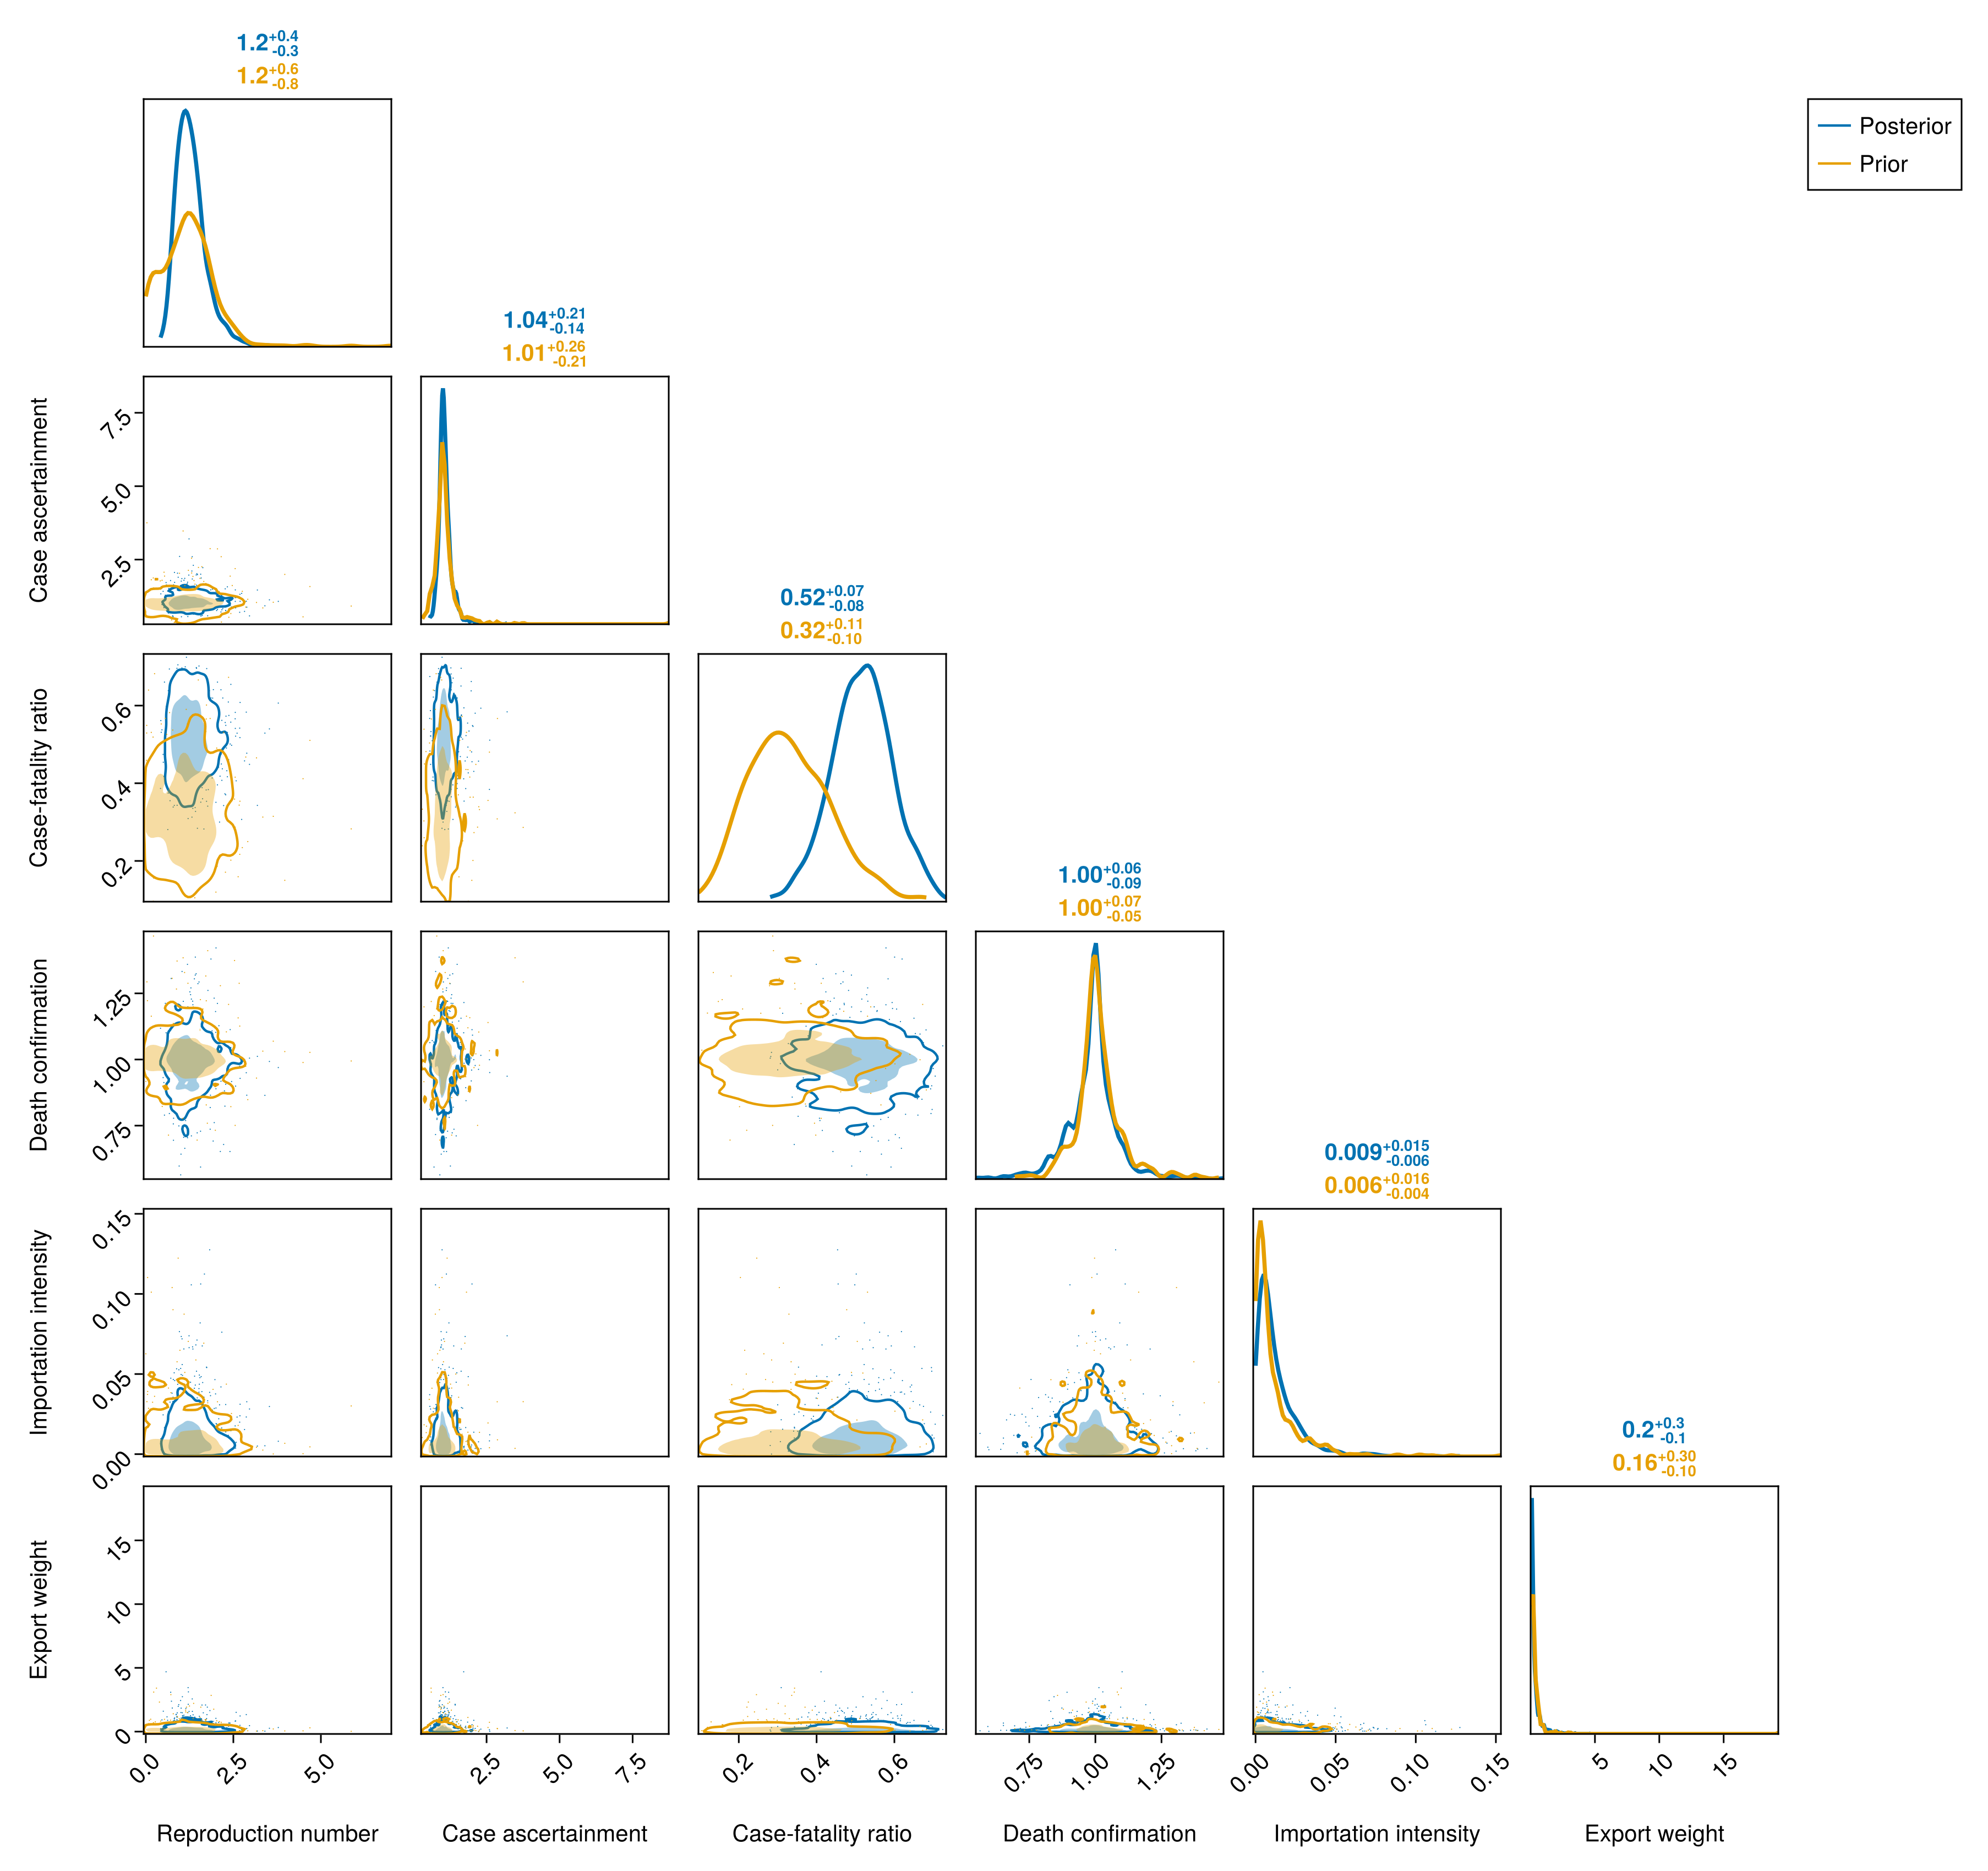
The pair plots below set the province parameters against their prior, drawn from the province model. The spatial hyperparameters against their prior are on the province in-sample checks page.
Draw from the patch model's prior
prior_patch_chn = patch_prior_draws(obs);Each province's pair plot sets the reproduction number at the cut-off against the relative case ascertainment, the case-fatality ratio against the relative death confirmation, and the importation intensity against the export weight relative to Ituri. Each pair is identified only as a product, so a ridge between the two is expected and the prior sets the position along it.
Compute the per-province pair plots
province_pair_labels = Dict(
    :R_T_patch => "Reproduction number",
    :province_ascertainment => "Case ascertainment",
    :CFR_patch => "Case-fatality ratio",
    :province_death_ascertainment => "Death confirmation",
    :importation_epsilon_patch => "Importation intensity",
    :export_weight => "Export weight"
)
# Ituri is the export reference, its weight fixed at one, so its pair plot
# leaves the weight out.
province_pair_figs = [
    plot_pair(
        chn_joint,
        [
            :R_T_patch, :province_ascertainment,
            :CFR_patch, :province_death_ascertainment,
            :importation_epsilon_patch,
            (p == 1 ? () : (:export_weight,))...,
        ];
        patch = p, prior = prior_patch_chn, labels = province_pair_labels
    )
        for p in 1:N_PATCHES
];
Ituri pair plot (prior overlaid)
Nord-Kivu pair plot (prior overlaid)
Haut-Uele pair plot (prior overlaid)
Sud-Kivu pair plot (prior overlaid)
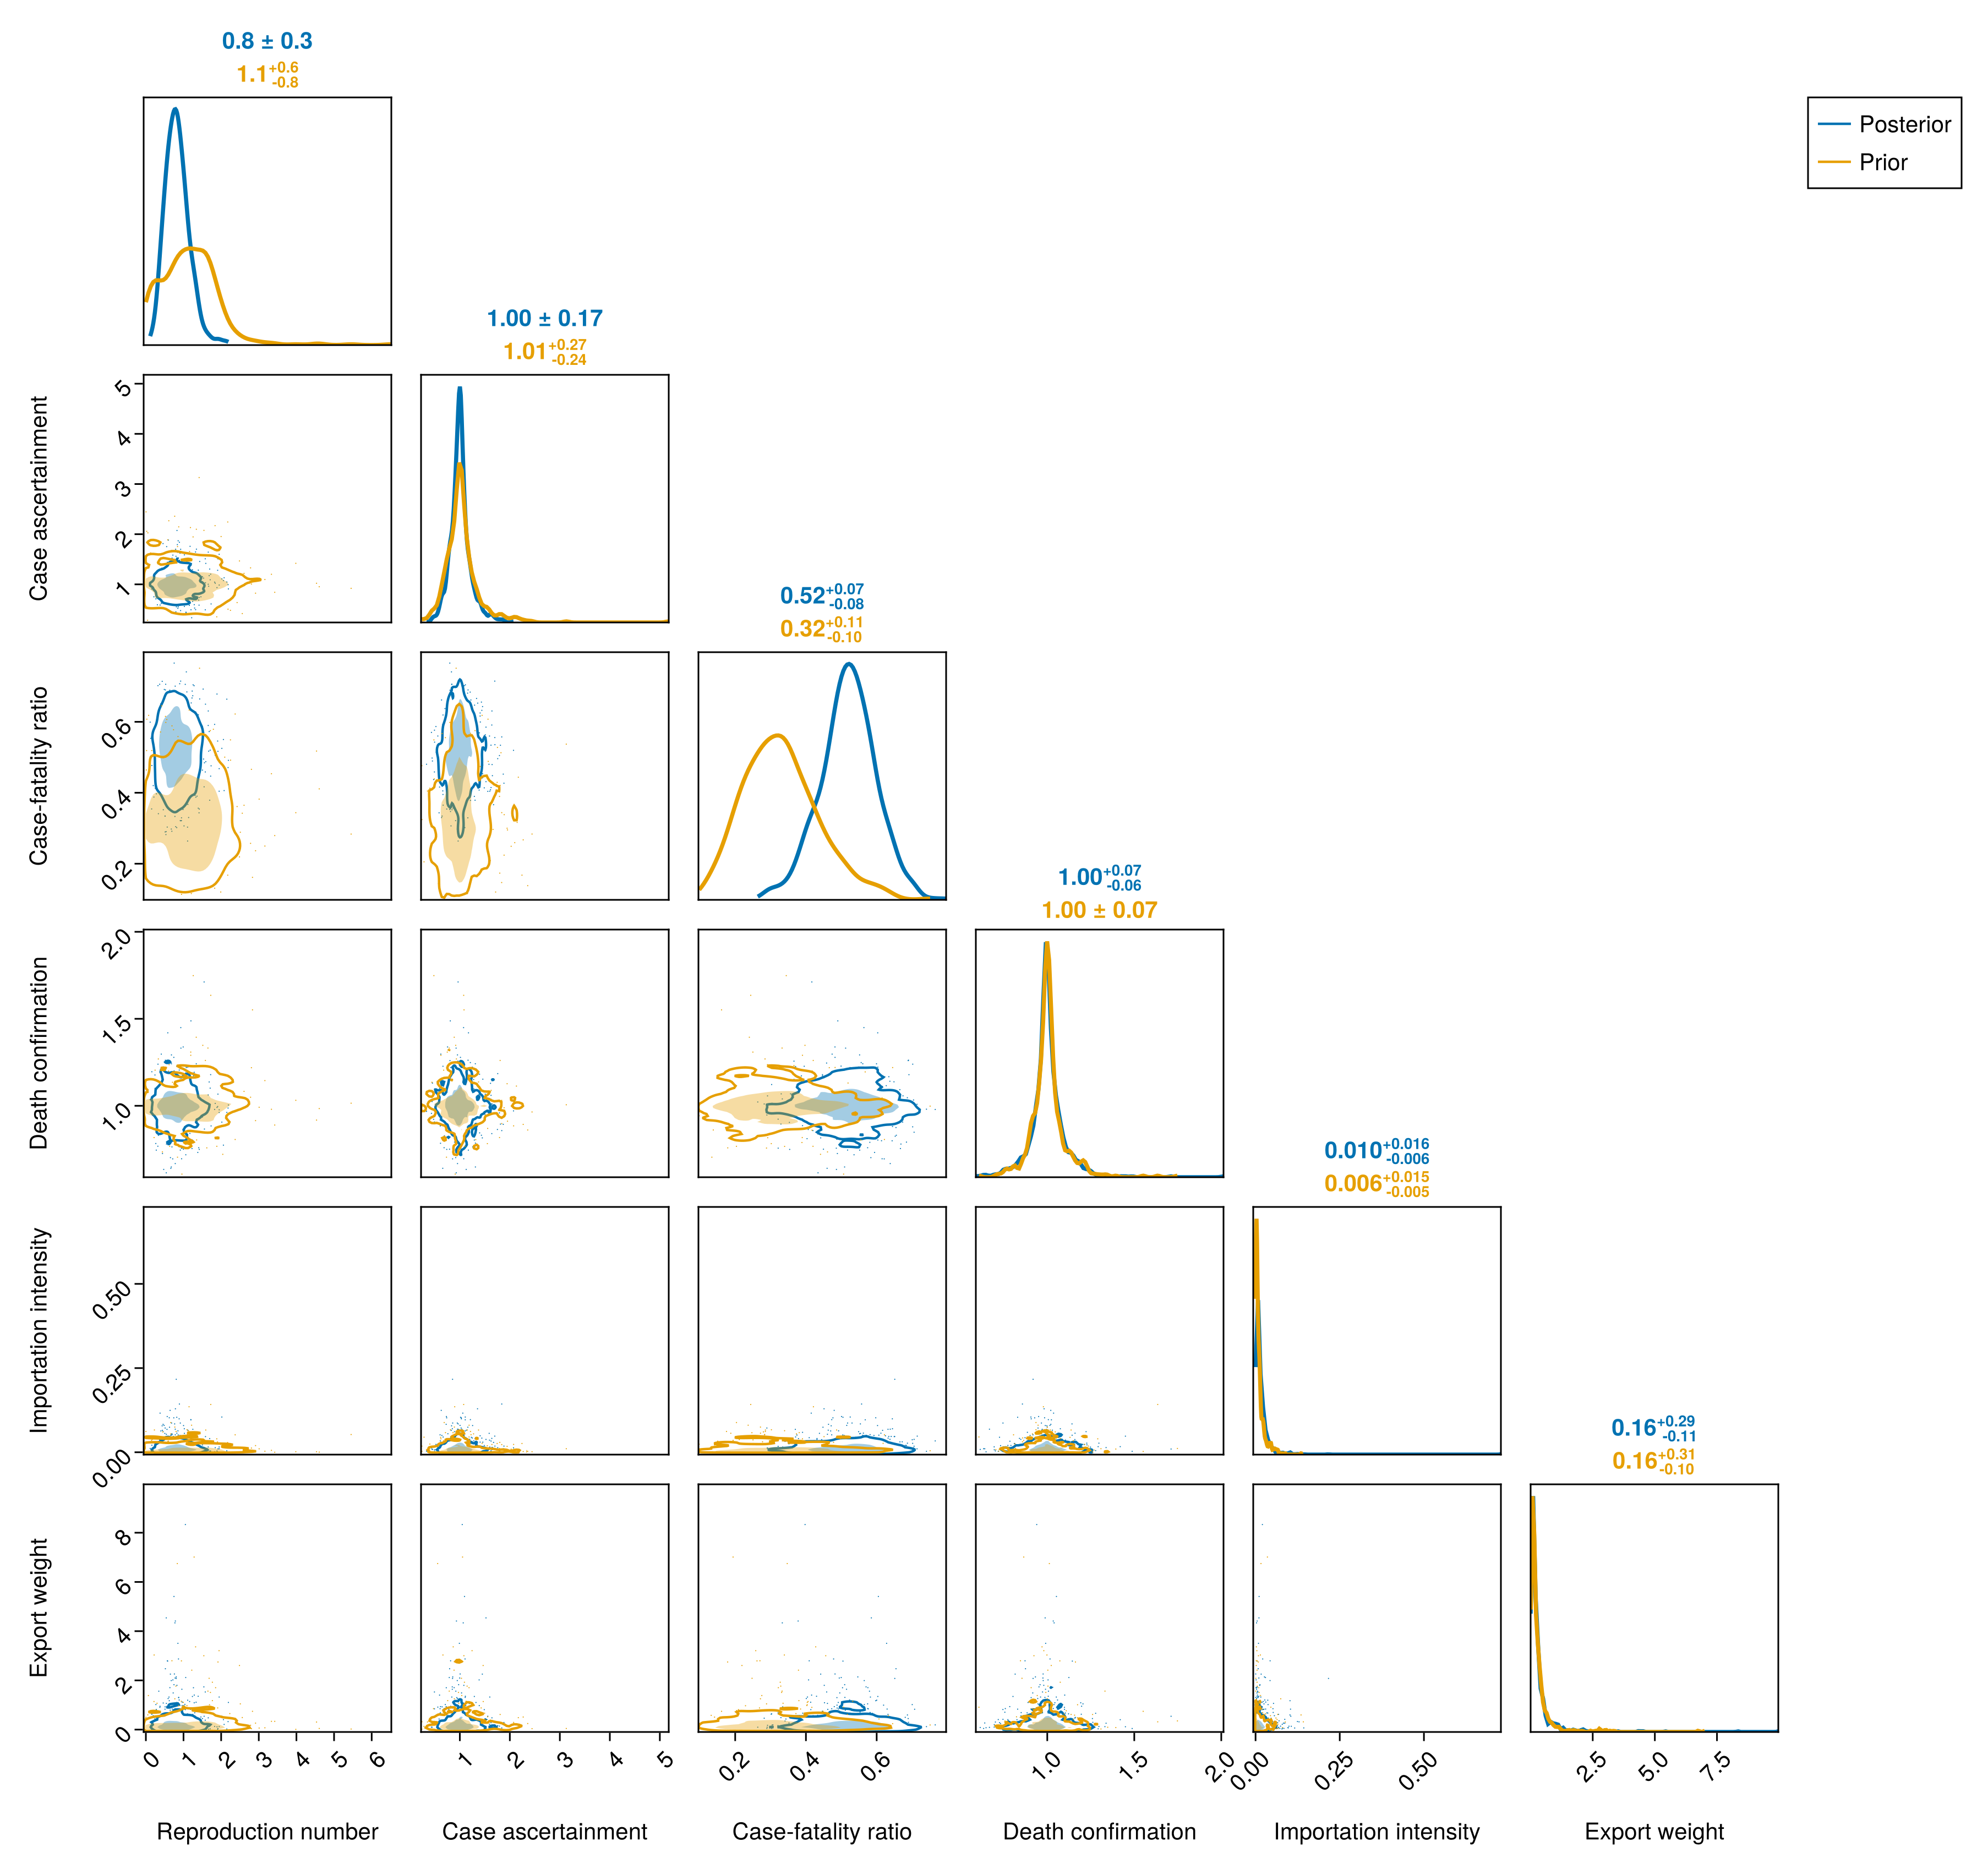
Tshopo pair plot (prior overlaid)
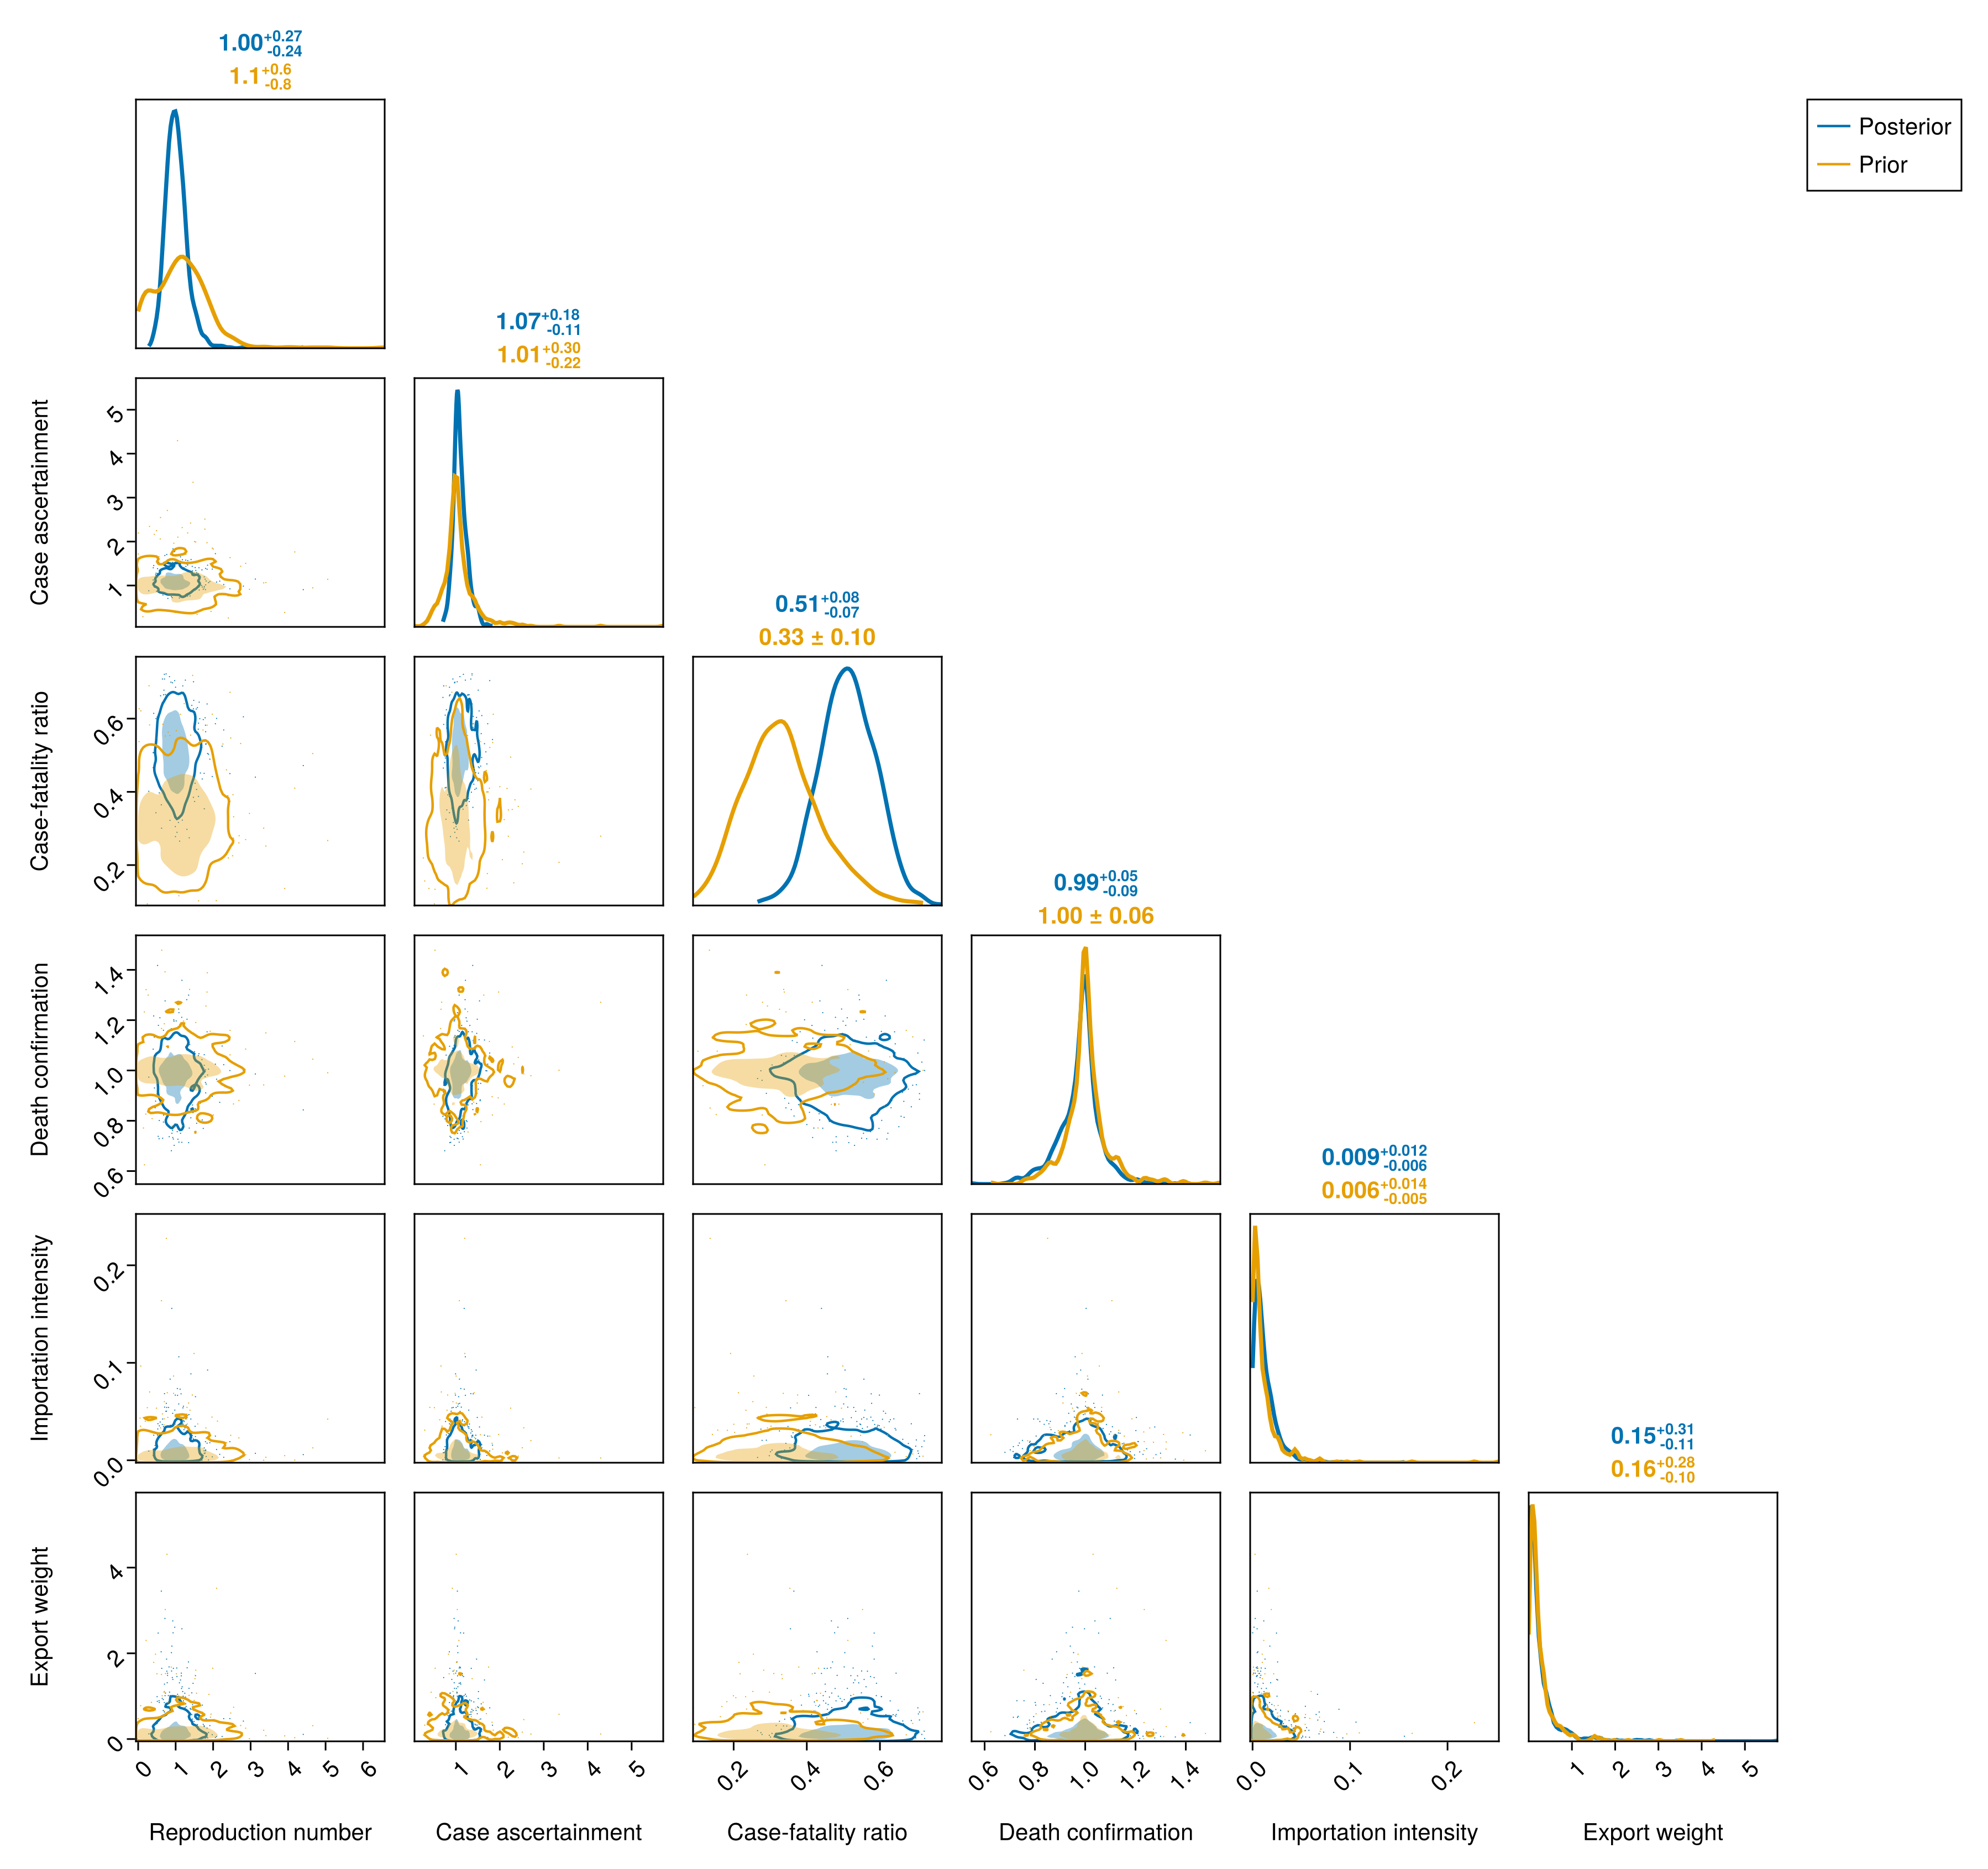
Bas-Uele pair plot (prior overlaid)
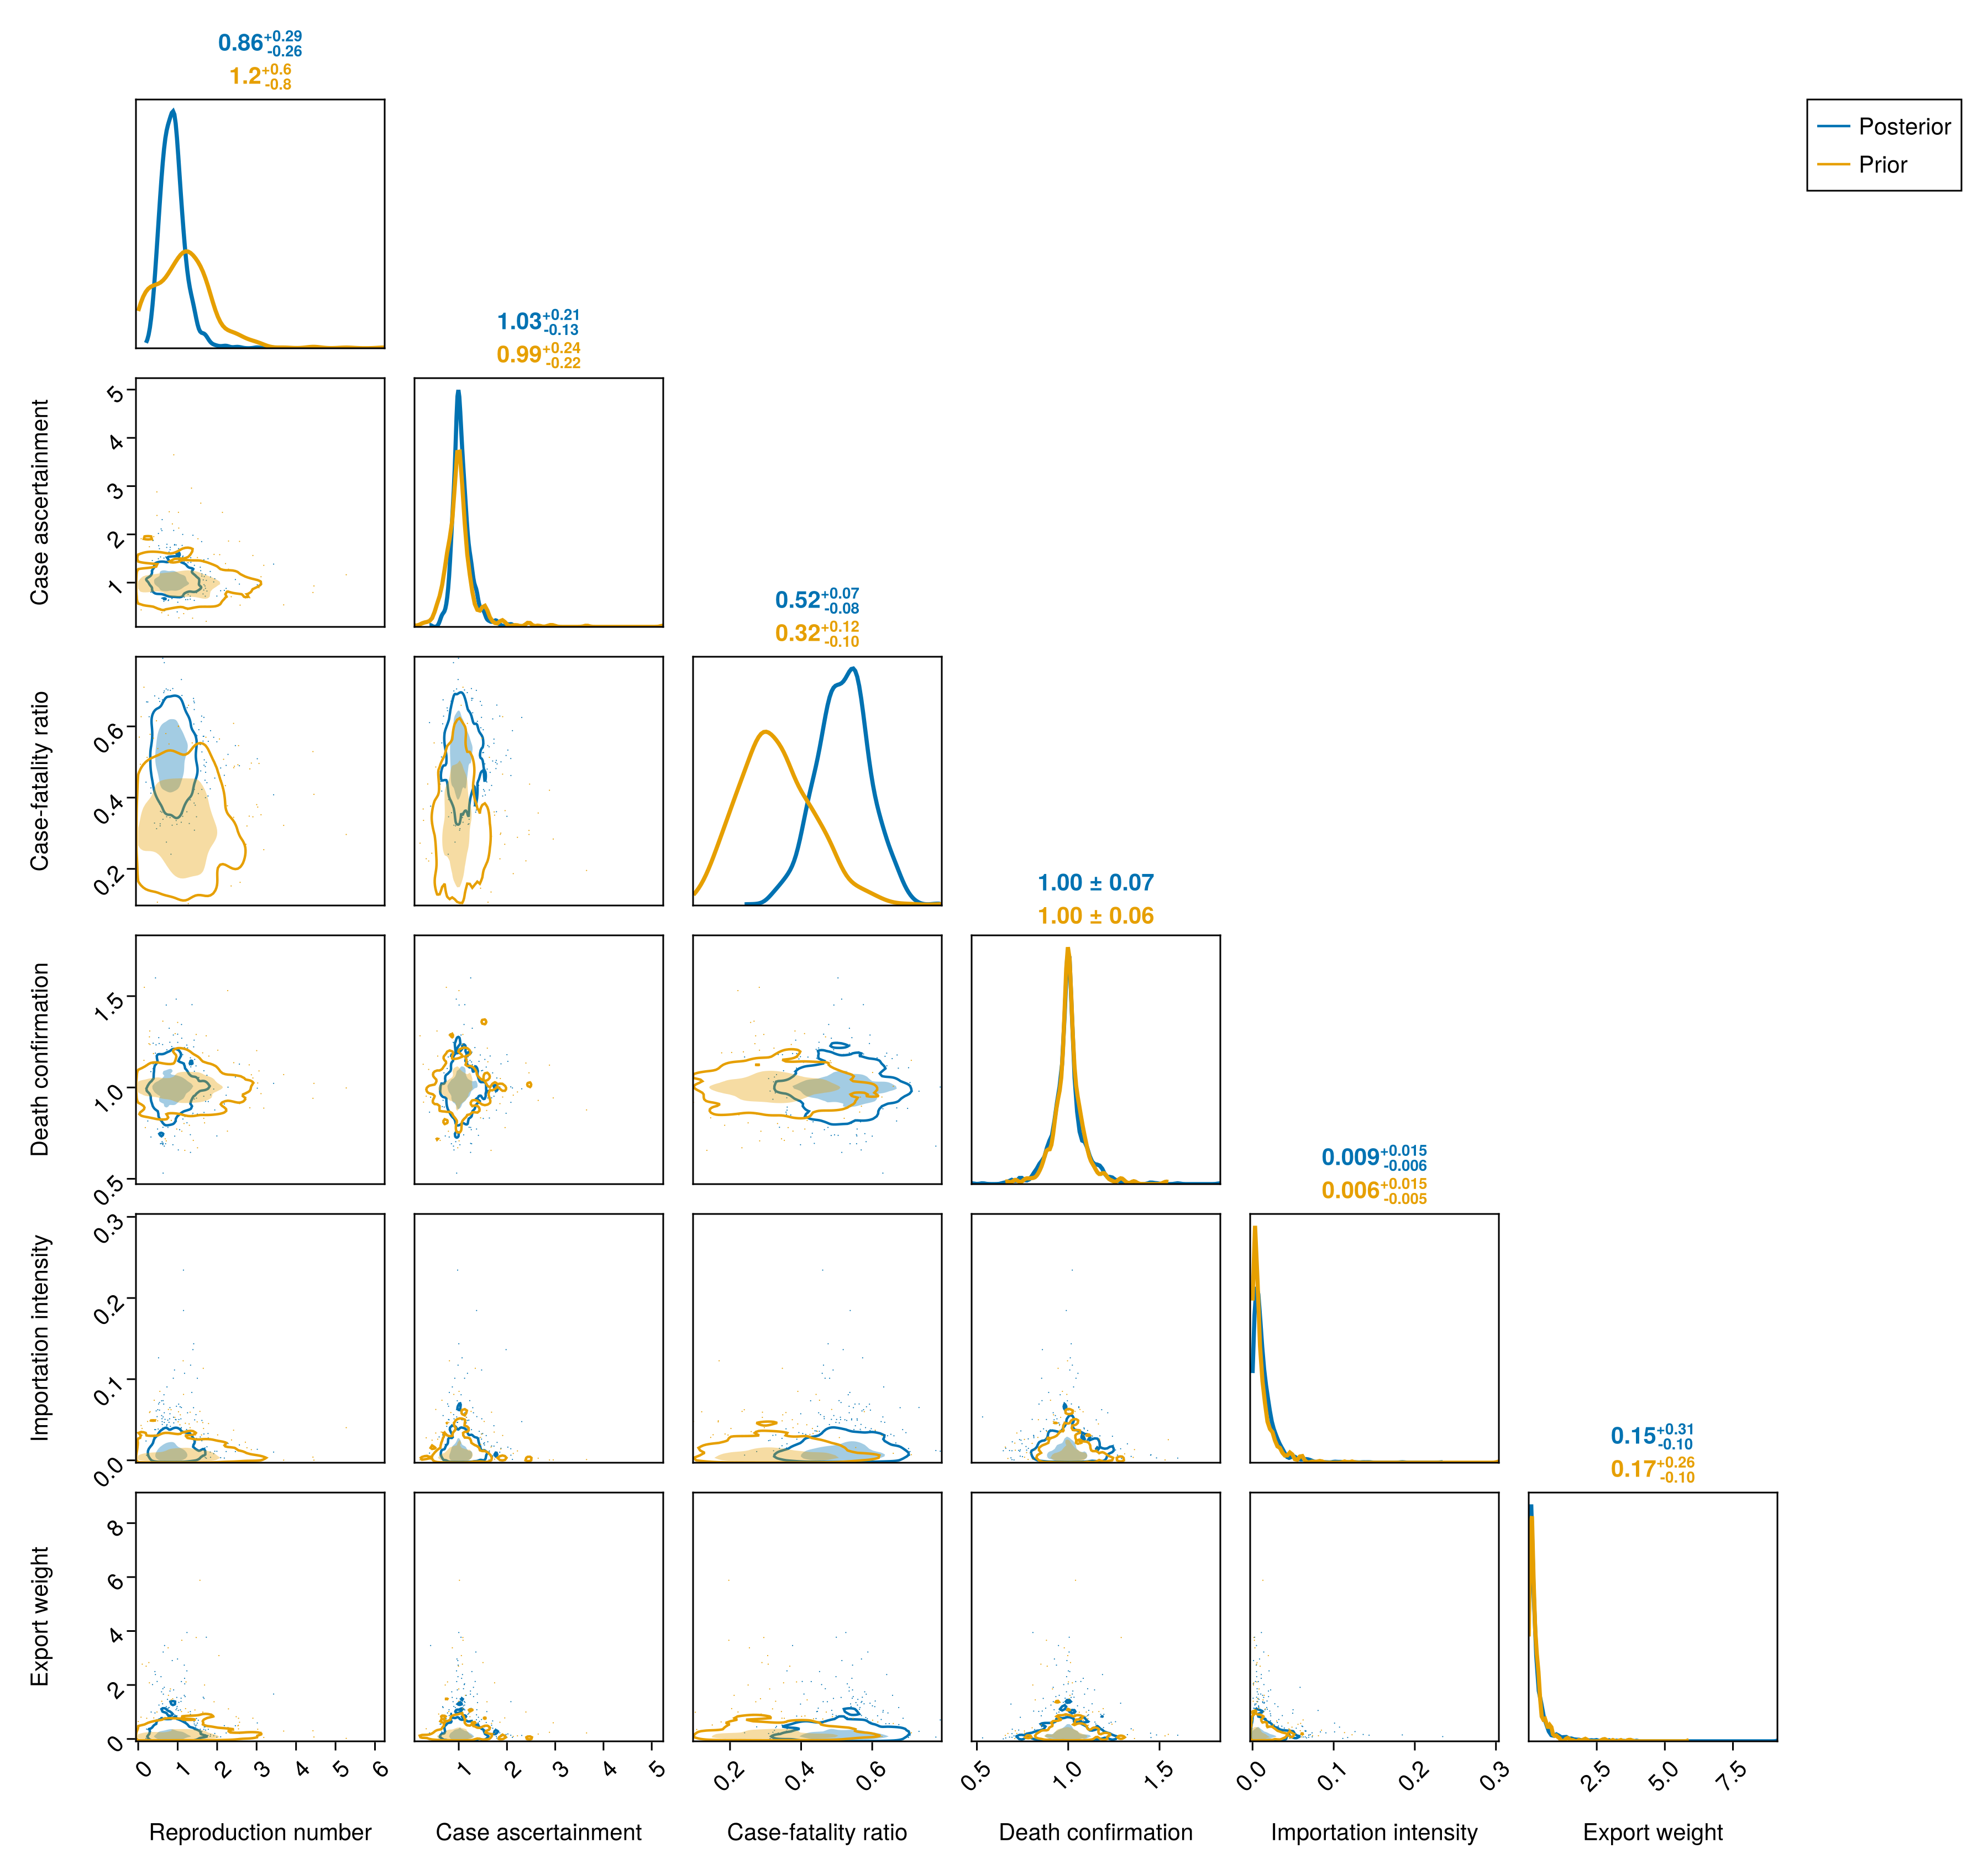
Sud-Ubangi pair plot (prior overlaid)
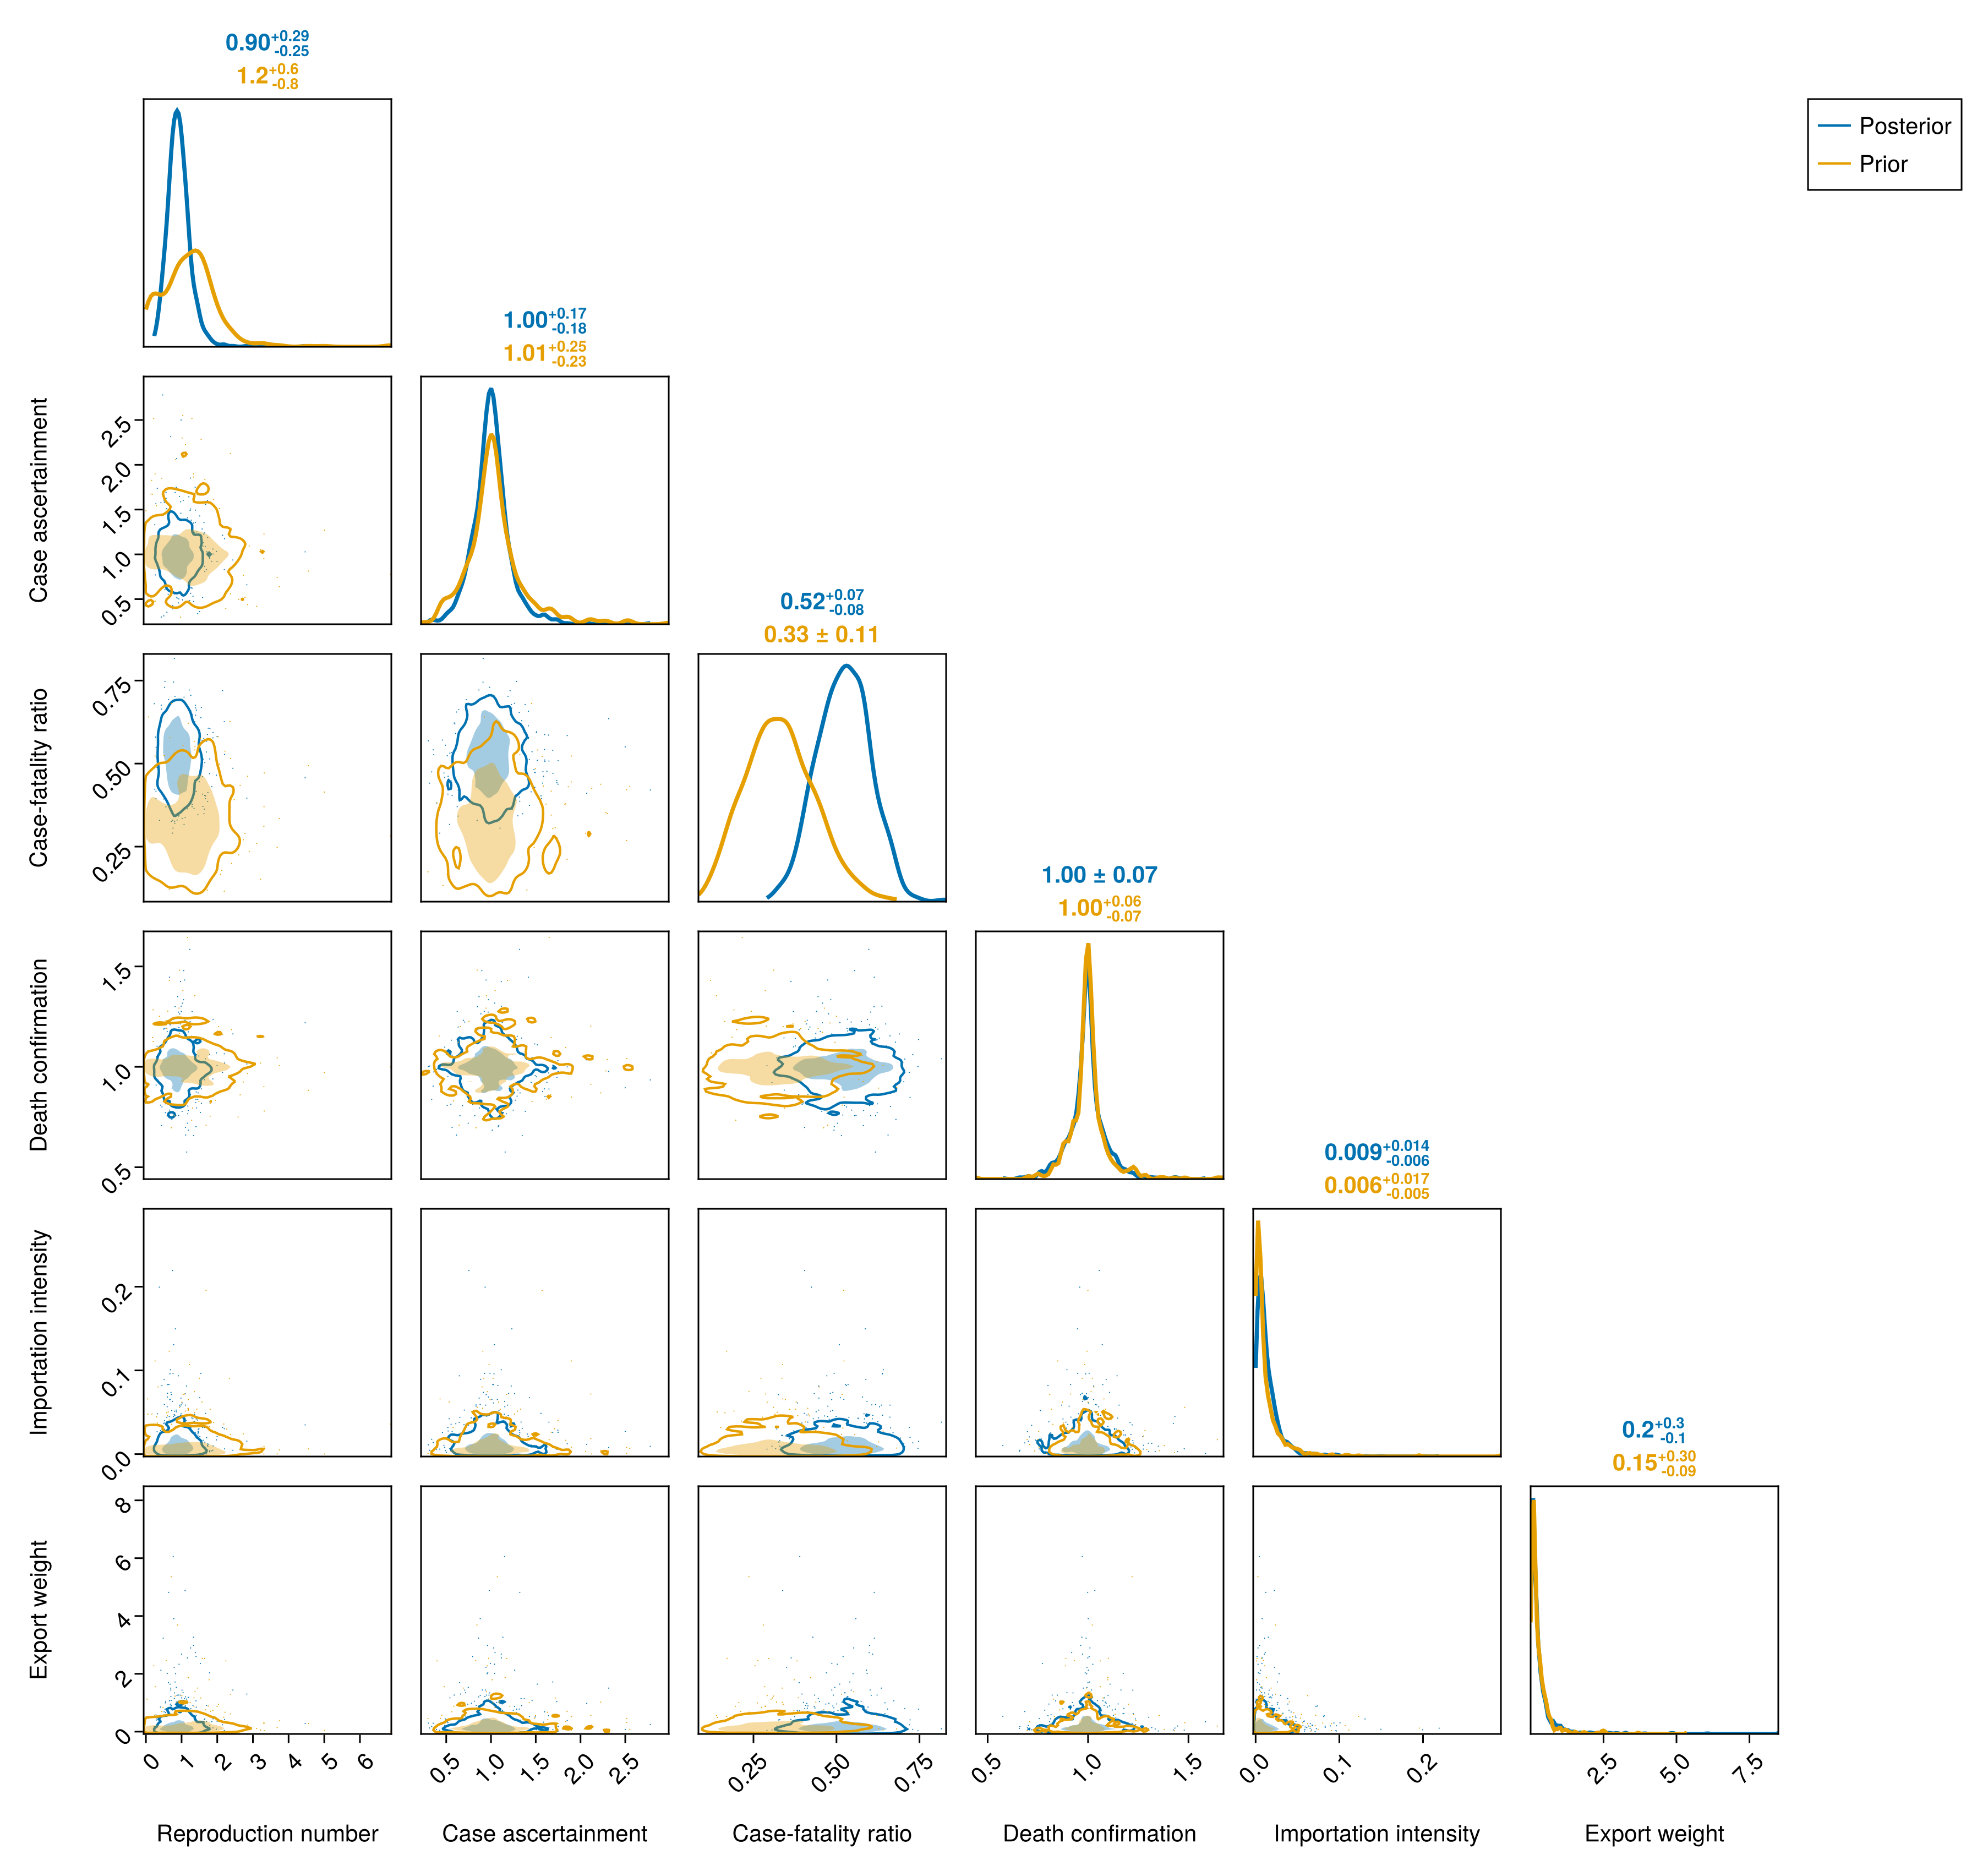
Nord-Ubangi pair plot (prior overlaid)
Composition checks
Whether the model reproduces each province's observed share of the national total is on the in-sample checks page.
Data currency
The province blocks are the provincial tables of the situation reports: confirmed cases, confirmed deaths and the 24-hour laboratory volumes. A block that stops updating shows its last date before the cut-off.
Province block currency
# Every province block whose last vintage falls before the cut-off, from
# the shared stream registry rather than a per-page list of dates. The
# grace the national table allows is not applied here: one vintage behind
# is already worth reading.
province_currency = let
    status = stream_report_status(obs; stratum = :province)
    behind = status[[ismissing(d) || d > 0 for d in status.days_since], :]
    isempty(behind) ?
        Markdown.parse(
            "Every province block reports to the cut-off, $(obs.cutoff)."
        ) :
        MarkdownTable(
            DataFrame(
                "Block" => behind.label,
                "Last reported" => [
                    ismissing(d) ? "never" : string(d)
                    for d in behind.last_date
                ],
                "Days before cut-off" => [
                    ismissing(d) ? "-" : string(d)
                    for d in behind.days_since
                ]
            )
        )
end;
Every province block reports to the cut-off, 2026-11-16.
Province fit diagnostics
The national fit diagnostics summarise the same joint fit as a whole, and its breakdown by parameter covers every parameter.
Province-level parameter diagnostics
# The quantities the sections above hold one per province: the
# reproduction number and infections to date from the renewal equation,
# the case-fatality ratio and the two ascertainment ratios the province
# compositions identify, and the importation intensity and export weight
# the per-province pair plots show.
province_diagnostic_quantities = [
    :R_T_patch, :C_T_patch, :CFR_patch, :province_ascertainment,
    :province_death_ascertainment, :importation_epsilon_patch, :export_weight,
]
province_diagnostics_labels = merge(
    province_pair_labels, Dict(:C_T_patch => "Infections to date")
)
province_diagnostics_frame = let df = parameter_diagnostics(chn_joint)
    df[in.(Symbol.(df.parameter), Ref(province_diagnostic_quantities)), :]
end
province_diagnostics_table = MarkdownTable(
    family_diagnostics_table(
        province_diagnostics_frame;
        n = length(province_diagnostic_quantities),
        labels = province_diagnostics_labels
    )
);| parameter | elements | max_rhat | min_ess_bulk | above_1.1 |
|---|---|---|---|---|
| Importation intensity | 8 | 1.019 | 161 | 0 |
| Reproduction number | 8 | 1.013 | 321 | 0 |
| Infections to date | 8 | 1.004 | 602 | 0 |
| Case-fatality ratio | 8 | 1.009 | 670 | 0 |
| Death confirmation | 8 | 1.004 | 828 | 0 |
| Case ascertainment | 8 | 1.002 | 942 | 0 |
| Export weight | 7 | 1.002 | 1897 | 0 |
Saving province assets
The summary dashboard shows the province summary table, the province map, the reproduction number by province and the weekly cases against the reproduction number, so they are written here.
Write the province dashboard assets
dashboard_dir = joinpath(
    pkgdir(BVDOutbreakSize), "docs", "src", "summary_assets"
)
mkpath(dashboard_dir)
CairoMakie.save(joinpath(dashboard_dir, "rt_provinces.png"), province_rt_fig)
# The summary's cases against R figure is drawn at the page width with
# larger labels.
CairoMakie.save(
    joinpath(dashboard_dir, "cases_rt_provinces.png"),
    plot_cases_rt(province_cases_rt; size = (680, 560), fontsize = 13)
)
# The summary's province map: infections to date alone.
CairoMakie.save(
    joinpath(dashboard_dir, "province_map.png"),
    plot_province_map(
        [province_infections_panel]; ncols = 1, panel_size = (680, 500)
    )
)
# The summary's compact province table: infections to date, R at the
# cut-off and the confirmed cases over the latest week of reports, the
# same week the cases against R figure ends on.
province_recent_cases = let last_day = min(last(province_cases.days), obs.n)
    weekly_count_table(
        province_cases.days, province_cases.increments[1:N_PATCHES, :],
        PROVINCE_LABELS[1:N_PATCHES];
        cutoff = obs.cutoff - Day(obs.n - last_day), n = last_day, weeks = 1
    ).count
end
open(joinpath(dashboard_dir, "provinces_summary.md"), "w") do io
    print(
        io,
        province_summary_table(
            chn_joint, N_PATCHES; recent_cases = province_recent_cases
        )
    )
end
The full analysis code, data and model definitions are in the epiforecasts/BVDOutbreakSize repository.