Health-zone estimates
This page splits each patch of the joint fit across its health zones, giving each zone's reproduction number, share of the patch and one-week forecast. The health-zone model on the methods page gives the maths, and the interactive map is on the dashboard. The one-week zone forecast is on the health-zone forecasts page and its scores in the health-zone forecast evaluation.
Load packages, data and fitted chains
# Shared setup: packages, observations and the fit registry. See
# `docs/pages/_setup.jl`.
using BVDOutbreakSize
include(joinpath(pkgdir(BVDOutbreakSize), "docs", "pages", "_setup.jl"))
validation_forecast_from (generic function with 1 method)# The fits this page reads, loaded from the cache here: the headline joint,
# the zone fit melded from it, and the frozen zone fit the sampler
# diagnostics read.
chn_joint = load_fit("joint");
chn_local = load_fit("local");
frozen_local = load_fit("local_frozen_validation");
# The zone stage's fixed inputs with the joint's forecast, from the shared
# setup, so the health-zone forecast page draws the same forecast from the
# same inputs.
zone_inputs = zone_stage_inputs(; forecast = true);
zone_patch = zone_inputs.patch_of_zone;Last updated: 18 November 2026.
Data as of: 16 November 2026.
Estimates by zone
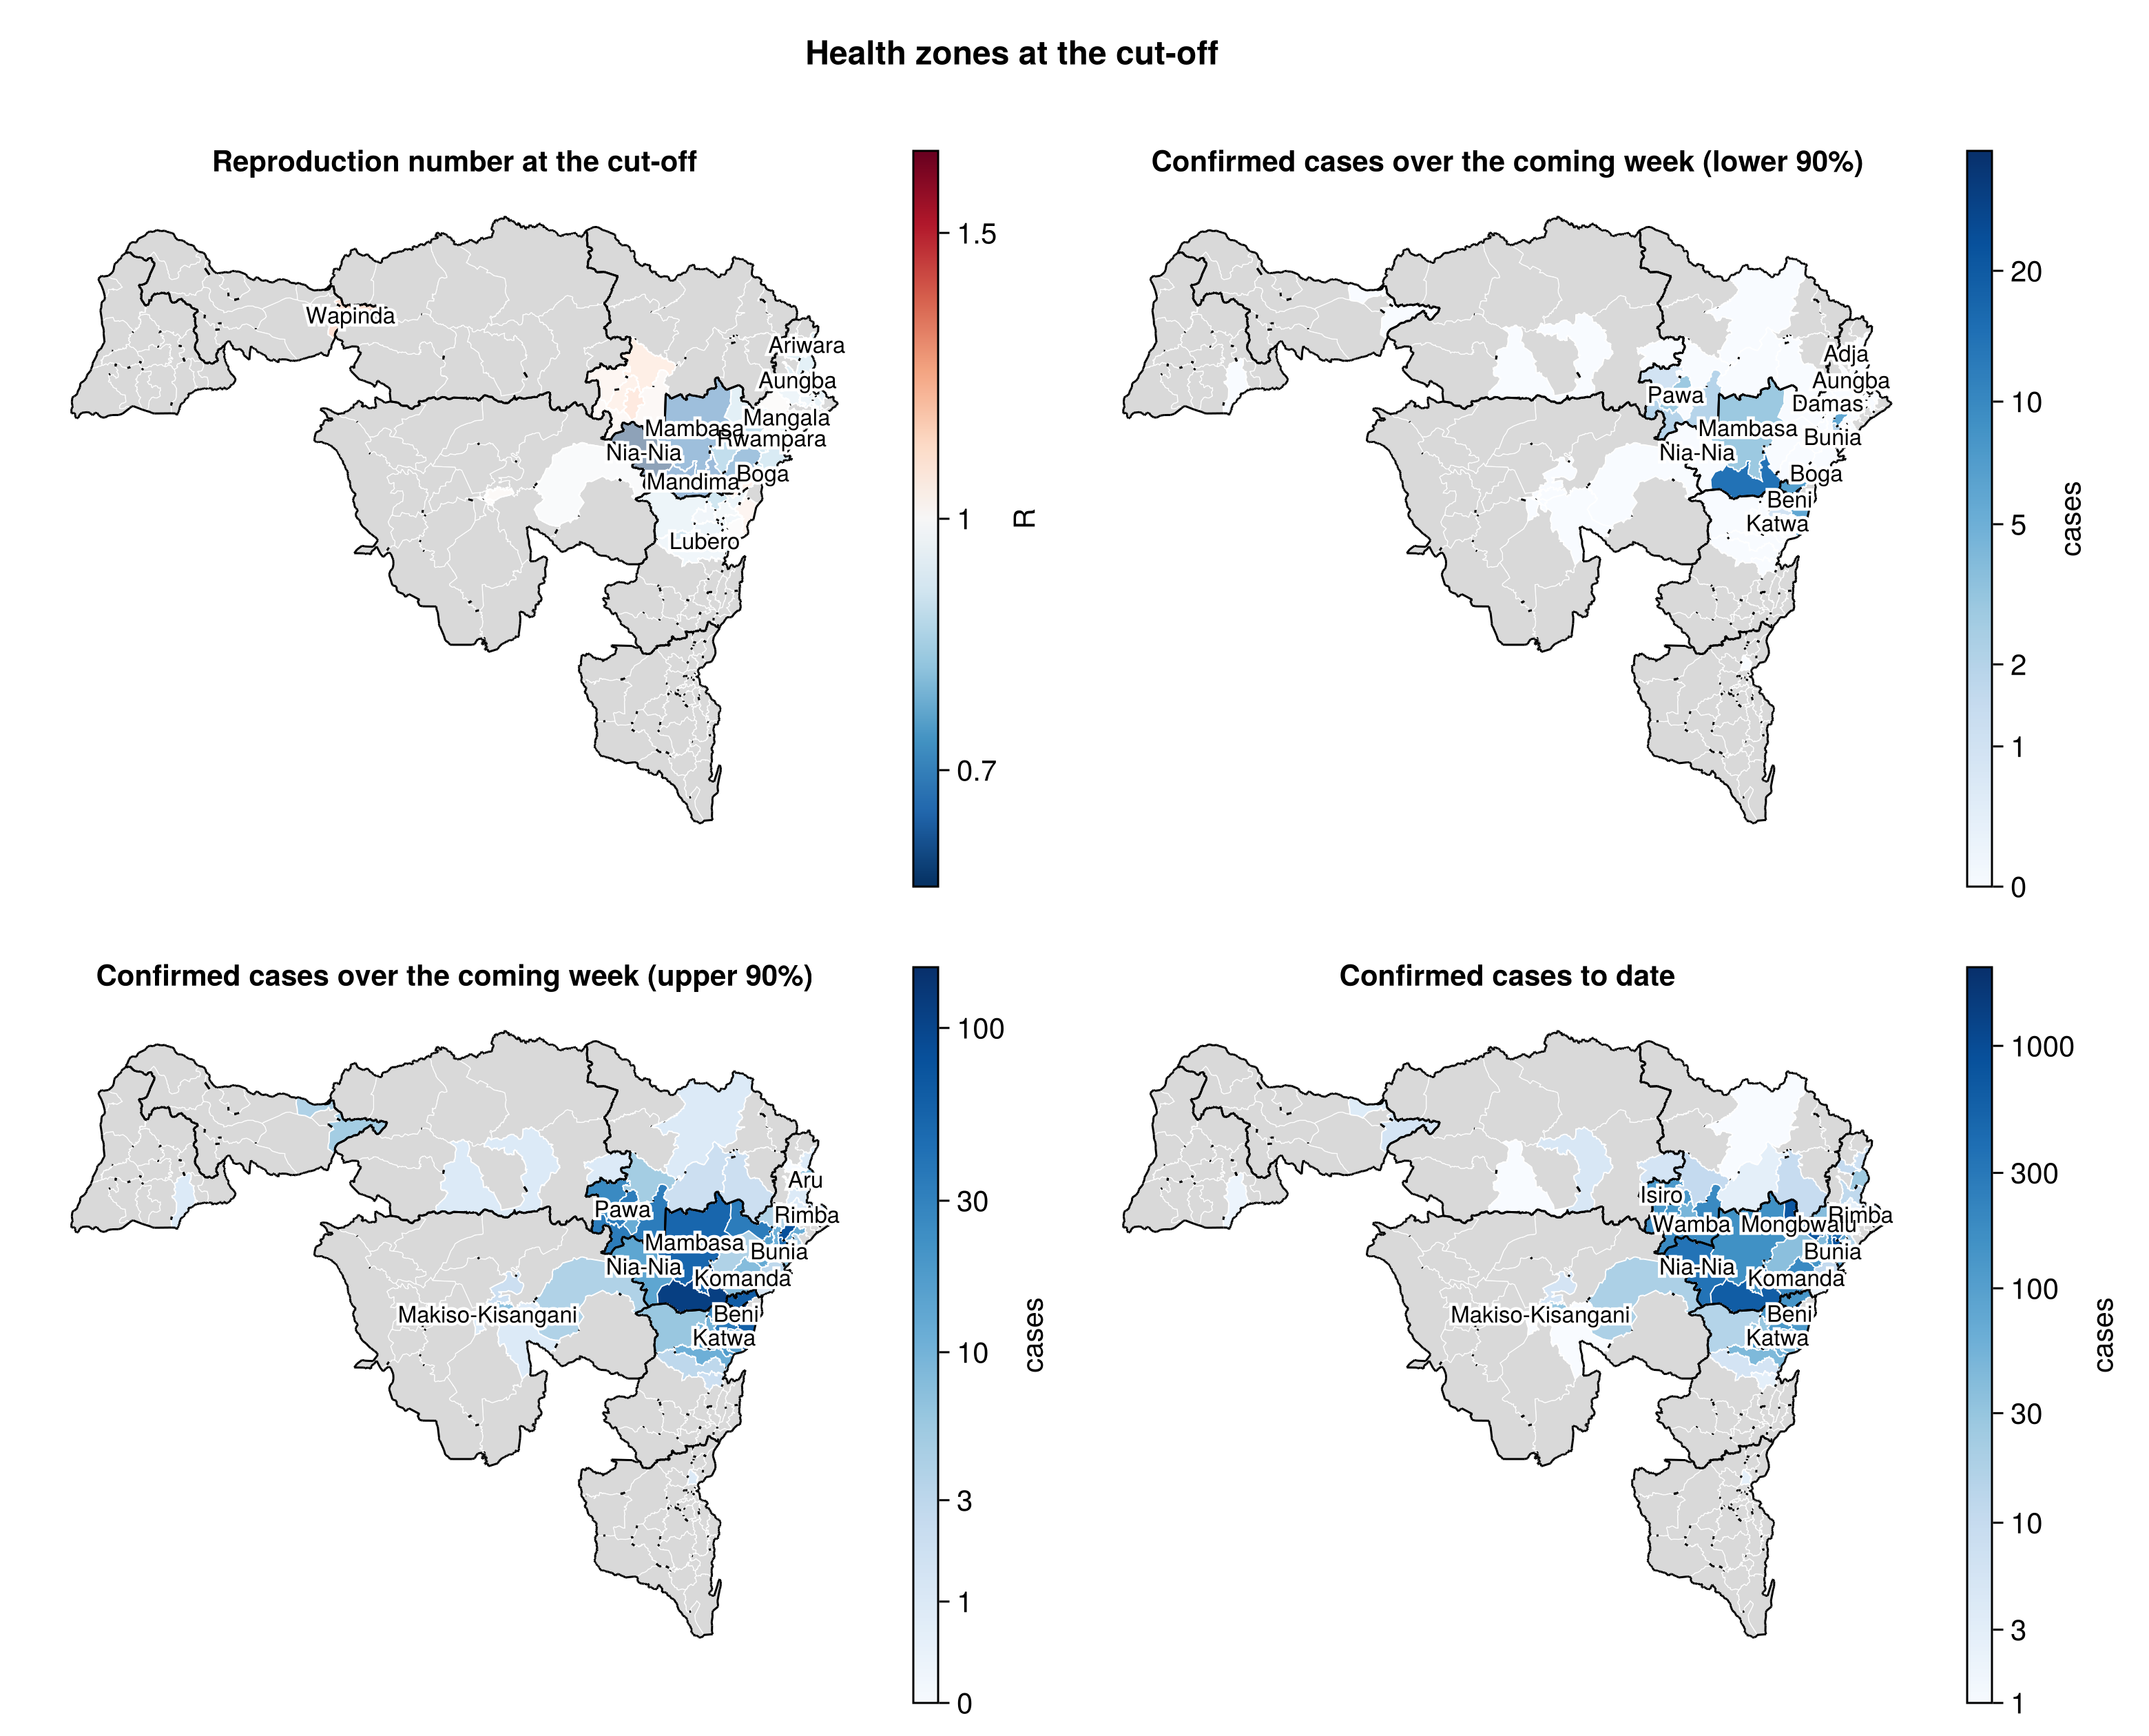
The interactive map on the dashboard adds the probability of at least
Health-zone post-processing
# The geojson keys a zone without the province prefix the manifest carries.
zone_map_keys = [
    String(last(split(k, "."; limit = 2)))
        for k in zone_inputs.zone_keys
];
# Daily zone reproduction numbers over the zone grid, each zone draw on
# its own draw of the patch trajectory so the patch uncertainty is
# carried, and the cut-off values the map and table read. A zone's
# reproduction number is reported from the day its cumulative infections
# reach the floor in the median draw.
zone_rt_traj = reconstruct_zone_rt(chn_local, zone_inputs);
zone_RT_finite = [filter(isfinite, m[:, obs.n]) for m in zone_rt_traj];
zone_RT_reported = findall(!isempty, zone_RT_finite);
zone_share_T = let vs = vec(collect(chn_local[:share_T_zone]))
    [Float64[v[z] for v in vs] for z in eachindex(zone_map_keys)]
end;
_zq(v, p) = quantile(v, p)
# The one-week zone forecast drawn from the zone model, and the
# probability of at least K cases per zone from the same draws.
zone_fc = zone_forecast(chn_local, zone_inputs);
zone_fc_draws = zone_forecast_draws(zone_fc, zone_inputs);
ZONE_THRESHOLDS = (1, 5, 10, 20)
zone_fc_probs = zone_forecast_probabilities(
    zone_fc, zone_inputs; thresholds = ZONE_THRESHOLDS, draws = zone_fc_draws
);
zone_overview = zone_overview_table(chn_local, zone_inputs);
# Cases allocated to each zone over the past one, two and four weeks,
# and the last vintage on which each zone's count rose.
zone_recent = Dict(
    w => zone_recent_cases(zone_inputs; window = w) for w in (7, 14, 28)
);
zone_last_case = zone_last_case_dates(zone_inputs);

zone_map_fig = plot_zone_map_panels(
    [
        (;
            values = [median(zone_RT_finite[z]) for z in zone_RT_reported],
            zones = zone_map_keys[zone_RT_reported],
            lower = [_zq(zone_RT_finite[z], 0.05) for z in zone_RT_reported],
            upper = [_zq(zone_RT_finite[z], 0.95) for z in zone_RT_reported],
            diverging_at = 1.0, scale = log10,
            title = "Reproduction number at the cut-off",
            colorbar_label = "R",
        ),
        (;
            values = [_zq(v, 0.05) for v in zone_fc_draws.zones],
            zones = zone_map_keys, scale = CairoMakie.Makie.pseudolog10,
            title = "Confirmed cases over the coming week (lower 90%)",
            colorbar_label = "cases",
        ),
        (;
            values = [_zq(v, 0.95) for v in zone_fc_draws.zones],
            zones = zone_map_keys, scale = CairoMakie.Makie.pseudolog10,
            title = "Confirmed cases over the coming week (upper 90%)",
            colorbar_label = "cases",
        ),
        (;
            values = Float64.(zone_inputs.cumulative), zones = zone_map_keys,
            scale = CairoMakie.Makie.pseudolog10,
            title = "Confirmed cases to date", colorbar_label = "cases",
        ),
    ];
    ncols = 2, title = "Health zones at the cut-off"
);
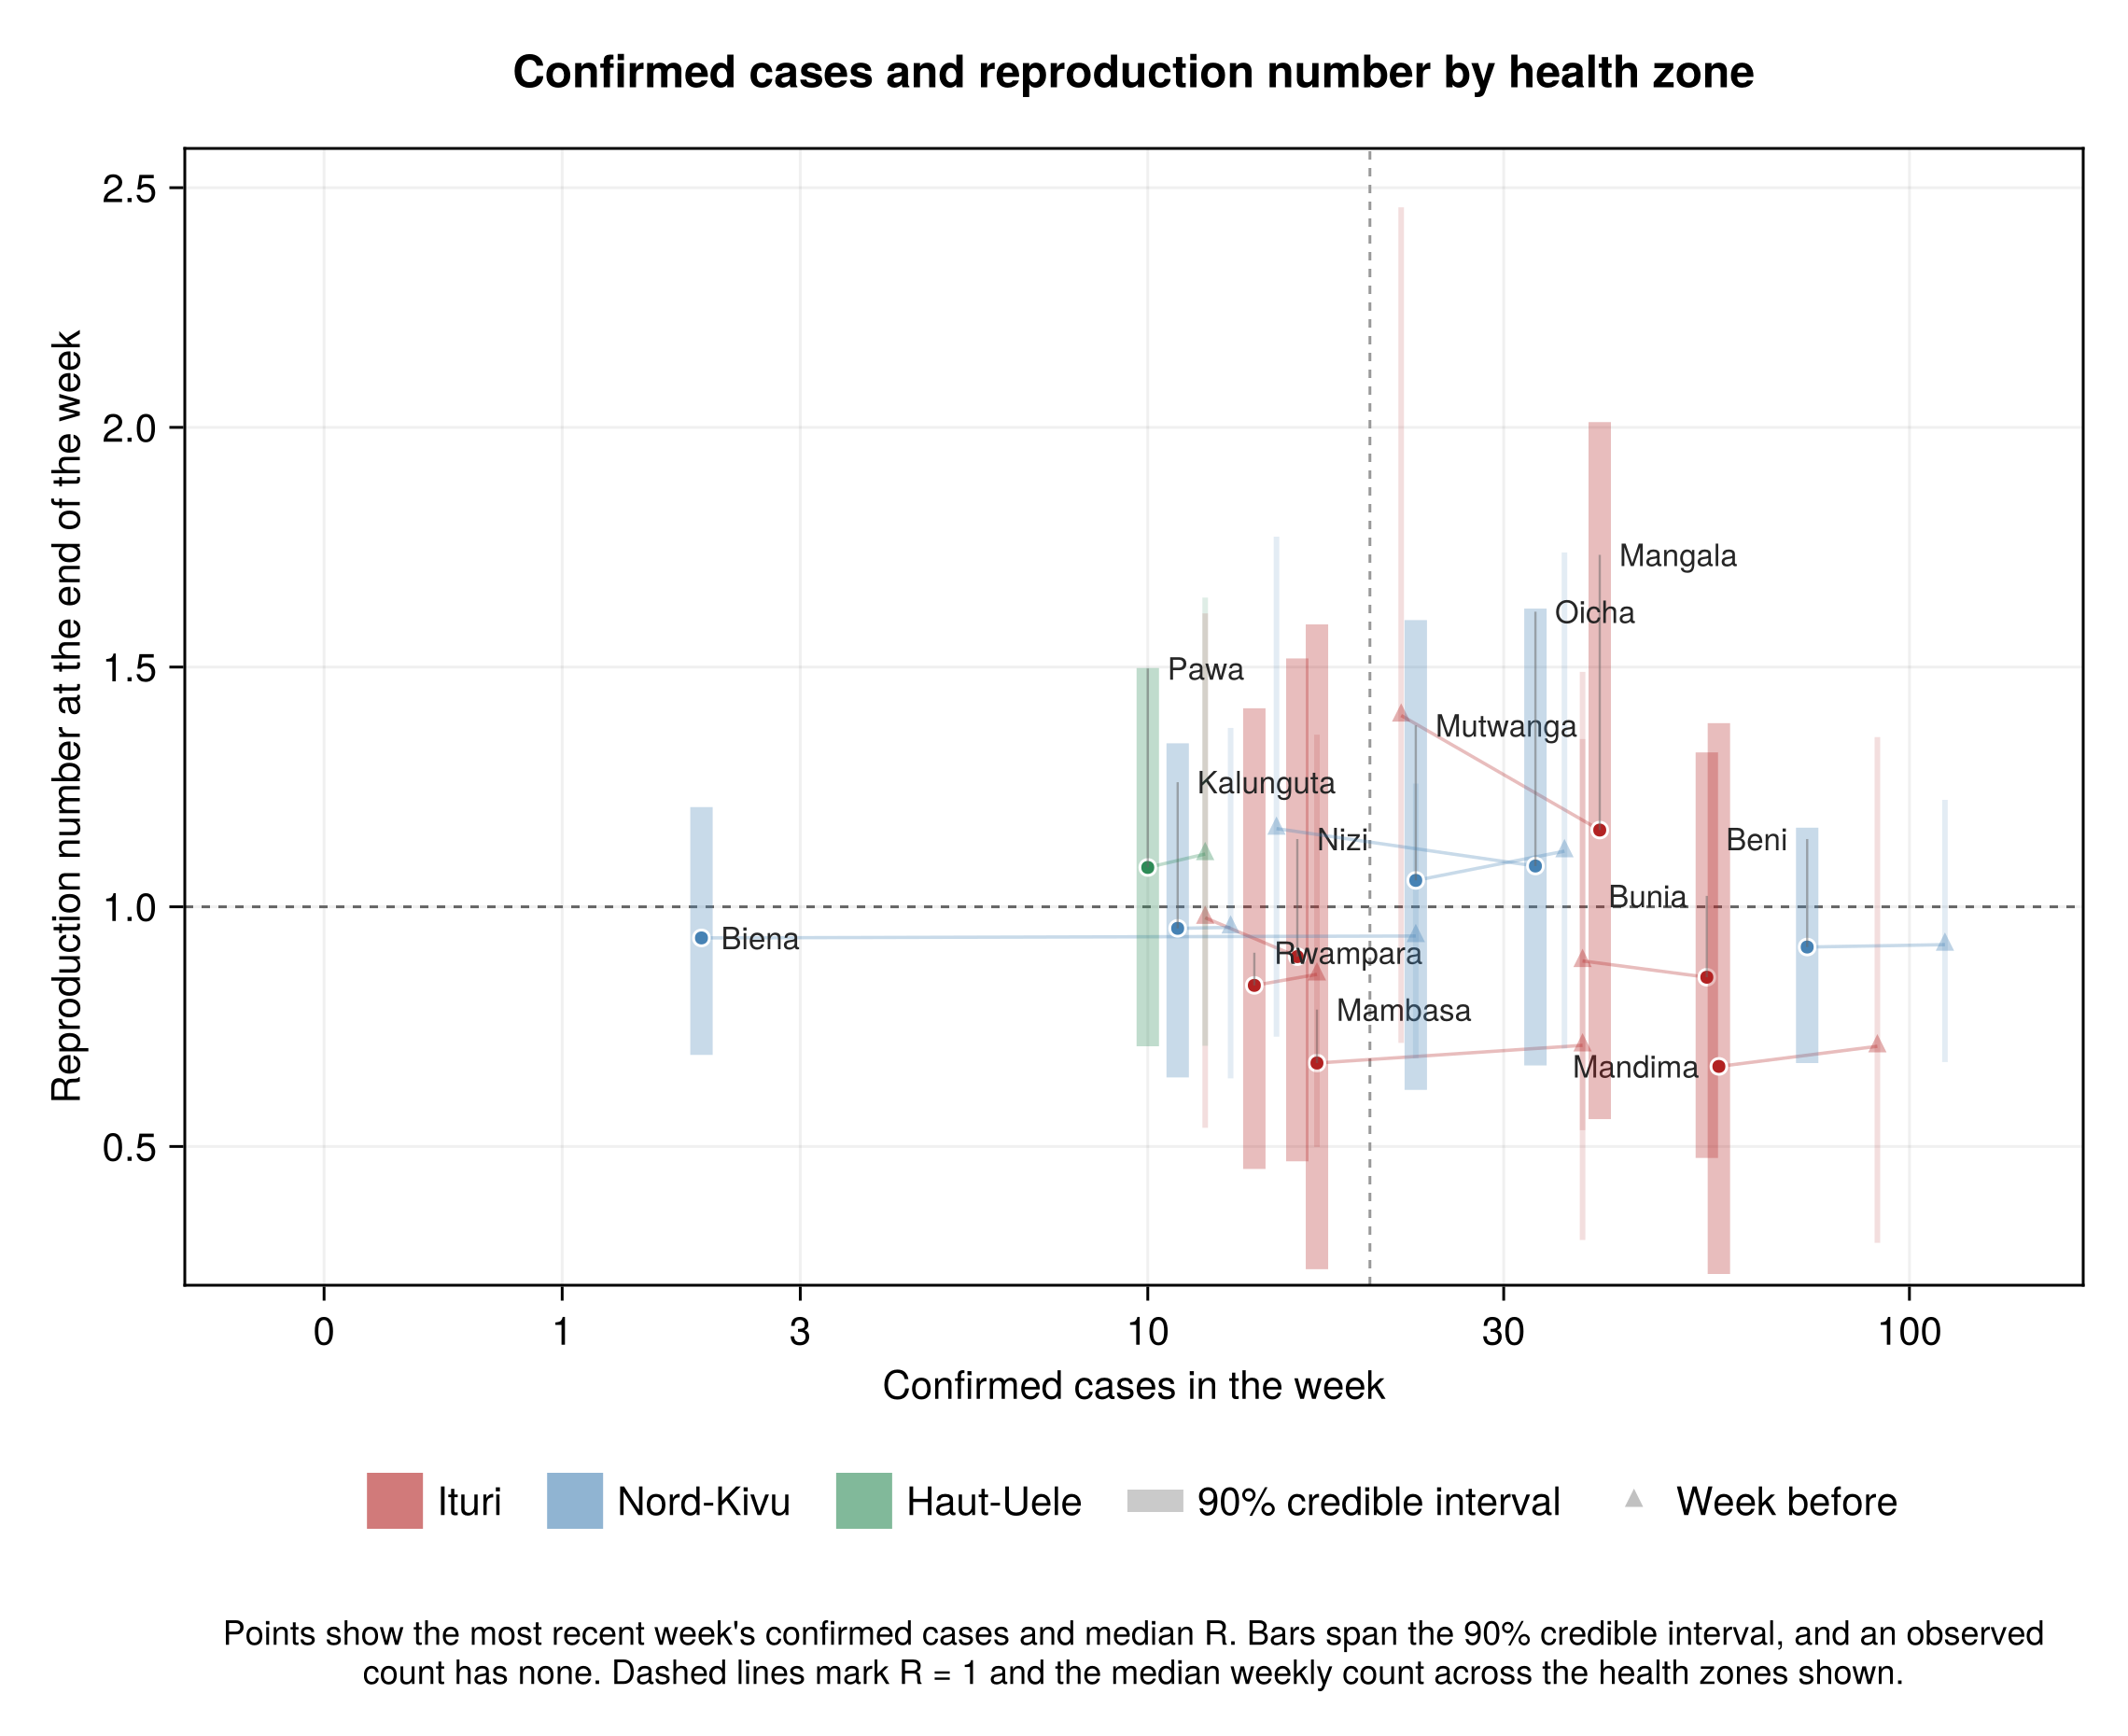
Compute the weekly cases and reproduction number by zone
zone_cases_rt = cases_rt_table(
    zone_rt_traj, zone_inputs.days, zone_inputs.counts;
    cutoff = obs.cutoff, n = obs.n, areas = zone_inputs.zone_labels,
    patch = zone_patch
);
zone_cases_rt_fig = plot_cases_rt(
    zone_cases_rt; patch_labels = zone_inputs.patch_labels, top = 12,
    unit = "health zone"
);
Zone overview table
# The overview as displayed: the interval strings, without the numeric
# columns.
zone_overview_display = let d = zone_overview[
        :,
        [:zone, :patch, :cases, :share, :R_T, :p_R_above_1, :delta_T],
    ]
    d[!, "R modelled separately"] = [
        w ? "yes" : "no" for w in zone_overview.walking
    ]
    d
end;| zone | patch | cases | share | R_T | p_R_above_1 | delta_T | R modelled separately |
|---|---|---|---|---|---|---|---|
| Boma Mangbetu | Haut-Uele | 51 | 8.7 (3.6–20.5) | 1.13 (0.73–1.7) | 0.69 | -0.02 (-0.44–0.41) | yes |
| Mangala | Ituri | 460 | 14.0 (4.0–40.8) | 1.16 (0.56–2.01) | 0.65 | 0.5 (-0.18–1.22) | yes |
| Fataki | Ituri | 87 | 0.7 (0.2–3.3) | 1.15 (0.55–2.13) | 0.63 | 0.25 (-0.61–1.06) | yes |
| Pawa | Haut-Uele | 138 | 33.8 (17.1–56.0) | 1.08 (0.71–1.5) | 0.63 | 0.04 (-0.35–0.45) | yes |
| Oicha | Nord-Kivu | 141 | 13.0 (5.9–27.7) | 1.09 (0.67–1.62) | 0.61 | 0.24 (-0.29–0.79) | yes |
| Mutwanga | Nord-Kivu | 125 | 9.9 (4.0–22.5) | 1.06 (0.62–1.6) | 0.58 | 0.23 (-0.23–0.72) | yes |
| Isiro | Haut-Uele | 128 | 21.4 (7.5–46.7) | 1.05 (0.56–1.62) | 0.56 | 0.02 (-0.58–0.57) | yes |
| Wamba | Haut-Uele | 190 | 26.1 (10.6–49.5) | 1.03 (0.59–1.54) | 0.54 | -0.03 (-0.44–0.41) | yes |
| Damas | Ituri | 41 | 0.2 (0.0–0.9) | 1.0 (0.54–1.84) | 0.5 | 0.0 (-0.96–0.87) | yes |
| Kyondo | Nord-Kivu | 50 | 1.3 (0.5–3.4) | 1.0 (0.64–1.56) | 0.5 | 0.01 (-0.45–0.46) | yes |
| Masereka | Nord-Kivu | 57 | 1.6 (0.6–5.0) | 1.0 (0.57–1.7) | 0.5 | 0.07 (-0.38–0.53) | yes |
| Kilo | Ituri | 44 | 1.1 (0.3–5.0) | 0.99 (0.51–1.91) | 0.48 | 0.3 (-0.43–1.03) | yes |
| Bambu | Ituri | 220 | 0.8 (0.2–2.3) | 0.95 (0.53–1.57) | 0.43 | 0.01 (-0.68–0.7) | yes |
| Kalunguta | Nord-Kivu | 123 | 5.9 (3.1–11.0) | 0.95 (0.64–1.34) | 0.42 | 0.01 (-0.38–0.36) | yes |
| Mongbwalu | Ituri | 740 | 4.0 (0.9–19.2) | 0.88 (0.35–2.04) | 0.4 | 0.22 (-0.65–1.12) | yes |
| Vuhovi | Nord-Kivu | 66 | 1.9 (0.8–4.0) | 0.94 (0.62–1.36) | 0.4 | -0.0 (-0.35–0.34) | yes |
| Nizi | Ituri | 883 | 6.0 (2.2–15.2) | 0.9 (0.47–1.52) | 0.37 | 0.19 (-0.47–0.83) | yes |
| Musienene | Nord-Kivu | 169 | 2.0 (0.8–5.1) | 0.91 (0.54–1.45) | 0.37 | -0.1 (-0.56–0.34) | yes |
| Tchomia | Ituri | 86 | 0.3 (0.1–1.0) | 0.88 (0.49–1.48) | 0.34 | -0.16 (-0.98–0.66) | yes |
| Lita | Ituri | 352 | 3.8 (1.2–11.4) | 0.85 (0.42–1.51) | 0.33 | 0.09 (-0.63–0.79) | yes |
| Butembo | Nord-Kivu | 356 | 3.9 (1.9–7.8) | 0.89 (0.57–1.33) | 0.32 | -0.15 (-0.5–0.19) | yes |
| Nyankunde | Ituri | 143 | 0.9 (0.3–3.1) | 0.84 (0.47–1.49) | 0.31 | -0.11 (-0.95–0.65) | yes |
| Katwa | Nord-Kivu | 698 | 5.7 (2.8–11.4) | 0.88 (0.57–1.31) | 0.31 | -0.14 (-0.49–0.18) | yes |
| Bunia | Ituri | 2105 | 18.8 (7.8–36.5) | 0.85 (0.48–1.32) | 0.3 | 0.06 (-0.6–0.71) | yes |
| Beni | Nord-Kivu | 905 | 42.8 (28.3–58.7) | 0.92 (0.67–1.16) | 0.3 | 0.03 (-0.43–0.48) | yes |
| Lubero | Nord-Kivu | 46 | 0.8 (0.2–2.6) | 0.83 (0.43–1.48) | 0.3 | -0.06 (-0.61–0.44) | yes |
| Lolwa | Ituri | 37 | 0.2 (0.0–0.8) | 0.78 (0.35–1.57) | 0.28 | -0.32 (-1.37–0.6) | yes |
| Rwampara | Ituri | 1235 | 6.8 (2.6–16.2) | 0.84 (0.45–1.41) | 0.28 | -0.03 (-0.72–0.65) | yes |
| Mabalako | Nord-Kivu | 134 | 3.1 (1.3–6.9) | 0.82 (0.51–1.28) | 0.25 | -0.09 (-0.61–0.35) | yes |
| Mambasa | Ituri | 160 | 6.3 (1.6–22.9) | 0.67 (0.24–1.59) | 0.24 | -0.06 (-1.03–0.92) | yes |
| Mandima | Ituri | 639 | 14.8 (3.7–44.5) | 0.67 (0.23–1.38) | 0.22 | 0.0 (-0.94–0.97) | yes |
| Komanda | Ituri | 195 | 0.5 (0.1–1.8) | 0.69 (0.3–1.35) | 0.2 | -0.53 (-1.58–0.46) | yes |
| Nia-Nia | Ituri | 346 | 0.9 (0.2–4.5) | 0.59 (0.21–1.46) | 0.17 | -0.32 (-1.4–0.72) | yes |
| Wapinda | Nord-Ubangi | 6 | 53.8 (40.2–74.3) | 1.18 (0.87–1.5) | 0.82 | 0.0 (-0.0–0.0) | no |
| Rungu | Haut-Uele | 11 | 2.5 (1.3–4.3) | 1.11 (0.82–1.4) | 0.72 | -0.0 (-0.01–0.0) | no |
| Kabondo | Tshopo | 29 | 23.6 (16.3–32.1) | 1.02 (0.8–1.26) | 0.55 | -0.0 (-0.0–0.0) | no |
| Mangobo | Tshopo | 11 | 16.2 (10.0–23.7) | 1.02 (0.8–1.26) | 0.55 | 0.0 (-0.0–0.0) | no |
| Makiso-Kisangani | Tshopo | 41 | 41.7 (33.2–50.1) | 1.01 (0.79–1.25) | 0.53 | 0.0 (-0.0–0.0) | no |
| Bafwasende | Tshopo | 19 | 9.8 (5.5–15.8) | 0.98 (0.78–1.2) | 0.45 | -0.0 (-0.0–0.0) | no |
| Alimbongo | Nord-Kivu | 6 | 0.2 (0.1–0.4) | 0.93 (0.68–1.22) | 0.35 | -0.0 (-0.01–0.0) | no |
| Drodro | Ituri | 16 | 0.2 (0.1–0.5) | 0.93 (0.69–1.2) | 0.34 | 0.0 (-0.0–0.0) | no |
| Biena | Nord-Kivu | 29 | 1.0 (0.6–1.7) | 0.94 (0.69–1.21) | 0.34 | -0.0 (-0.0–0.0) | no |
| Kambala | Ituri | 3 | 0.1 (0.0–0.2) | 0.92 (0.67–1.17) | 0.3 | -0.0 (-0.01–0.0) | no |
| Rimba | Ituri | 29 | 0.4 (0.2–0.7) | 0.92 (0.68–1.17) | 0.3 | -0.0 (-0.01–-0.0) | no |
| Manguredjipa | Nord-Kivu | 16 | 0.4 (0.2–0.8) | 0.92 (0.68–1.18) | 0.3 | -0.0 (-0.0–0.0) | no |
| Logo | Ituri | 14 | 0.3 (0.1–0.6) | 0.9 (0.66–1.15) | 0.25 | -0.0 (-0.01–0.0) | no |
| Mahagi | Ituri | 6 | 0.1 (0.0–0.2) | 0.89 (0.65–1.15) | 0.24 | -0.0 (-0.01–0.0) | no |
| Aru | Ituri | 26 | 0.3 (0.2–0.7) | 0.88 (0.63–1.12) | 0.22 | -0.0 (-0.01–-0.0) | no |
| Adja | Ituri | 11 | 0.1 (0.0–0.1) | 0.88 (0.62–1.13) | 0.2 | -0.0 (-0.0–0.0) | no |
| Aungba | Ituri | 12 | 0.1 (0.0–0.2) | 0.87 (0.63–1.12) | 0.2 | -0.0 (-0.01–0.0) | no |
| Ariwara | Ituri | 8 | 0.1 (0.0–0.2) | 0.86 (0.61–1.11) | 0.17 | -0.0 (-0.0–0.0) | no |
| Gety | Ituri | 11 | 0.2 (0.1–0.4) | 0.85 (0.62–1.09) | 0.15 | 0.0 (-0.0–0.0) | no |
| Boga | Ituri | 2 | 0.1 (0.0–0.2) | 0.82 (0.59–1.08) | 0.12 | 0.0 (-0.0–0.0) | no |
| Goma | Nord-Kivu | 1 | 0.0 (0.0–0.1) | NaN | -0.0 (-0.01–0.0) | no | |
| Kayna | Nord-Kivu | 3 | 0.1 (0.0–0.2) | NaN | -0.0 (-0.01–0.0) | no | |
| Dungu | Haut-Uele | 1 | 0.3 (0.1–0.7) | NaN | -0.0 (-0.01–0.0) | no | |
| Gombari | Haut-Uele | 3 | 0.5 (0.2–1.1) | NaN | -0.0 (-0.01–0.0) | no | |
| Watsa | Haut-Uele | 10 | 0.7 (0.2–1.5) | NaN | -0.0 (-0.01–-0.0) | no | |
| Miti-Murhesa | Sud-Kivu | 3 | 100.0 (100.0–100.0) | NaN | 0.0 (0.0–0.0) | no | |
| Lubunga | Tshopo | 1 | 1.9 (0.6–4.8) | NaN | 0.0 (-0.0–0.0) | no | |
| Tshopo | Tshopo | 6 | 3.9 (1.9–7.3) | NaN | -0.0 (-0.01–0.0) | no | |
| Wanie-Rukula | Tshopo | 1 | 1.5 (0.5–3.7) | NaN | -0.0 (-0.0–0.0) | no | |
| Buta | Bas-Uele | 1 | 17.2 (5.7–33.8) | NaN | -0.0 (-0.0–0.0) | no | |
| Ganga | Bas-Uele | 5 | 42.4 (27.1–58.1) | NaN | 0.0 (-0.0–0.0) | no | |
| Viadana | Bas-Uele | 6 | 39.1 (22.4–58.5) | NaN | 0.0 (-0.0–0.0) | no | |
| Bulu | Sud-Ubangi | 2 | 100.0 (100.0–100.0) | NaN | 0.0 (0.0–0.0) | no | |
| Yakoma | Nord-Ubangi | 4 | 46.2 (25.7–59.8) | NaN | -0.0 (-0.0–0.0) | no |
Point prevalence
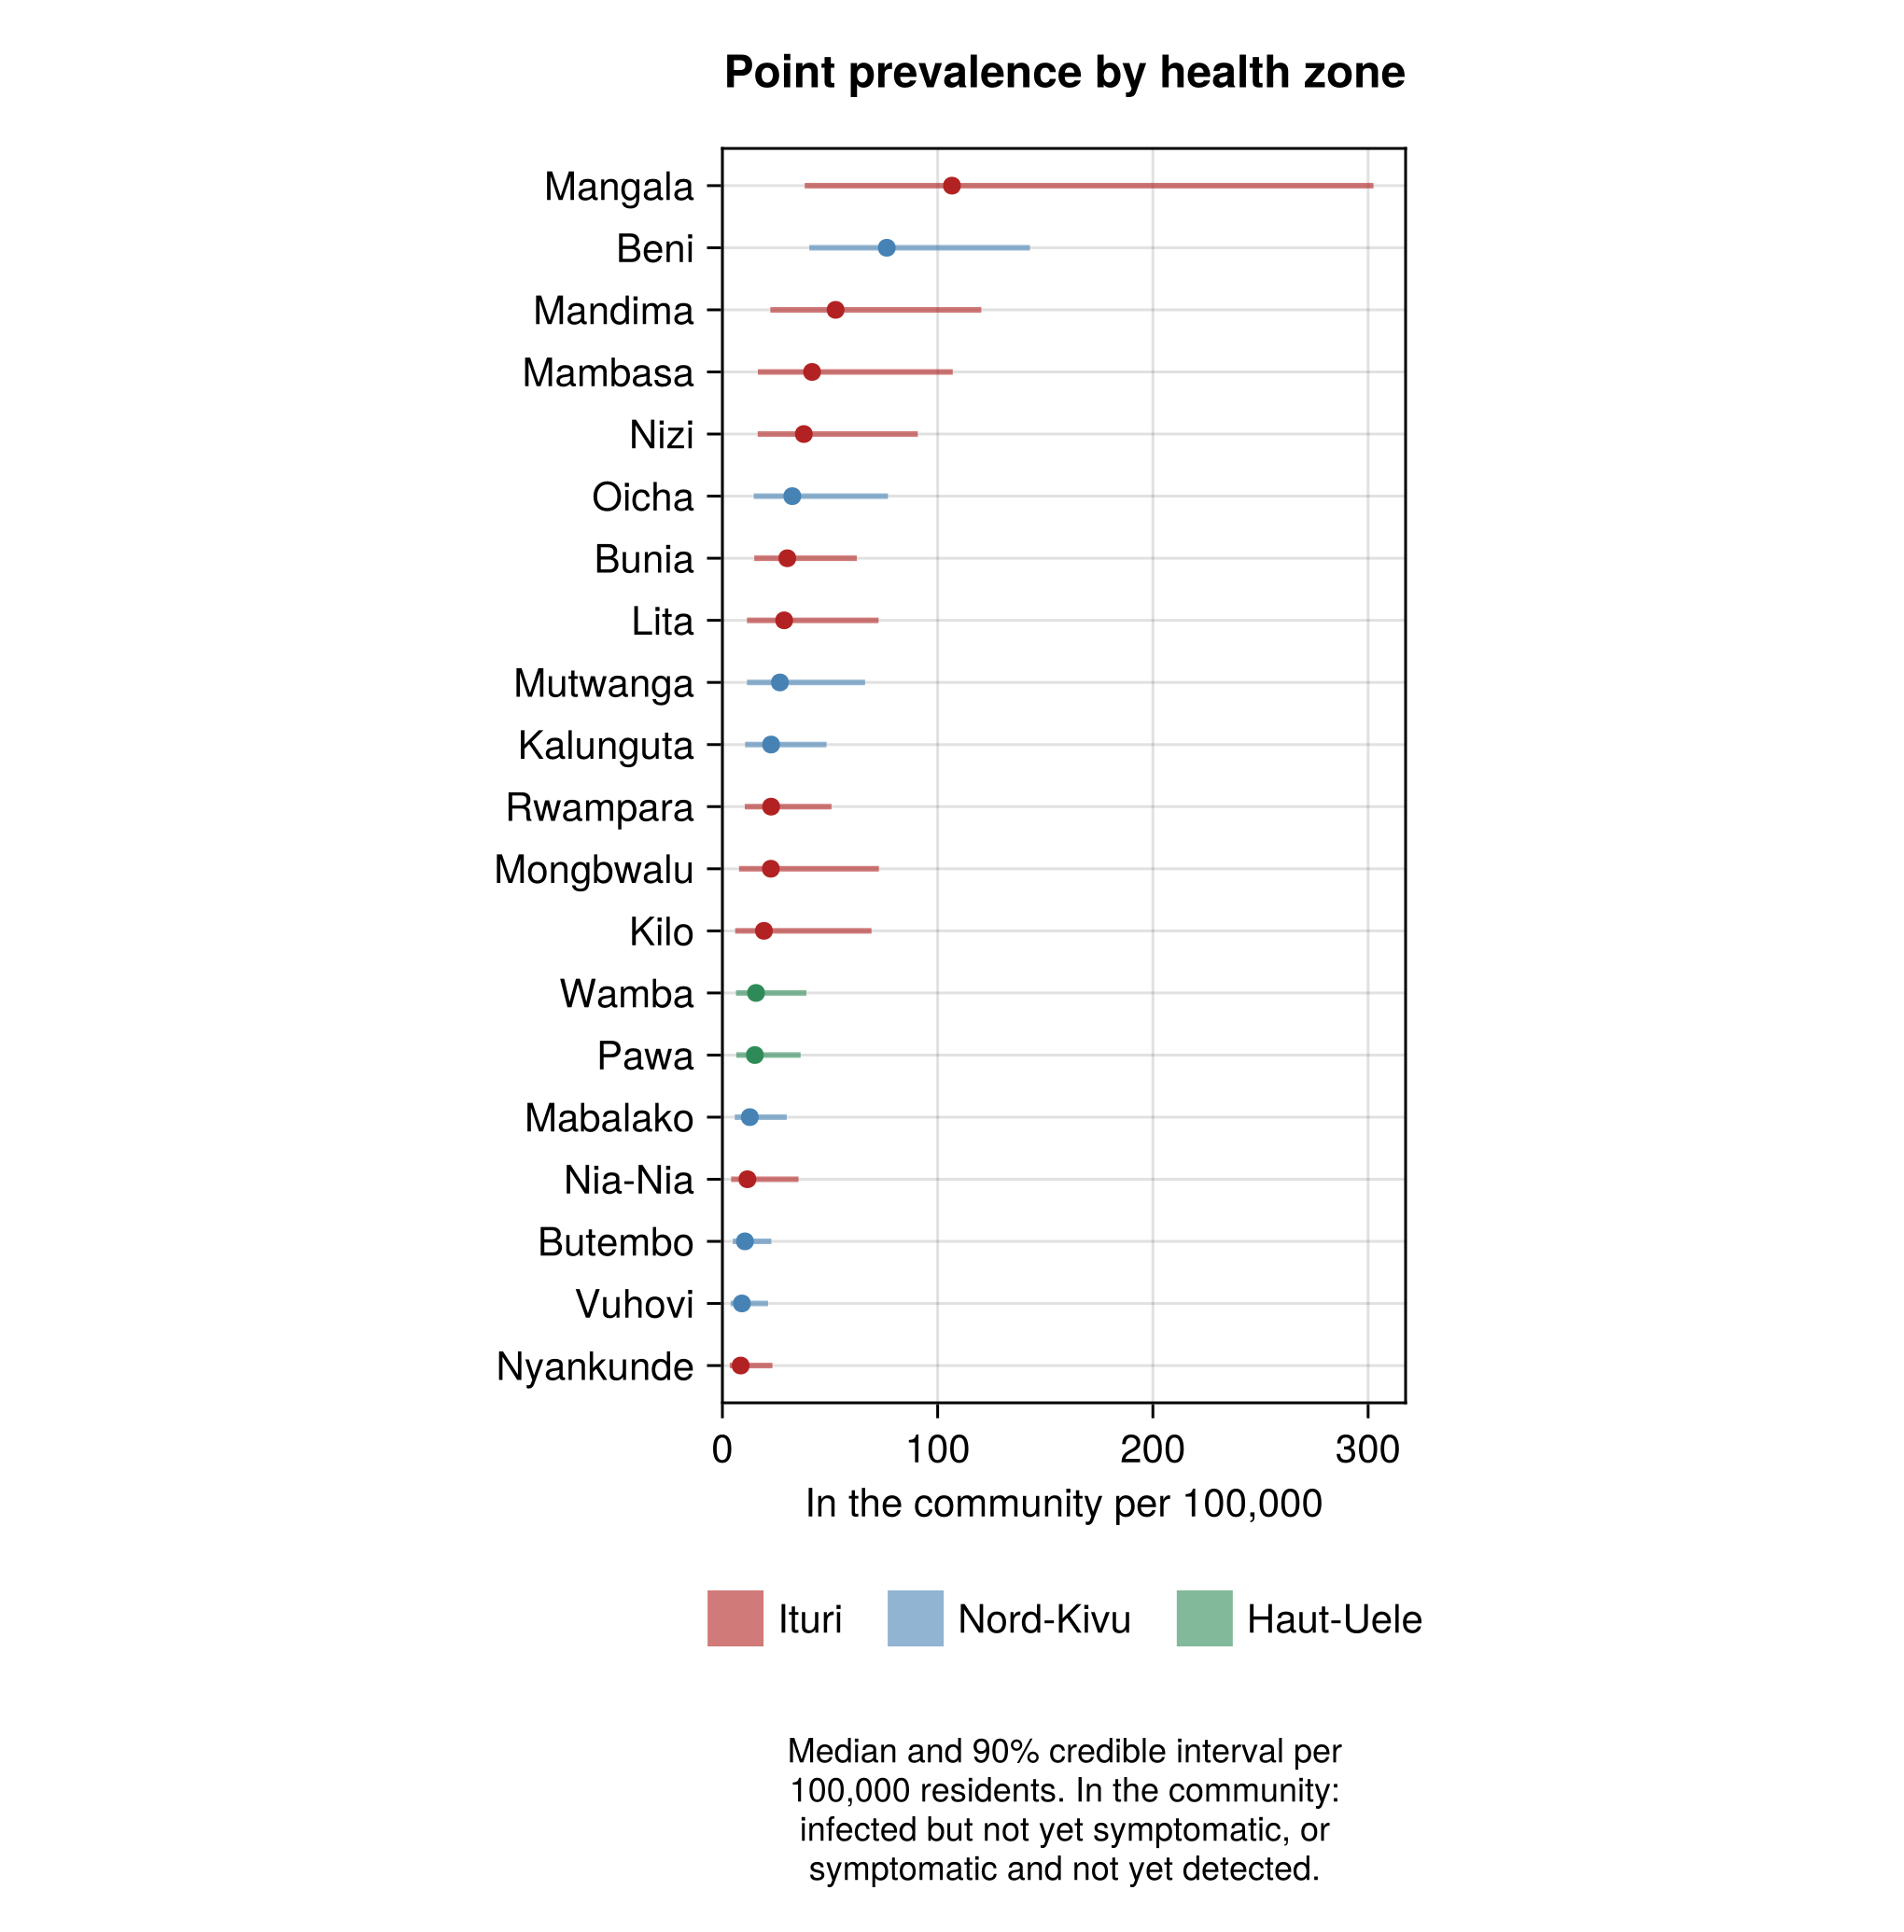
The zone estimates split the infections in the community at the cut-off in the same way as the province estimates. The point prevalence section of the Methods gives the calculation. The figure shows the twenty zones with the highest rate in the community per 100,000 residents. The table lists every zone in the same order.
Compute point prevalence by zone
zone_population = Dict(
    string(z.province, ".", z.zone) => z.population for z in load_health_zones()
);
zone_prevalence_overview = prevalence_overview(
    zone_prevalence(chn_local, zone_inputs, chn_joint),
    [zone_population[k] for k in zone_inputs.zone_keys];
    labels = zone_inputs.zone_labels, patch = zone_patch
);
zone_prevalence_fig = plot_prevalence_ranking(
    zone_prevalence_overview;
    patch_labels = zone_inputs.patch_labels, max_rows = 20,
    title = "Point prevalence by health zone"
);
| Zone | Population | Infected but not yet symptomatic per 100,000 | Symptomatic, undetected per 100,000 | In the community per 100,000 | Number in the community |
|---|---|---|---|---|---|
| Mangala | 89713 | 55.3 (15.9–183.5) | 51.0 (20.6–125.1) | 106.7 (38.3–302.5) | 96 (34–271) |
| Beni | 428854 | 34.4 (17.5–68.8) | 41.4 (21.3–77.7) | 76.4 (40.4–142.9) | 328 (173–613) |
| Mandima | 286637 | 20.8 (6.2–61.4) | 30.9 (13.7–65.6) | 52.6 (22.3–120.3) | 151 (64–345) |
| Mambasa | 150807 | 16.5 (5.0–56.0) | 24.3 (10.4–56.2) | 41.7 (16.5–107.0) | 63 (25–161) |
| Nizi | 129697 | 17.3 (6.5–47.0) | 19.9 (8.9–45.6) | 37.8 (16.4–90.8) | 49 (21–118) |
| Oicha | 274998 | 15.8 (6.2–42.0) | 16.1 (7.3–36.3) | 32.5 (14.6–76.9) | 89 (40–212) |
| Bunia | 509060 | 13.4 (5.7–30.8) | 16.6 (8.0–33.6) | 30.1 (14.8–62.5) | 153 (75–318) |
| Lita | 113364 | 12.5 (4.4–37.0) | 15.5 (6.4–36.0) | 28.7 (11.4–72.6) | 33 (13–82) |
| Mutwanga | 255278 | 13.1 (4.7–37.0) | 13.4 (5.7–32.2) | 26.7 (11.4–66.3) | 68 (29–169) |
| Kalunguta | 191732 | 10.5 (4.6–24.1) | 11.9 (5.5–25.4) | 22.6 (10.5–48.4) | 43 (20–93) |
| Rwampara | 252324 | 9.9 (4.0–25.9) | 12.4 (5.7–26.4) | 22.6 (10.4–50.7) | 57 (26–128) |
| Mongbwalu | 157714 | 9.6 (2.5–42.5) | 12.2 (4.7–32.9) | 22.5 (7.7–72.7) | 35 (12–115) |
| Kilo | 43139 | 9.0 (2.5–40.0) | 9.9 (3.2–31.0) | 19.3 (5.9–69.3) | 8 (3–30) |
| Wamba | 224757 | 7.7 (2.7–21.9) | 7.8 (3.4–18.5) | 15.6 (6.3–39.0) | 35 (14–88) |
| Pawa | 301768 | 7.5 (2.8–19.6) | 7.4 (3.3–17.3) | 15.1 (6.4–36.3) | 46 (19–110) |
| Mabalako | 197136 | 5.6 (2.3–14.4) | 7.0 (3.1–16.1) | 12.7 (5.8–29.9) | 25 (11–59) |
| Nia-Nia | 91756 | 4.1 (1.1–18.5) | 7.3 (2.7–19.3) | 11.6 (4.1–35.4) | 11 (4–32) |
| Butembo | 289378 | 4.7 (2.0–11.3) | 5.6 (2.6–12.4) | 10.5 (4.8–22.7) | 30 (14–66) |
| Vuhovi | 151953 | 4.2 (1.6–10.8) | 4.8 (2.0–11.1) | 9.1 (3.8–21.2) | 14 (6–32) |
| Nyankunde | 94004 | 3.7 (1.3–12.3) | 4.6 (1.9–12.2) | 8.5 (3.4–23.2) | 8 (3–22) |
| Katwa | 612242 | 3.3 (1.4–7.6) | 4.0 (1.9–8.6) | 7.4 (3.5–15.7) | 45 (22–96) |
| Isiro | 512401 | 2.8 (0.9–7.9) | 2.8 (1.2–6.7) | 5.7 (2.2–14.4) | 29 (11–74) |
| Biena | 136159 | 2.5 (1.1–5.5) | 2.9 (1.3–6.3) | 5.4 (2.5–11.9) | 7 (3–16) |
| Boma Mangbetu | 230104 | 2.5 (0.8–8.3) | 2.4 (0.9–6.6) | 4.9 (1.8–14.2) | 11 (4–33) |
| Bambu | 136151 | 2.1 (0.6–6.8) | 2.4 (0.8–6.2) | 4.5 (1.5–12.8) | 6 (2–17) |
| Musienene | 348392 | 2.0 (0.7–5.8) | 2.4 (1.0–5.7) | 4.4 (1.8–11.3) | 15 (6–39) |
| Manguredjipa | 68014 | 2.0 (0.8–4.8) | 2.3 (0.9–5.4) | 4.3 (1.8–10.1) | 3 (1–7) |
| Lolwa | 41314 | 1.6 (0.3–7.6) | 2.2 (0.6–7.3) | 3.9 (1.0–15.2) | 2 (0–6) |
| Masereka | 298636 | 1.8 (0.6–6.3) | 2.0 (0.8–5.5) | 3.8 (1.4–11.9) | 11 (4–36) |
| Kyondo | 270344 | 1.6 (0.6–4.9) | 1.8 (0.7–4.4) | 3.4 (1.4–9.2) | 9 (4–25) |
| Fataki | 158032 | 1.6 (0.4–7.6) | 1.6 (0.5–5.3) | 3.2 (0.9–12.7) | 5 (1–20) |
| Wapinda | 97712 | 1.6 (0.4–6.5) | 1.5 (0.4–5.2) | 3.2 (0.9–11.7) | 3 (1–11) |
| Kabondo | 204629 | 1.5 (0.6–3.5) | 1.5 (0.7–3.4) | 3.1 (1.4–6.9) | 6 (3–14) |
| Tchomia | 83917 | 1.4 (0.4–4.8) | 1.6 (0.5–4.7) | 3.0 (1.0–9.3) | 3 (1–8) |
| Komanda | 219948 | 0.9 (0.2–3.2) | 1.4 (0.5–3.8) | 2.3 (0.8–6.9) | 5 (2–15) |
| Mangobo | 188652 | 1.1 (0.4–2.8) | 1.2 (0.5–2.8) | 2.3 (1.0–5.6) | 4 (2–11) |
| Makiso-Kisangani | 535798 | 1.0 (0.5–2.3) | 1.1 (0.5–2.3) | 2.1 (1.0–4.5) | 11 (5–24) |
| Bafwasende | 132264 | 1.0 (0.4–2.5) | 1.0 (0.4–2.5) | 2.0 (0.9–5.0) | 3 (1–7) |
| Rungu | 194804 | 0.9 (0.3–2.2) | 0.8 (0.3–2.1) | 1.7 (0.6–4.3) | 3 (1–8) |
| Lubero | 377506 | 0.7 (0.2–2.5) | 0.9 (0.3–2.4) | 1.7 (0.6–4.7) | 6 (2–18) |
| Damas | 94820 | 0.7 (0.1–3.5) | 0.8 (0.2–2.9) | 1.5 (0.4–6.3) | 1 (0–6) |
| Yakoma | 167062 | 0.8 (0.2–3.1) | 0.7 (0.2–2.6) | 1.5 (0.4–5.7) | 2 (1–10) |
| Rimba | 222282 | 0.6 (0.3–1.5) | 0.7 (0.3–1.6) | 1.3 (0.6–3.0) | 3 (1–7) |
| Gety | 143442 | 0.5 (0.2–1.2) | 0.6 (0.3–1.6) | 1.2 (0.5–2.8) | 2 (1–4) |
| Logo | 216944 | 0.5 (0.2–1.3) | 0.6 (0.3–1.5) | 1.2 (0.5–2.7) | 3 (1–6) |
| Boga | 72028 | 0.4 (0.1–1.3) | 0.5 (0.2–1.5) | 1.0 (0.3–2.7) | 1 (0–2) |
| Drodro | 199996 | 0.4 (0.2–1.0) | 0.5 (0.2–1.2) | 0.9 (0.4–2.2) | 2 (1–4) |
| Aru | 329667 | 0.4 (0.2–0.9) | 0.5 (0.2–1.1) | 0.9 (0.4–2.0) | 3 (1–6) |
| Tshopo | 172885 | 0.3 (0.1–0.8) | 0.3 (0.1–0.8) | 0.6 (0.2–1.6) | 1 (0–3) |
| Gombari | 122901 | 0.3 (0.1–0.8) | 0.3 (0.1–0.8) | 0.5 (0.2–1.6) | 1 (0–2) |
| Kambala | 140956 | 0.2 (0.1–0.6) | 0.3 (0.1–0.7) | 0.5 (0.2–1.3) | 1 (0–2) |
| Alimbongo | 296821 | 0.2 (0.1–0.6) | 0.3 (0.1–0.6) | 0.5 (0.2–1.2) | 1 (1–3) |
| Adja | 126933 | 0.2 (0.0–0.5) | 0.2 (0.1–0.6) | 0.4 (0.1–1.0) | 0 (0–1) |
| Mahagi | 247893 | 0.2 (0.1–0.4) | 0.2 (0.1–0.5) | 0.4 (0.1–0.9) | 1 (0–2) |
| Lubunga | 154712 | 0.2 (0.0–0.6) | 0.2 (0.0–0.6) | 0.3 (0.1–1.1) | 1 (0–2) |
| Aungba | 216787 | 0.1 (0.0–0.4) | 0.2 (0.0–0.5) | 0.3 (0.1–0.9) | 1 (0–2) |
| Viadana | 187873 | 0.1 (0.1–0.3) | 0.2 (0.1–0.4) | 0.3 (0.1–0.7) | 1 (0–1) |
| Wanie-Rukula | 155297 | 0.1 (0.0–0.4) | 0.1 (0.0–0.4) | 0.3 (0.1–0.8) | 0 (0–1) |
| Ganga | 235401 | 0.1 (0.0–0.3) | 0.1 (0.0–0.3) | 0.3 (0.1–0.6) | 1 (0–1) |
| Kayna | 322628 | 0.1 (0.0–0.3) | 0.1 (0.0–0.4) | 0.2 (0.1–0.7) | 1 (0–2) |
| Bulu | 167481 | 0.1 (0.1–0.1) | 0.1 (0.1–0.2) | 0.2 (0.2–0.3) | 0 (0–0) |
| Ariwara | 314730 | 0.1 (0.0–0.3) | 0.1 (0.0–0.4) | 0.2 (0.1–0.7) | 1 (0–2) |
| Watsa | 491575 | 0.1 (0.0–0.3) | 0.1 (0.0–0.3) | 0.2 (0.1–0.5) | 1 (0–3) |
| Miti-Murhesa | 303983 | 0.1 (0.1–0.1) | 0.1 (0.0–0.1) | 0.1 (0.1–0.2) | 0 (0–1) |
| Dungu | 307763 | 0.1 (0.0–0.2) | 0.1 (0.0–0.2) | 0.1 (0.0–0.4) | 0 (0–1) |
| Buta | 274964 | 0.0 (0.0–0.1) | 0.0 (0.0–0.1) | 0.1 (0.0–0.3) | 0 (0–1) |
| Goma | 282838 | 0.0 (0.0–0.1) | 0.0 (0.0–0.1) | 0.1 (0.0–0.3) | 0 (0–1) |
Composition checks
Whether the model reproduces each zone's observed share of its patch's confirmed cases and deaths is on the in-sample checks page.
Data currency
The zone blocks are the per-zone confirmed-case and confirmed-death tables of the situation reports. A block that stops being picked up shows its last date before the cut-off.
Zone block currency
# Every zone block whose last vintage falls before the cut-off. The grace
# the national table allows is not applied here: one vintage behind is
# already worth reading.
zone_currency = let
    status = stream_report_status(obs; stratum = :zone)
    behind = status[[ismissing(d) || d > 0 for d in status.days_since], :]
    isempty(behind) ?
        Markdown.parse(
            "Every zone block reports to the cut-off, $(obs.cutoff)."
        ) :
        MarkdownTable(
            DataFrame(
                "Block" => behind.label,
                "Last reported" => [
                    ismissing(d) ? "never" : string(d)
                    for d in behind.last_date
                ],
                "Days before cut-off" => [
                    ismissing(d) ? "-" : string(d)
                    for d in behind.days_since
                ]
            )
        )
end;
Every zone block reports to the cut-off, 2026-11-16.
Health-zone fit diagnostics
Zone fit diagnostics
_zone_per_chain(v) = join(string.(round.(v; sigdigits = 3)), " / ")
function _zone_sampler_row(label, chn)
    d = zone_sampler_diagnostics(chn)
    return (
        fit = label, max_rhat = round(d.max_rhat; digits = 3),
        min_ess_bulk = round(d.min_ess_bulk; digits = 0),
        min_ess_tail = round(d.min_ess_tail; digits = 0),
        divergences = d.n_divergent,
        depth_cap = _zone_per_chain(d.depth_cap_fraction),
        ebfmi = _zone_per_chain(d.ebfmi),
        step_size = _zone_per_chain(d.step_size),
    )
end
zone_sampler_table = DataFrame(
    [
        _zone_sampler_row("health zones", chn_local),
        _zone_sampler_row("health zones (frozen)", frozen_local.chn),
    ]
);
zone_diagnostics = let d = zone_diagnostics_table(chn_local, zone_inputs)
    for c in names(d)[3:end]
        d[!, c] = round.(d[!, c]; digits = startswith(c, "rhat") ? 3 : 0)
    end
    DataFrame(
        [
            n == "walking" ?
                "R modelled separately" => [w ? "yes" : "no" for w in d[!, n]] :
                n => d[!, n]
                for n in names(d)
        ]
    )
end;| fit | max_rhat | min_ess_bulk | min_ess_tail | divergences | depth_cap | ebfmi | step_size |
|---|---|---|---|---|---|---|---|
| health zones | 1.018 | 159 | 315 | 0 | 0.0 / 0.001 | 0.914 / 0.844 | 0.00649 / 0.00749 |
| health zones (frozen) | 1.012 | 161 | 336 | 0 | 0.001 / 0.0 | 0.906 / 0.843 | 0.00875 / 0.00749 |
Per-zone R-hat and effective sample sizes
| zone | R modelled separately | rhat_R_T | ess_bulk_R_T | ess_tail_R_T | rhat_share_T | ess_bulk_share_T | ess_tail_share_T | rhat_delta_T | ess_bulk_delta_T | ess_tail_delta_T |
|---|---|---|---|---|---|---|---|---|---|---|
| Adja | no | NaN | NaN | NaN | 1.002 | 1785 | 1314 | 1.002 | 1044 | 1040 |
| Ariwara | no | NaN | NaN | NaN | 1 | 1008 | 1089 | 1.002 | 1430 | 1155 |
| Aru | no | 1.001 | 1726 | 1429 | 1.003 | 1350 | 1431 | 1.001 | 381 | 971 |
| Aungba | no | NaN | NaN | NaN | 1.001 | 1289 | 1643 | 1.003 | 553 | 857 |
| Bambu | yes | 1 | 2269 | 1470 | 1 | 1844 | 1725 | 1.002 | 2400 | 1398 |
| Boga | no | NaN | NaN | NaN | 1 | 1497 | 1634 | 1.002 | 1057 | 1083 |
| Bunia | yes | 1 | 2304 | 1535 | 1.001 | 2356 | 1371 | 0.999 | 2168 | 1407 |
| Damas | yes | 1.002 | 2306 | 1422 | 1 | 1919 | 1566 | 1.006 | 2346 | 1361 |
| Drodro | no | NaN | NaN | NaN | 1 | 1556 | 1564 | 1.003 | 1451 | 1082 |
| Fataki | yes | 1.001 | 2109 | 1284 | 1 | 2285 | 1625 | 1.001 | 2334 | 1532 |
| Gety | no | NaN | NaN | NaN | 1.001 | 1516 | 1475 | 1.003 | 1250 | 845 |
| Kambala | no | NaN | NaN | NaN | 1 | 1797 | 1366 | 1.001 | 574 | 970 |
| Kilo | yes | 1.001 | 2265 | 1321 | 1.001 | 2325 | 1757 | 1 | 2348 | 1482 |
| Komanda | yes | 1.001 | 1881 | 1429 | 1.005 | 1893 | 1650 | 1.004 | 2162 | 1035 |
| Lita | yes | 1 | 2385 | 1153 | 1 | 2224 | 1041 | 1 | 2362 | 1153 |
| Logo | no | 1.001 | 1690 | 1329 | 1.004 | 1343 | 1370 | 1.002 | 682 | 968 |
| Lolwa | yes | 1.001 | 1980 | 1525 | 1 | 1998 | 1597 | 1.001 | 2272 | 1315 |
| Mahagi | no | NaN | NaN | NaN | 1.001 | 1321 | 1576 | 1 | 597 | 931 |
| Mambasa | yes | 1.002 | 1971 | 1497 | 1.002 | 2213 | 1419 | 1.002 | 2595 | 1306 |
| Mandima | yes | 1.001 | 2291 | 1515 | 1.001 | 2013 | 1347 | 1.004 | 2577 | 1291 |
| Mangala | yes | 1.001 | 1928 | 1534 | 1 | 2091 | 1638 | 1 | 1981 | 1262 |
| Mongbwalu | yes | 1.003 | 2016 | 1072 | 1.005 | 2224 | 1631 | 1 | 2015 | 837 |
| Nia-Nia | yes | 1.001 | 2341 | 1763 | 1.001 | 2021 | 1610 | 1.003 | 2623 | 1491 |
| Nizi | yes | 1.001 | 2503 | 1389 | 1 | 2579 | 1814 | 1.002 | 2548 | 1582 |
| Nyankunde | yes | 1.003 | 2240 | 1725 | 1 | 2546 | 1480 | 1.002 | 2150 | 1306 |
| Rimba | no | 1 | 1699 | 1385 | 1.005 | 1111 | 1305 | 1.001 | 424 | 781 |
| Rwampara | yes | 0.999 | 2115 | 1321 | 1.001 | 2145 | 1502 | 1 | 2099 | 1344 |
| Tchomia | yes | 1.003 | 2093 | 1422 | 1 | 1811 | 1369 | 1.001 | 2696 | 1403 |
| Alimbongo | no | NaN | NaN | NaN | 1 | 2215 | 1295 | 1.001 | 756 | 1191 |
| Beni | yes | 1 | 2513 | 1451 | 0.999 | 1508 | 1403 | 0.999 | 2339 | 1425 |
| Biena | no | 1 | 2377 | 1488 | 1.001 | 1882 | 1723 | 1.002 | 1622 | 893 |
| Butembo | yes | 1 | 2297 | 1311 | 0.999 | 2253 | 1575 | 1.001 | 2198 | 1458 |
| Goma | no | NaN | NaN | NaN | 1.001 | 1409 | 1495 | 1.001 | 785 | 982 |
| Kalunguta | yes | 1.001 | 2357 | 1721 | 1.003 | 2474 | 1571 | 1 | 2339 | 1181 |
| Katwa | yes | 1.001 | 2344 | 1440 | 1 | 2317 | 1726 | 1 | 2396 | 1643 |
| Kayna | no | NaN | NaN | NaN | 1.001 | 1891 | 1578 | 1.007 | 609 | 975 |
| Kyondo | yes | 1.002 | 1683 | 1361 | 0.999 | 2070 | 1301 | 1 | 2557 | 1217 |
| Lubero | yes | 1 | 2836 | 1608 | 1 | 3073 | 1806 | 1.001 | 2888 | 1570 |
| Mabalako | yes | 1.001 | 1973 | 1462 | 1.001 | 1849 | 1782 | 1.002 | 2162 | 1735 |
| Manguredjipa | no | NaN | NaN | NaN | 1.003 | 798 | 1360 | 1.004 | 738 | 723 |
| Masereka | yes | 1 | 2659 | 1191 | 1 | 2248 | 1587 | 1 | 2497 | 1441 |
| Musienene | yes | 0.999 | 2139 | 1441 | 1 | 1927 | 1300 | 0.999 | 2506 | 1421 |
| Mutwanga | yes | 1.001 | 2107 | 1566 | 1.003 | 1876 | 1198 | 1.002 | 2306 | 1482 |
| Oicha | yes | 1 | 2305 | 1456 | 1 | 2538 | 1548 | 1 | 2359 | 1224 |
| Vuhovi | yes | 0.999 | 2117 | 1236 | 1 | 2225 | 1613 | 1 | 2650 | 1032 |
| Boma Mangbetu | yes | 1.003 | 2236 | 1587 | 1 | 2280 | 1642 | 1.001 | 2271 | 1659 |
| Dungu | no | NaN | NaN | NaN | 0.999 | 2493 | 1657 | 1 | 824 | 1039 |
| Gombari | no | NaN | NaN | NaN | 0.999 | 1706 | 1763 | 1.002 | 776 | 1151 |
| Isiro | yes | 1.001 | 2056 | 1323 | 1 | 2287 | 1555 | 1 | 2048 | 1555 |
| Pawa | yes | 1.001 | 2174 | 1431 | 1 | 2126 | 1659 | 1.001 | 2756 | 1550 |
| Rungu | no | NaN | NaN | NaN | 1.003 | 1475 | 1462 | 1.002 | 964 | 1156 |
| Wamba | yes | 1.008 | 2127 | 1414 | 1.002 | 2028 | 1488 | 1.005 | 2312 | 1396 |
| Watsa | no | NaN | NaN | NaN | 1 | 1982 | 1680 | 1.005 | 336 | 591 |
| Miti-Murhesa | no | NaN | NaN | NaN | 1.001 | 1928 | 1981 | NaN | NaN | NaN |
| Bafwasende | no | NaN | NaN | NaN | 1.002 | 1096 | 1938 | 1.001 | 1069 | 932 |
| Kabondo | no | 1 | 2633 | 1385 | 1 | 1833 | 1513 | 1.001 | 1436 | 1208 |
| Lubunga | no | NaN | NaN | NaN | 1 | 1373 | 1718 | 1 | 1221 | 1091 |
| Makiso-Kisangani | no | 1.001 | 2518 | 1400 | 1 | 1770 | 1708 | 1.002 | 578 | 1039 |
| Mangobo | no | NaN | NaN | NaN | 1.002 | 2040 | 1744 | 1.001 | 820 | 979 |
| Tshopo | no | NaN | NaN | NaN | 0.999 | 2421 | 1926 | 1.001 | 1070 | 961 |
| Wanie-Rukula | no | NaN | NaN | NaN | 1 | 1940 | 1495 | 1.002 | 1412 | 1028 |
| Buta | no | NaN | NaN | NaN | 1.001 | 2400 | 1654 | 1.001 | 1926 | 1088 |
| Ganga | no | NaN | NaN | NaN | 0.999 | 2812 | 1513 | 1.005 | 1366 | 1219 |
| Viadana | no | NaN | NaN | NaN | 1.001 | 1959 | 1722 | 1.004 | 1530 | 1074 |
| Bulu | no | NaN | NaN | NaN | 1.002 | 1885 | NaN | NaN | NaN | NaN |
| Wapinda | no | NaN | NaN | NaN | 1.003 | 1539 | 1151 | 1.003 | 1826 | 1358 |
| Yakoma | no | NaN | NaN | NaN | 1.003 | 1539 | 1151 | 1.003 | 1826 | 1358 |
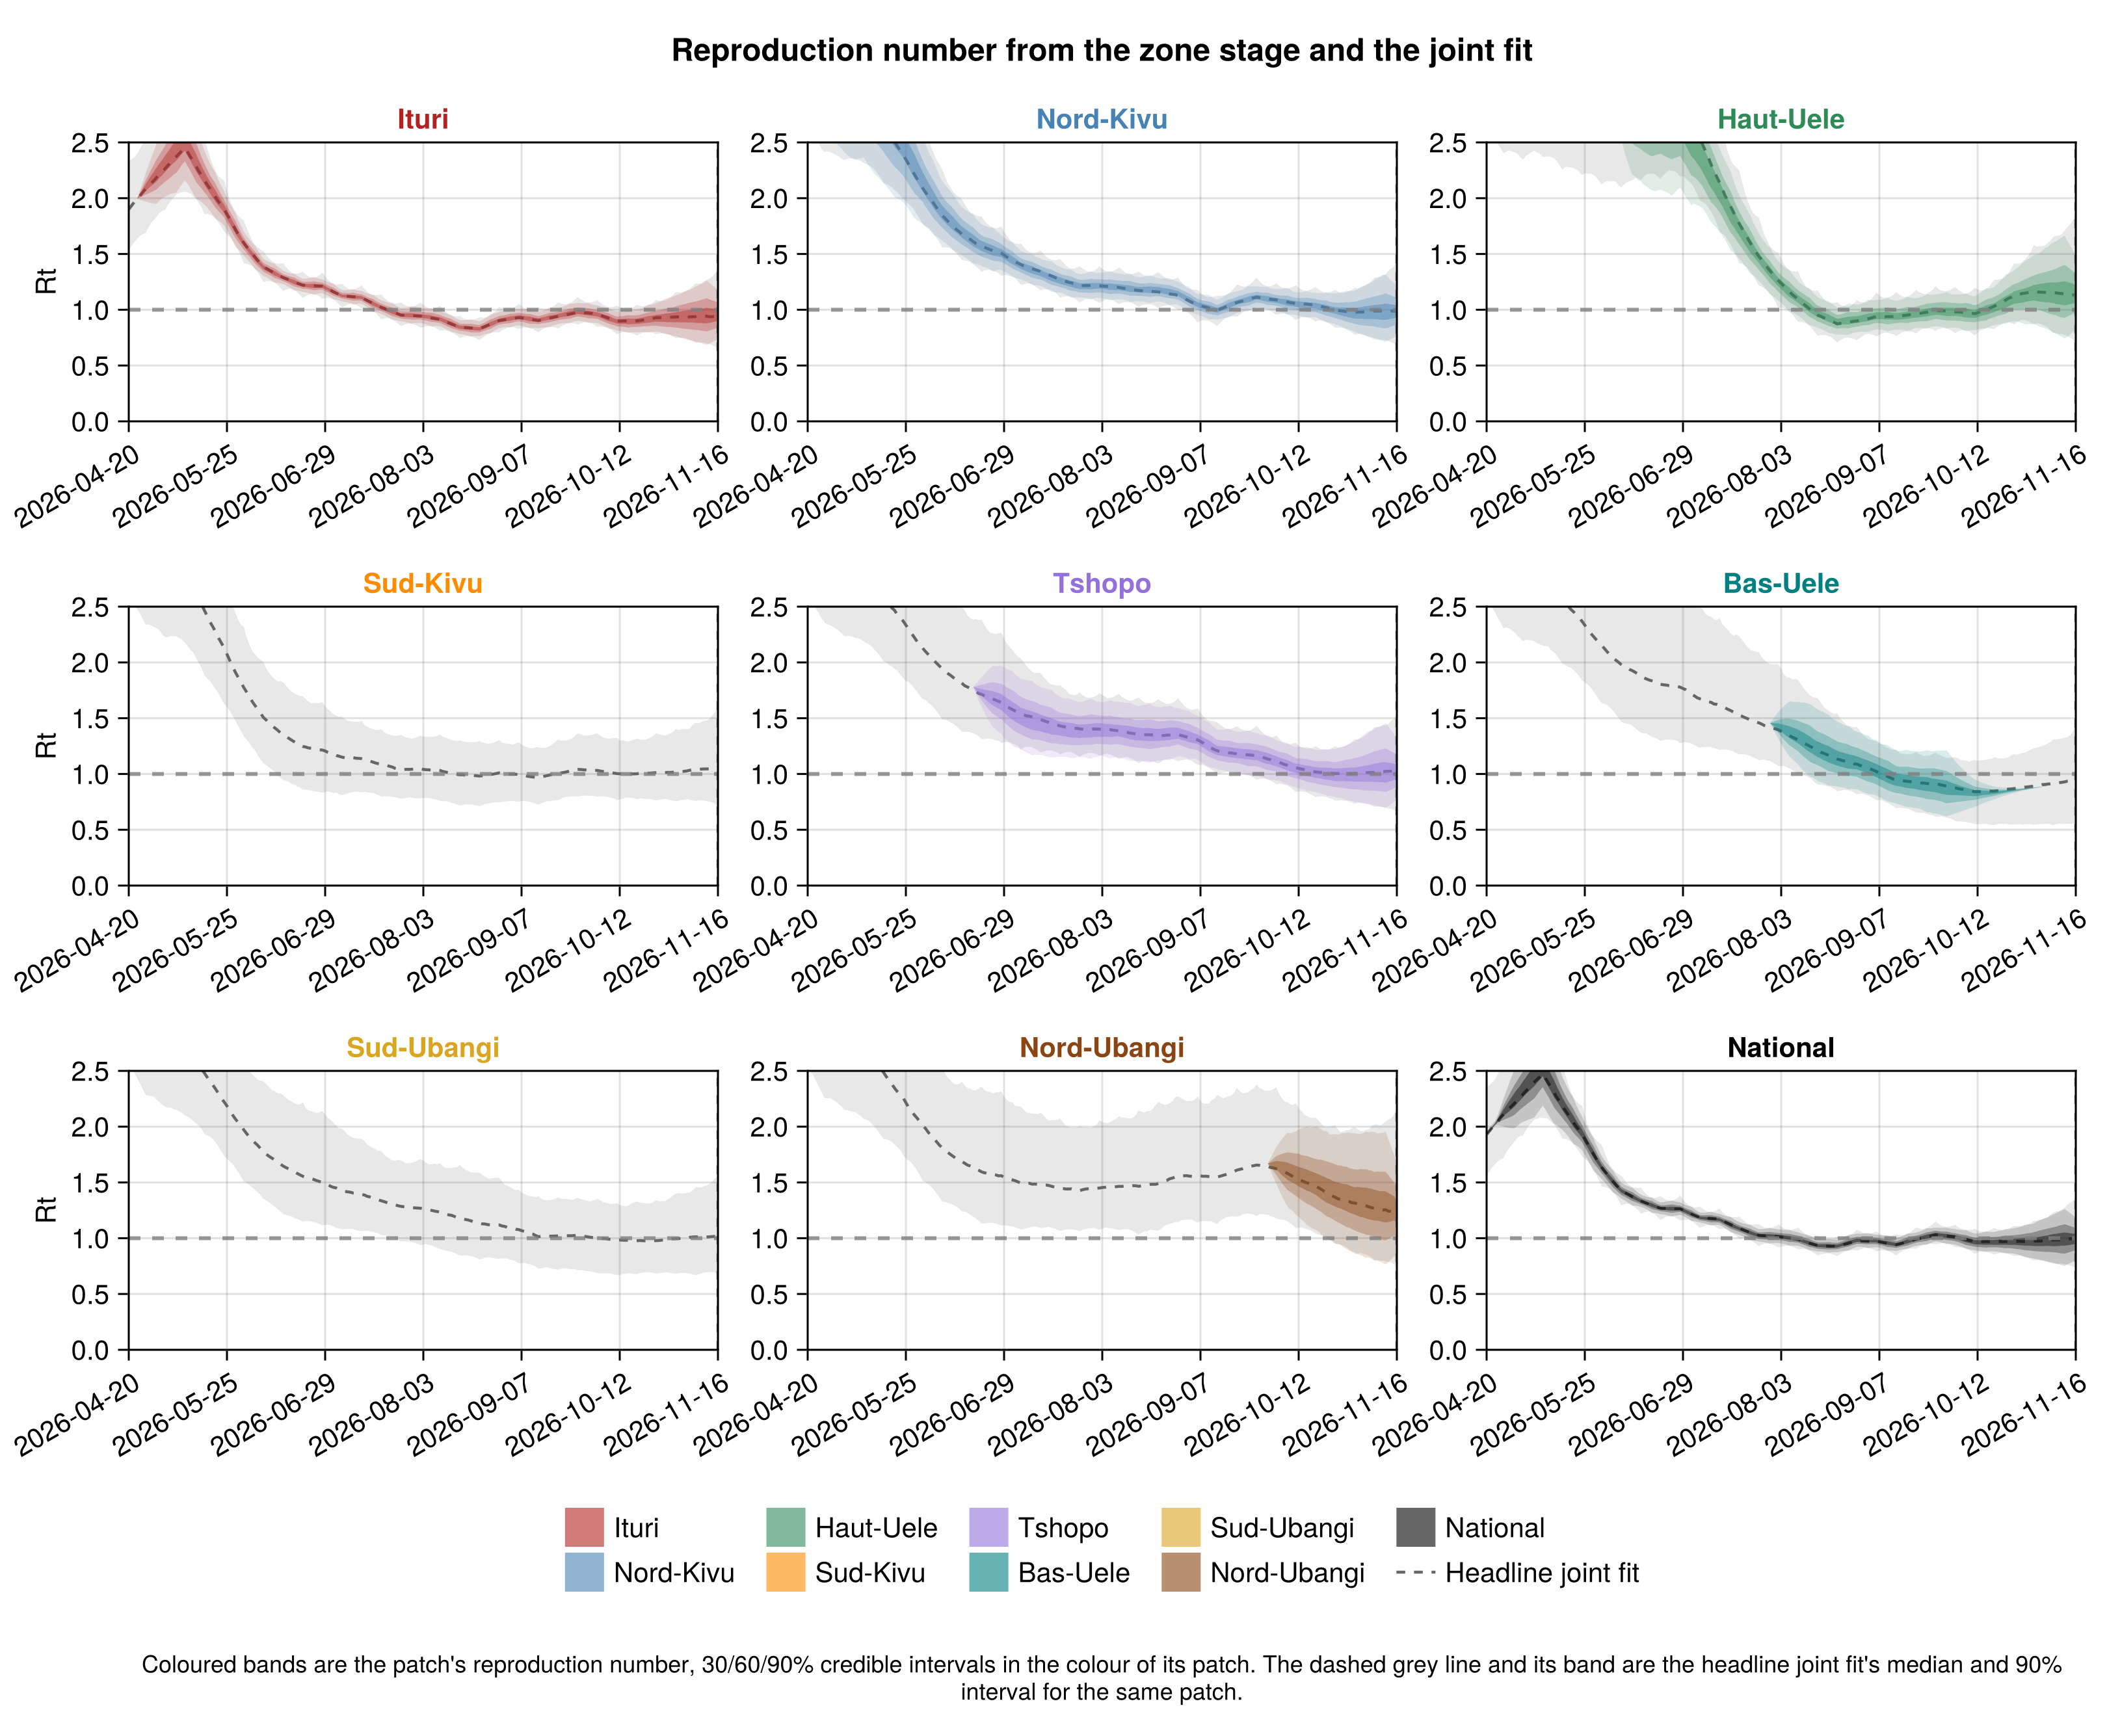
Reproduction number from the zone stage and the joint fit
# Each patch's implied reproduction number from the joint draws with the
# joint posterior mean generation interval, so the patch line is close to
# the quantity the zone values average to.
zone_grid = zone_inputs.t0:obs.n
_patch_infection_draws = vec(collect(chn_joint[:infections_patch]));
patch_implied_rt = [
    let m = Matrix{Float64}(
            undef,
            length(_patch_infection_draws), obs.n
        )
        for (i, v) in enumerate(_patch_infection_draws)
            I = reshape(Float64.(v), N_PATCHES, obs.n)
            m[i, :] .= implied_national_Rt(I[p, :], zone_inputs.g)
        end
        m
    end
        for p in 1:N_PATCHES
];
# The implied reproduction number of each row of `draws` (draws × days).
function _implied_rt_matrix(draws::AbstractMatrix)
    m = similar(draws, Float64)
    for i in axes(draws, 1)
        m[i, :] .= implied_national_Rt(view(draws, i, :), zone_inputs.g)
    end
    return m
end
# The zone stage's deformed patch trajectories on one side and the joint's
# draws on the other, nationally then per patch.
zone_stage_rt = let I = zone_patch_infections(chn_local, zone_inputs)
    vcat([_implied_rt_matrix(sum(I))], _implied_rt_matrix.(I))
end;
joint_stage_rt = let draws = _patch_infection_draws
    national = Float64[
        sum(reshape(Float64.(v), N_PATCHES, obs.n)[:, t])
            for v in draws, t in 1:obs.n
    ]
    vcat([_implied_rt_matrix(national)], patch_implied_rt)
end;
zone_meld_rt_fig = plot_rt_zones(
    [m[:, zone_grid] for m in zone_stage_rt],
    vcat(["National"], zone_inputs.patch_labels),
    vcat([N_PATCHES + 1], 1:N_PATCHES);
    patch_labels = vcat(zone_inputs.patch_labels, ["National"]),
    patch_colours = vcat(BVDOutbreakSize._ZONE_PATCH_COLOURS, [:black]),
    dates = grid_date.(zone_grid), as_of_date = obs.cutoff,
    top = N_PATCHES + 1, ncols = 3, unit = "patch",
    reference_rt = [m[:, zone_grid] for m in joint_stage_rt],
    reference_label = "Headline joint fit",
    title = "Reproduction number from the zone stage and the joint fit"
);
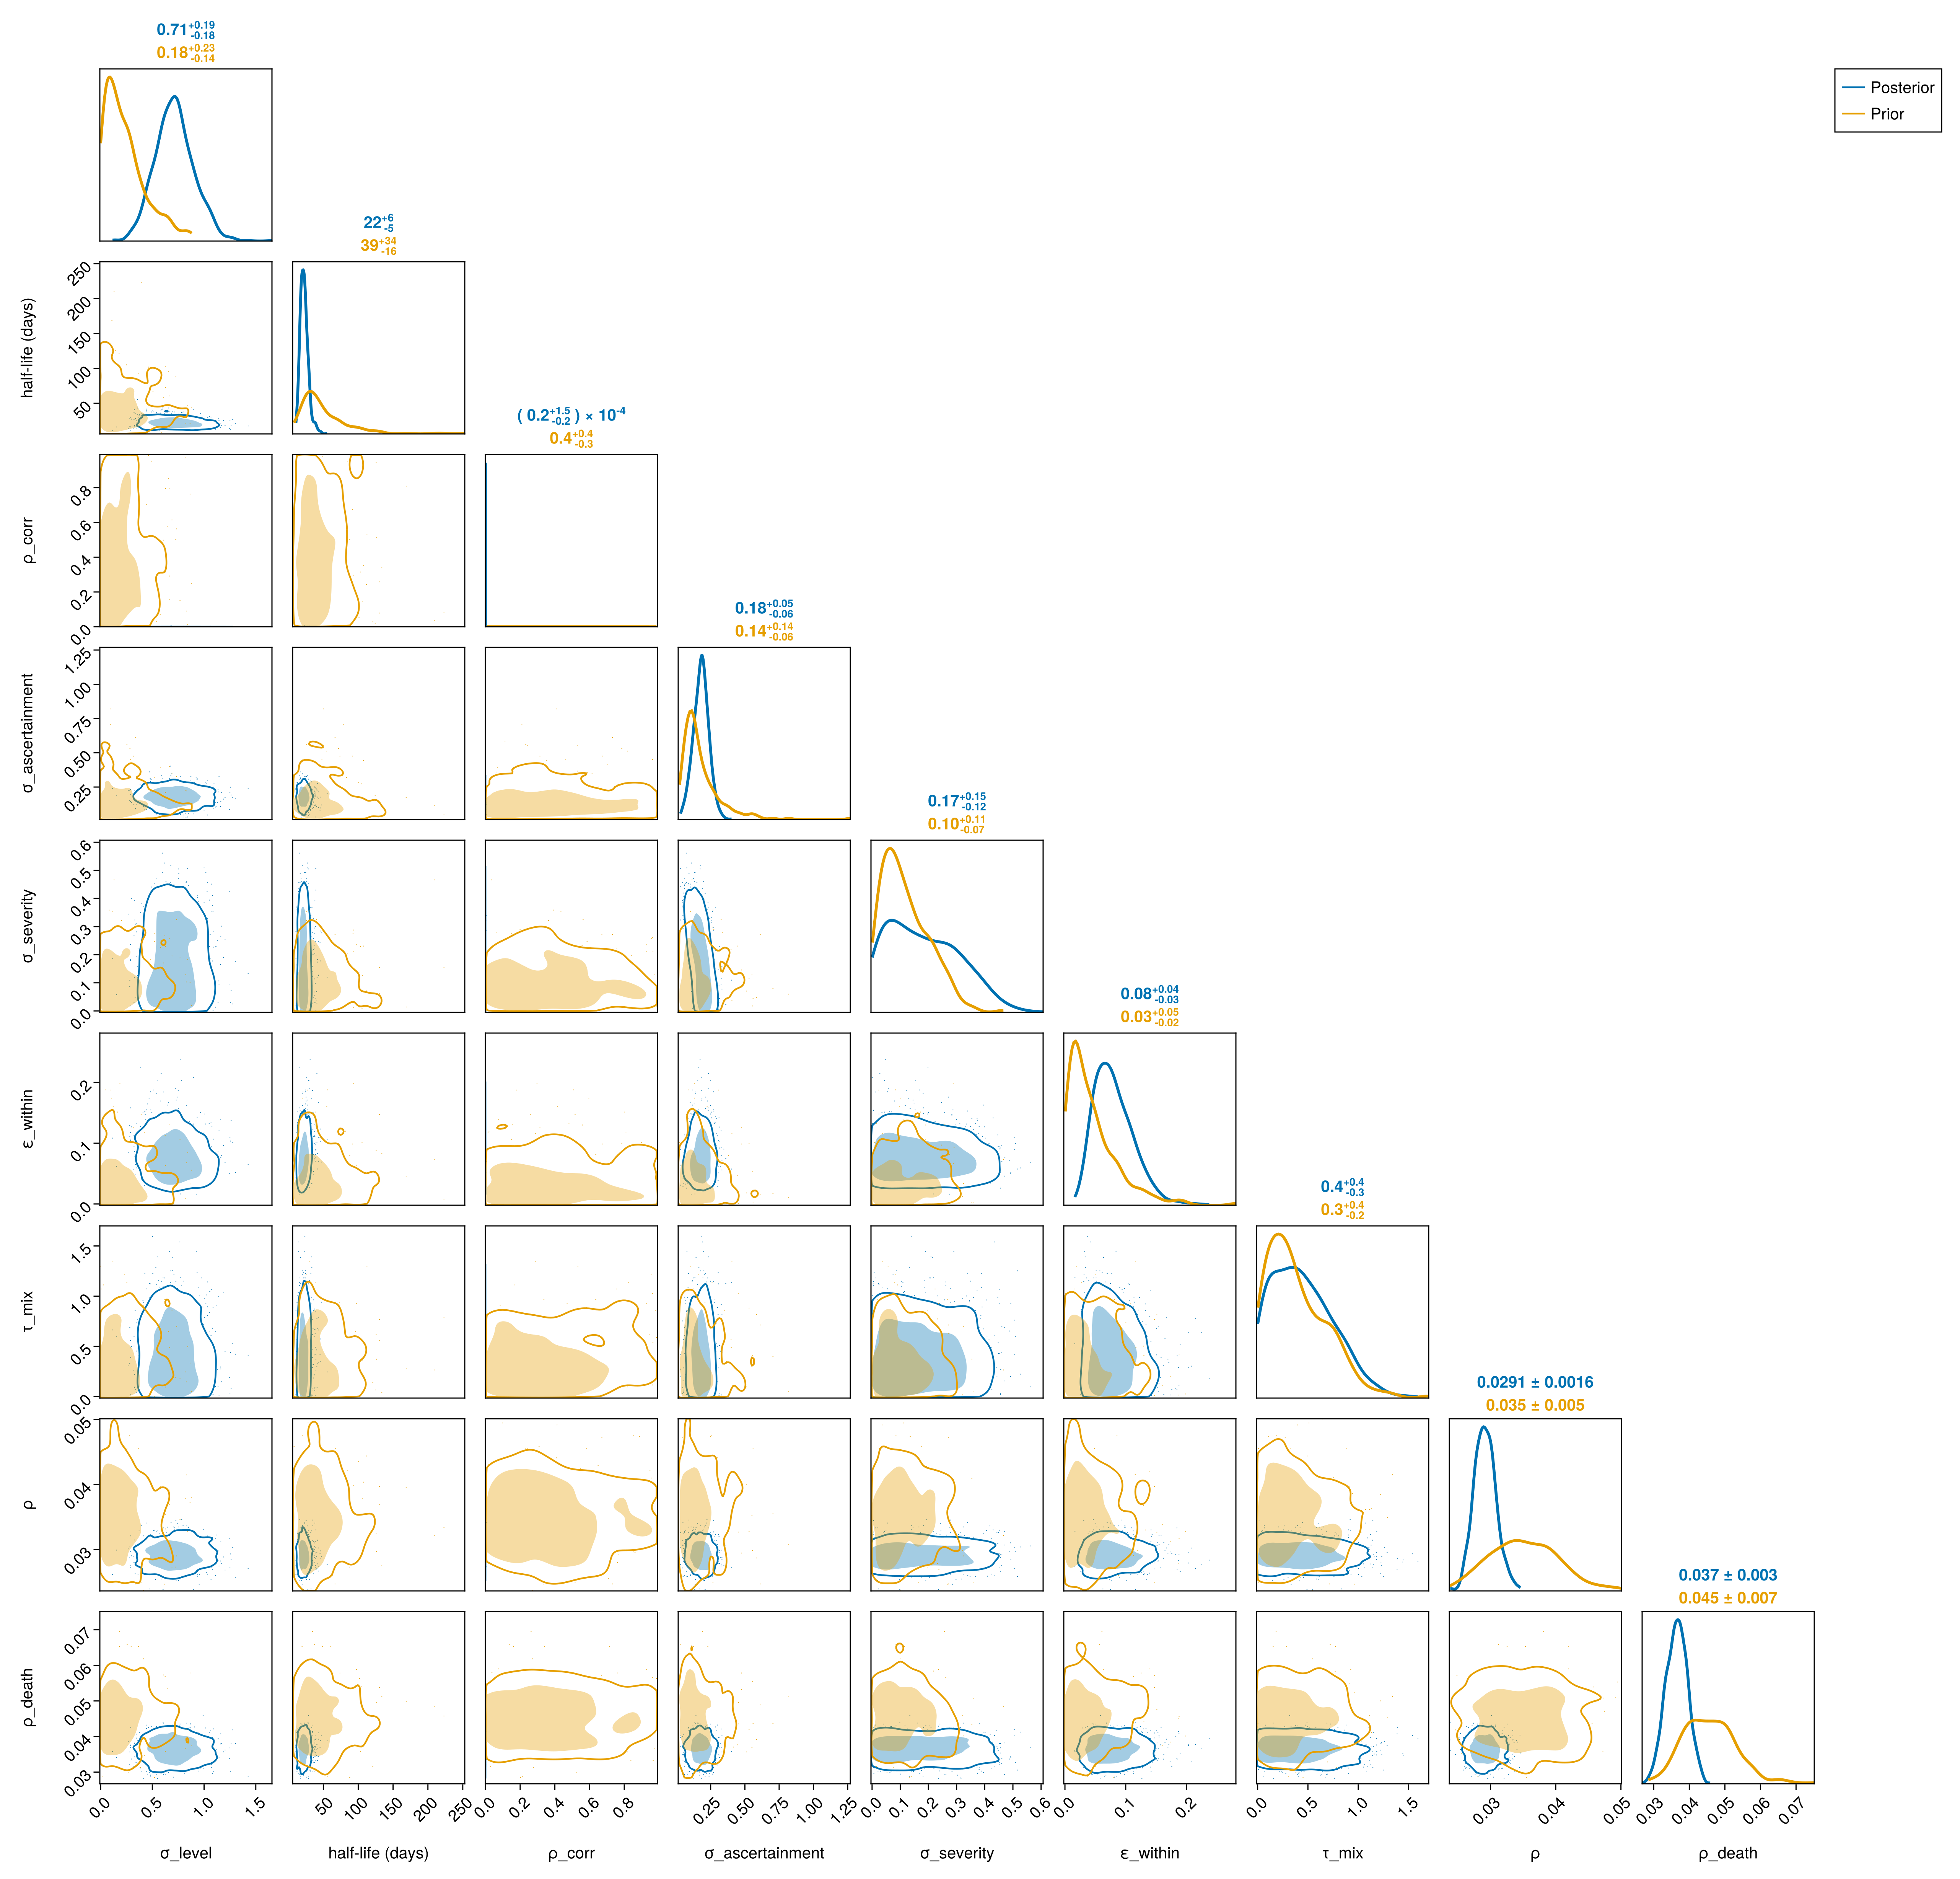
Health-zone parameters against their priors
Draw from the zone model's prior
prior_chn_zone = zone_prior_draws(zone_inputs);Compute the zone prior and posterior table
# Each scalar zone hyperparameter with its table label and pair-plot axis
# label, kept where both chains carry it: the mixing and correlation
# blocks are sampled only when their inputs are on.
zone_hyper = [
    h for h in (
            (:region_sd_zone, "Level spread σ_level", "σ_level"),
            (:region_halflife_zone, "Deviation half-life (days)", "half-life (days)"),
            (:correlation_reference_zone, "Correlation ρ_corr", "ρ_corr"),
            (
                :zone_ascertainment_sd, "Ascertainment spread σ_ascertainment",
                "σ_ascertainment",
            ),
            (
                :zone_severity_sd, "Severity spread σ_severity (logit)",
                "σ_severity",
            ),
            (:mixing_within_zone, "Within-patch mixing ε_within", "ε_within"),
            (:mixing_departure_zone, "Mixing departure τ_mix", "τ_mix"),
            (:composition_rho_zone, "Case composition ρ", "ρ"),
            (:composition_rho_death_zone, "Death composition ρ_death", "ρ_death"),
        )
        if BVDOutbreakSize._has_key(chn_local, h[1]) &&
        BVDOutbreakSize._has_key(prior_chn_zone, h[1])
]
zone_hyper_keys = first.(zone_hyper)
_hyper_draws(chn, k) = Float64.(vec(collect(chn[k])))
_drift_draws(chn, p) = Float64[
    v[p] for v in vec(collect(chn[:region_drift_sd_zone]))
]
function _prior_posterior_row(label, post, prior)
    f(x) = string(round(x; sigdigits = 3))
    ci(v) = string(
        f(median(v)), " (", f(quantile(v, 0.05)), "–",
        f(quantile(v, 0.95)), ")"
    )
    return (
        parameter = label, posterior = ci(post), prior = ci(prior),
        sd_ratio = round(std(post) / std(prior); digits = 2),
    )
end
zone_prior_table = DataFrame(
    vcat(
        [
            _prior_posterior_row(
                label, _hyper_draws(chn_local, k),
                _hyper_draws(prior_chn_zone, k)
            )
                for (k, label, _) in zone_hyper
        ],
        [
            _prior_posterior_row(
                "Drift scale σ_δ ($(zone_inputs.patch_labels[p]))",
                _drift_draws(chn_local, p), _drift_draws(prior_chn_zone, p)
            )
                for p in eachindex(zone_inputs.patch_labels)
        ]
    )
);
# The pair plot's axes take the symbols alone.
zone_hyper_pair_fig = plot_pair(
    chn_local, zone_hyper_keys;
    prior = prior_chn_zone,
    labels = Dict(k => sym for (k, _, sym) in zone_hyper)
);| parameter | posterior | prior | sd_ratio |
|---|---|---|---|
| Level spread σ_level | 0.707 (0.423–1.03) | 0.222 (0.0221–0.635) | 0.98 |
| Deviation half-life (days) | 22.0 (14.6–33.4) | 40.6 (15.4–105.0) | 0.19 |
| Correlation ρ_corr | 2.05e-5 (1.83e-7–0.000642) | 0.387 (0.0354–0.897) | 0 |
| Ascertainment spread σ_ascertainment | 0.184 (0.0872–0.274) | 0.139 (0.0468–0.445) | 0.4 |
| Severity spread σ_severity (logit) | 0.166 (0.0145–0.402) | 0.103 (0.0129–0.273) | 1.46 |
| Within-patch mixing ε_within | 0.0762 (0.0381–0.141) | 0.0347 (0.00246–0.129) | 0.76 |
| Mixing departure τ_mix | 0.418 (0.0349–0.987) | 0.313 (0.0285–0.942) | 1.02 |
| Case composition ρ | 0.0291 (0.0265–0.0321) | 0.0348 (0.0269–0.0436) | 0.32 |
| Death composition ρ_death | 0.0365 (0.0314–0.0416) | 0.0451 (0.0338–0.0586) | 0.38 |
| Drift scale σ_δ (Ituri) | 0.429 (0.336–0.557) | 0.108 (0.0585–0.205) | 1.47 |
| Drift scale σ_δ (Nord-Kivu) | 0.249 (0.174–0.357) | 0.111 (0.0587–0.204) | 1.16 |
| Drift scale σ_δ (Haut-Uele) | 0.302 (0.189–0.47) | 0.108 (0.0579–0.196) | 1.94 |
| Drift scale σ_δ (Sud-Kivu) | 0.109 (0.0613–0.201) | 0.111 (0.0583–0.203) | 0.96 |
| Drift scale σ_δ (Tshopo) | 0.109 (0.0592–0.208) | 0.111 (0.0588–0.209) | 0.96 |
| Drift scale σ_δ (Bas-Uele) | 0.11 (0.0598–0.196) | 0.109 (0.064–0.195) | 1.02 |
| Drift scale σ_δ (Sud-Ubangi) | 0.109 (0.058–0.204) | 0.111 (0.0585–0.208) | 1.04 |
| Drift scale σ_δ (Nord-Ubangi) | 0.109 (0.0582–0.195) | 0.115 (0.0604–0.209) | 0.91 |
Zone hyperparameter pair plot (prior overlaid)
Change over the past week
How each zone's reproduction number has moved between the fit a week earlier and the current one is on the in-sample checks page.
Saving zone assets
The dashboard map reads the per-zone estimates and time series written here, and the summary dashboard's health-zone table is built from them. The zone forecast assets are written by the health-zone forecasts and health-zone forecast evaluation pages.
Write the zone dashboard and release assets
dashboard_dir = joinpath(
    pkgdir(BVDOutbreakSize), "docs", "src", "summary_assets"
)
mkpath(dashboard_dir)
# The health-zone maps, the weekly cases against R and the one-week zone forecast for the summary
# dashboard, and the per-zone estimates the interactive map reads: one row per zone keyed as the
# geojson keys it, with the cases and deaths to date, the reproduction
# number and the chance it exceeds one, the one-week forecast and the
# share of the patch's infections, whether the zone's reproduction number
# is modelled separately (`walking`) and the data cut-off. A zone below the
# reporting floor carries no reproduction number.
CairoMakie.save(joinpath(dashboard_dir, "zone_rt_map.png"), zone_map_fig)
CairoMakie.save(
    joinpath(dashboard_dir, "cases_rt_zones.png"),
    plot_cases_rt(
        zone_cases_rt; patch_labels = zone_inputs.patch_labels, top = 12,
        unit = "health zone", size = (680, 560), fontsize = 12
    )
)
_zone_deaths = [
    let h = obs.zone_death_history
        haskey(h, prov) && haskey(h[prov], z) &&
            !isempty(h[prov][z].counts) ? Int(h[prov][z].counts[end]) :
            0
    end
        for (prov, z) in zip(
            zone_inputs.zone_province,
            zone_inputs.zone_names
        )
]
_zone_rt_stat(f) = [isempty(r) ? missing : f(r) for r in zone_RT_finite]
zone_estimates = DataFrame(
    zone = zone_map_keys,
    label = zone_inputs.zone_labels, province = zone_inputs.zone_province,
    patch = zone_inputs.patch_labels[zone_patch],
    cases = zone_inputs.cumulative, deaths = _zone_deaths,
    R_T_median = _zone_rt_stat(median),
    p_rt_above_one = [
        isempty(r) ? missing : mean(r .> 1) for r in zone_RT_finite
    ],
    R_T_lower = _zone_rt_stat(r -> quantile(r, 0.05)),
    R_T_upper = _zone_rt_stat(r -> quantile(r, 0.95)),
    forecast_median = [median(v) for v in zone_fc_draws.zones],
    forecast_lower = [quantile(v, 0.05) for v in zone_fc_draws.zones],
    forecast_upper = [quantile(v, 0.95) for v in zone_fc_draws.zones],
    share_median = [median(v) for v in zone_share_T],
    share_lower = [quantile(v, 0.05) for v in zone_share_T],
    share_upper = [quantile(v, 0.95) for v in zone_share_T],
    p_ge_1 = zone_fc_probs[:, 1], p_ge_5 = zone_fc_probs[:, 2],
    p_ge_10 = zone_fc_probs[:, 3], p_ge_20 = zone_fc_probs[:, 4],
    cases_last_7 = zone_recent[7], cases_last_14 = zone_recent[14],
    cases_last_28 = zone_recent[28],
    last_case_date = [ismissing(d) ? "" : string(d) for d in zone_last_case],
    walking = Int.(zone_inputs.walking),
    as_of = fill(string(obs.cutoff), length(zone_map_keys))
)
CSV.write(joinpath(dashboard_dir, "zone_estimates.csv"), zone_estimates)
# Each zone's daily reproduction number, weekly allocated confirmed cases
# with their posterior predictive, and weekly confirmed deaths, for the
# dashboard map's detail column. A zone's deaths are its own cumulative
# series, so each zone is binned on its own vintages.
#
# The predictive is the zone composition's, which splits each patch's
# observed count across its zones, so it checks the allocation rather than
# the patch total. The deaths have none: the model zeroes the reattributed
# death vintages that the observed series keeps, so the two would not bin
# alike.
_zone_case_ppc = zone_composition_draws(chn_local, zone_inputs);
_with_series(t, s) = (t[!, :series] .= s; t)
_zone_weekly_deaths = let h = obs.zone_death_history
    out = DataFrame(area = String[], date = Date[], count = Int[])
    for (prov, z, key) in zip(
            zone_inputs.zone_province, zone_inputs.zone_names, zone_map_keys
        )
        haskey(h, prov) && haskey(h[prov], z) &&
            !isempty(h[prov][z].counts) || continue
        c = h[prov][z].counts
        append!(
            out,
            weekly_count_table(
                h[prov][z].days, reshape([c[1]; max.(diff(c), 0)], 1, :),
                [key]; cutoff = obs.cutoff, n = obs.n
            )
        )
    end
    out
end
CSV.write(
    joinpath(dashboard_dir, "zone_timeseries.csv"),
    vcat(
        _with_series(
            rt_quantile_table(
                zone_rt_traj, zone_map_keys; cutoff = obs.cutoff,
                n = obs.n, from = zone_inputs.t0
            ), "rt"
        ),
        _with_series(
            weekly_count_table(
                zone_inputs.days, zone_inputs.counts, zone_map_keys;
                cutoff = obs.cutoff, n = zone_inputs.n
            ), "cases"
        ),
        _with_series(_zone_weekly_deaths, "deaths"),
        _with_series(
            weekly_quantile_table(
                zone_inputs.days, _zone_case_ppc.predictive, zone_map_keys;
                cutoff = obs.cutoff, n = zone_inputs.n
            ), "cases_fit"
        );
        cols = :union
    )
)
open(joinpath(dashboard_dir, "zone_headline.md"), "w") do io
    print(io, zone_headline(zone_estimates; top = 10))
end
# The zone estimates and time series into the release outputs, so each
# results release carries the dashboard map's zone inputs at its cut-off.
output_dir = get(
    ENV, "BVD_OUTPUT_DIR",
    joinpath(pkgdir(BVDOutbreakSize), "output")
)
mkpath(output_dir)
for f in ("zone_estimates.csv", "zone_timeseries.csv")
    cp(joinpath(dashboard_dir, f), joinpath(output_dir, f); force = true)
end
The full analysis code, data and model definitions are in the epiforecasts/BVDOutbreakSize repository.