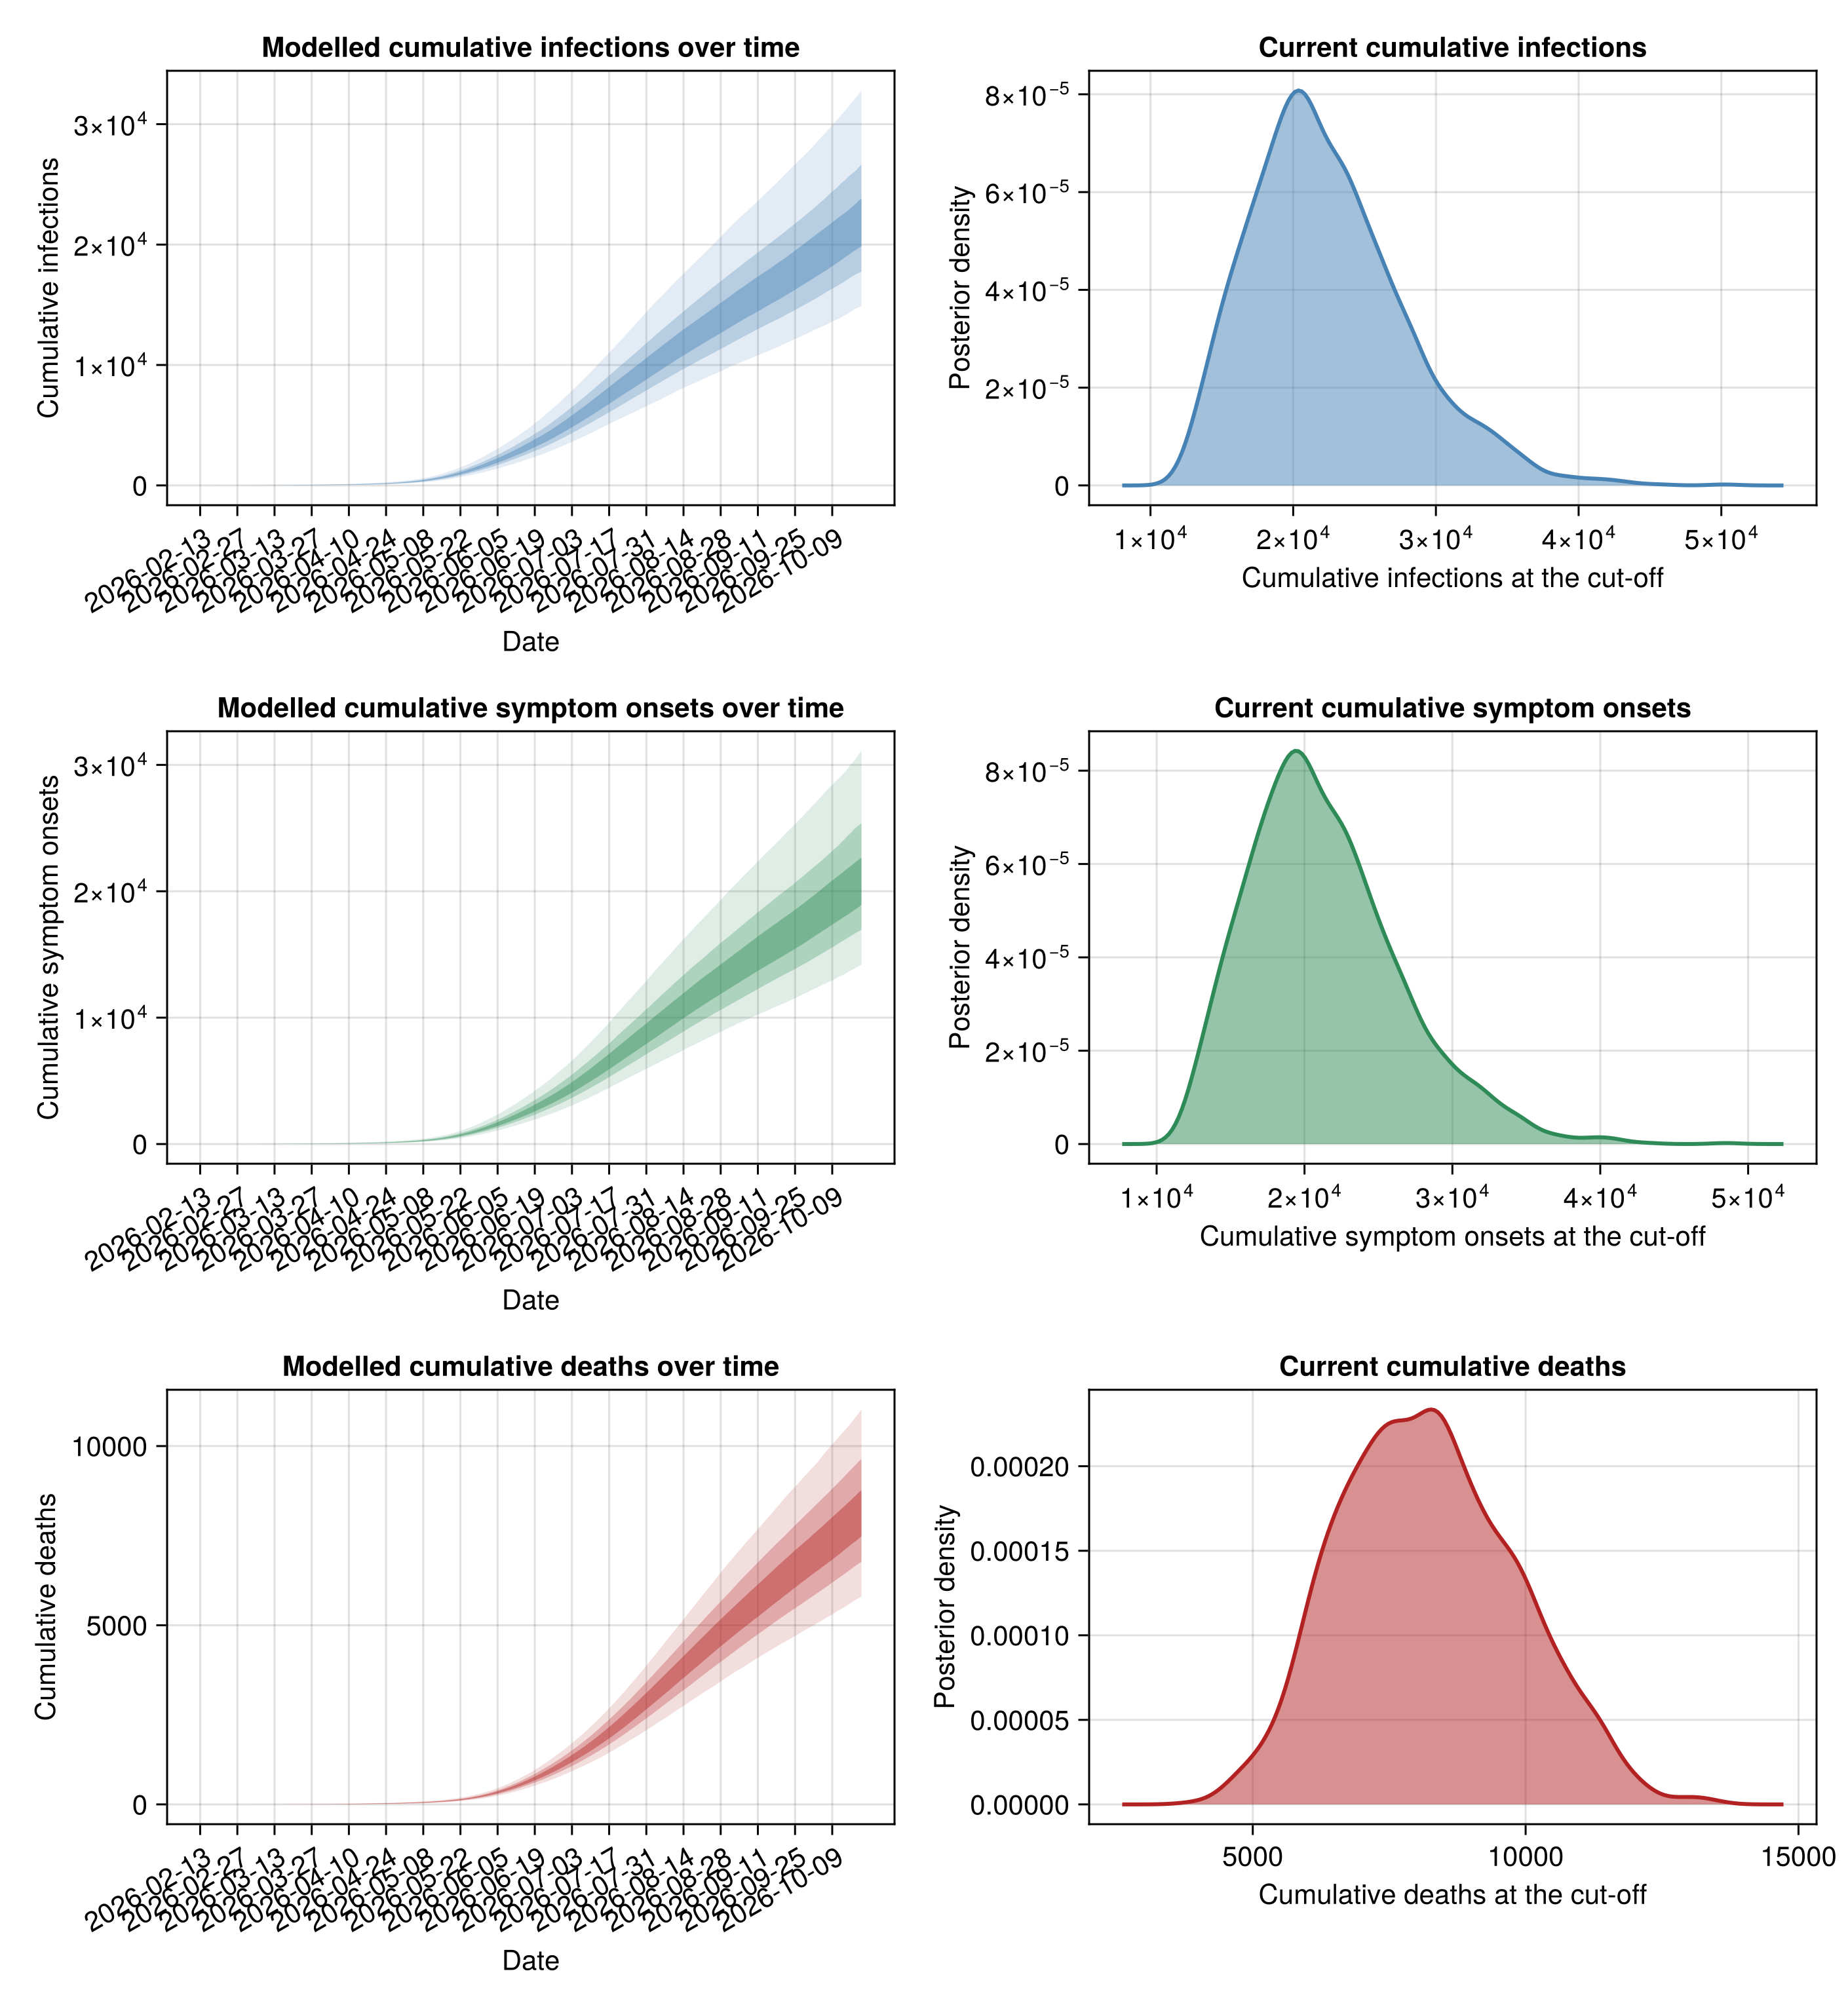
Summary dashboard
Last updated: 23 October 2026.
Data as of: 20 October 2026.
See Methods for the model and the definition of each quantity.
Headline estimates
Cumulative infections: the outbreak is estimated to have caused 30% 19852–23821, 60% 17752–26643, 90% 14896–32793 infections to date, reported and unreported.
Against the 9704 laboratory-confirmed cases by the cut-off that is roughly 1.5–3.4× as many infections, so confirmed cases are estimated to capture only a small share of the outbreak.
Outbreak start and age: the outbreak is estimated to have begun on a start date of 30% 2026-03-13–2026-03-20, 60% 2026-03-09–2026-03-23, 90% 2026-02-28–2026-03-28, an elapsed age to the cut-off of 30% 214–221, 60% 211–225, 90% 206–234 days.
Growth rate and doubling time: the initial growth rate is estimated to have been 30% 0.055–0.067, 60% 0.049–0.075, 90% 0.039–0.088 per day, an initial doubling time of 30% 12.5–10.3, 60% 14.1–9.3, 90% 17.8–7.9 days. The latest growth rate is estimated to be 30% 0.001–0.011, 60% -0.005–0.018, 90% -0.017–0.031 per day, a latest doubling time of 30% 688.7–65.9, 60% -141.1–39.3, 90% -40.7–22.2 days.
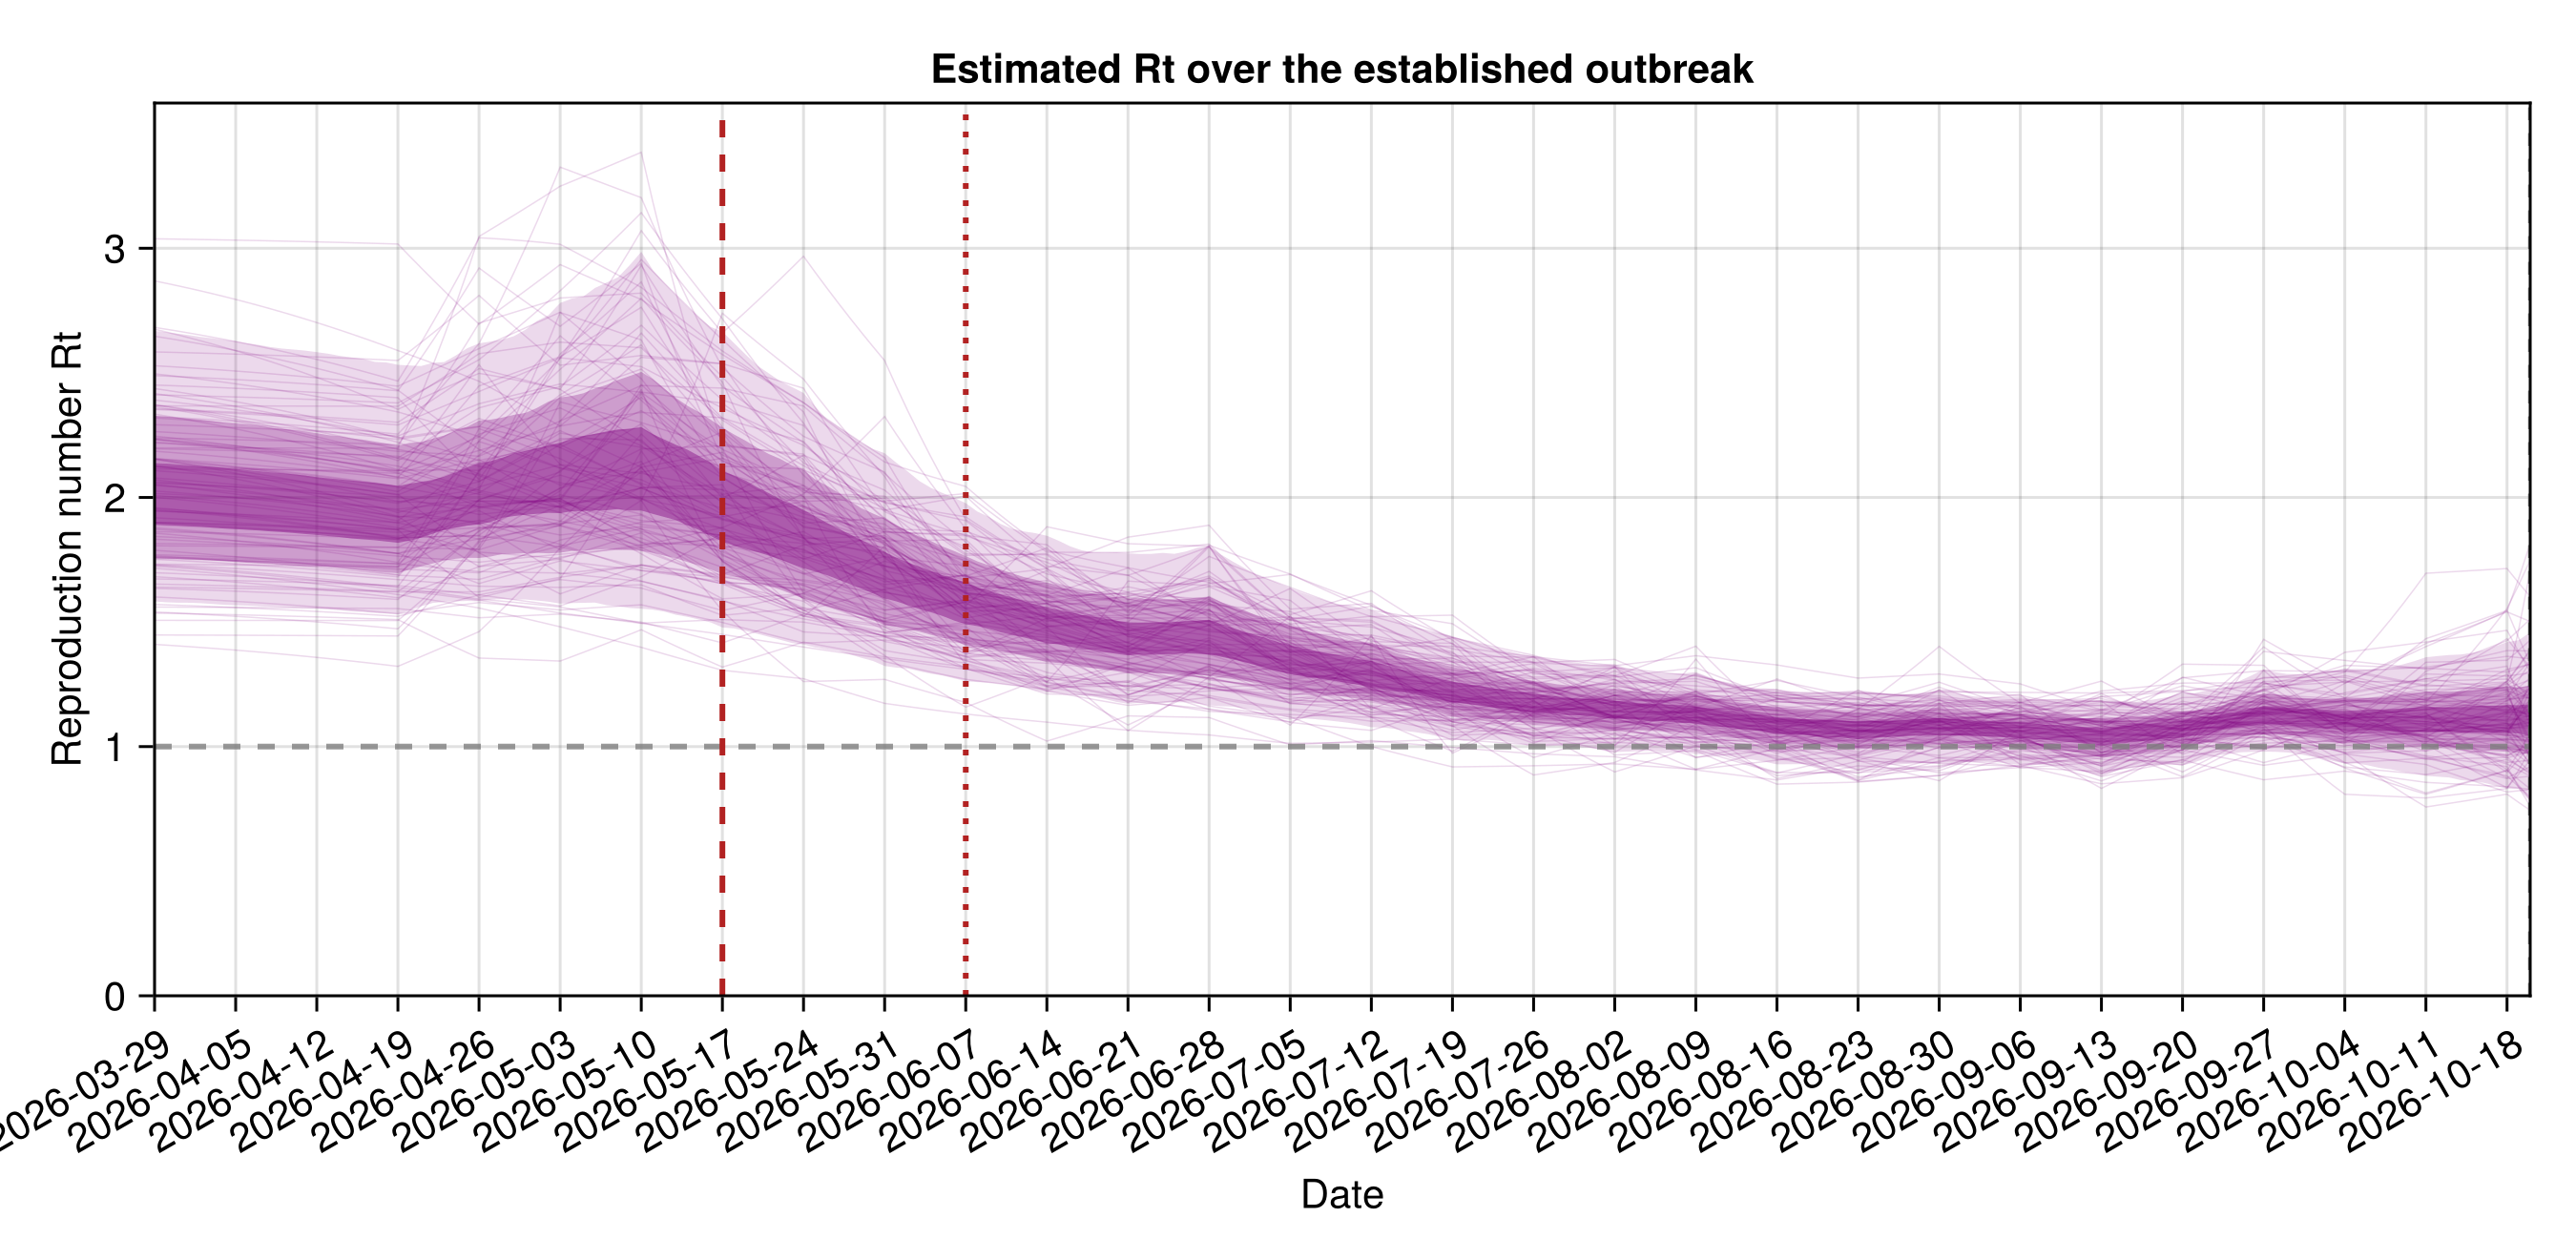
Reproduction number: the initial reproduction number is estimated to have been 30% 1.95–2.21, 60% 1.8–2.43, 90% 1.62–2.8 and the latest to be 30% 1.01–1.15, 60% 0.93–1.26, 90% 0.78–1.49.
Case-fatality ratio: the case-fatality ratio is estimated to be 30% 0.46–0.52, 60% 0.43–0.55, 90% 0.38–0.6.
Shift from priors: how far the data has moved each estimate from its prior, in prior interquartile ranges, where a value of one means the posterior median sits one prior interquartile range from the prior median, zero means unchanged, and the sign gives the direction. The fit moves the cumulative infection count by -0.07, the outbreak age by -1.14 and the doubling time by 0.59; the largest move is in the outbreak age.
| Quantity | Lower 90% | Lower 60% | Lower 30% | Upper 30% | Upper 60% | Upper 90% |
|---|---|---|---|---|---|---|
| Cumulative infections | 14896 | 17752 | 19852 | 23821 | 26643 | 32793 |
| Outbreak age (days) | 206 | 211 | 214 | 221 | 225 | 234 |
| Quantity | Lower 90% | Lower 60% | Lower 30% | Upper 30% | Upper 60% | Upper 90% |
|---|---|---|---|---|---|---|
| Initial reproduction number | 1.62 | 1.8 | 1.95 | 2.21 | 2.43 | 2.8 |
| Latest reproduction number | 0.78 | 0.93 | 1.01 | 1.15 | 1.26 | 1.49 |
| Latest growth rate (per day) | -0.02 | 0 | 0 | 0.01 | 0.02 | 0.03 |
| Latest doubling time (days) | -40.72 | -141.06 | 688.73 | 65.86 | 39.3 | 22.22 |
| Case-fatality ratio | 0.38 | 0.43 | 0.46 | 0.52 | 0.55 | 0.6 |
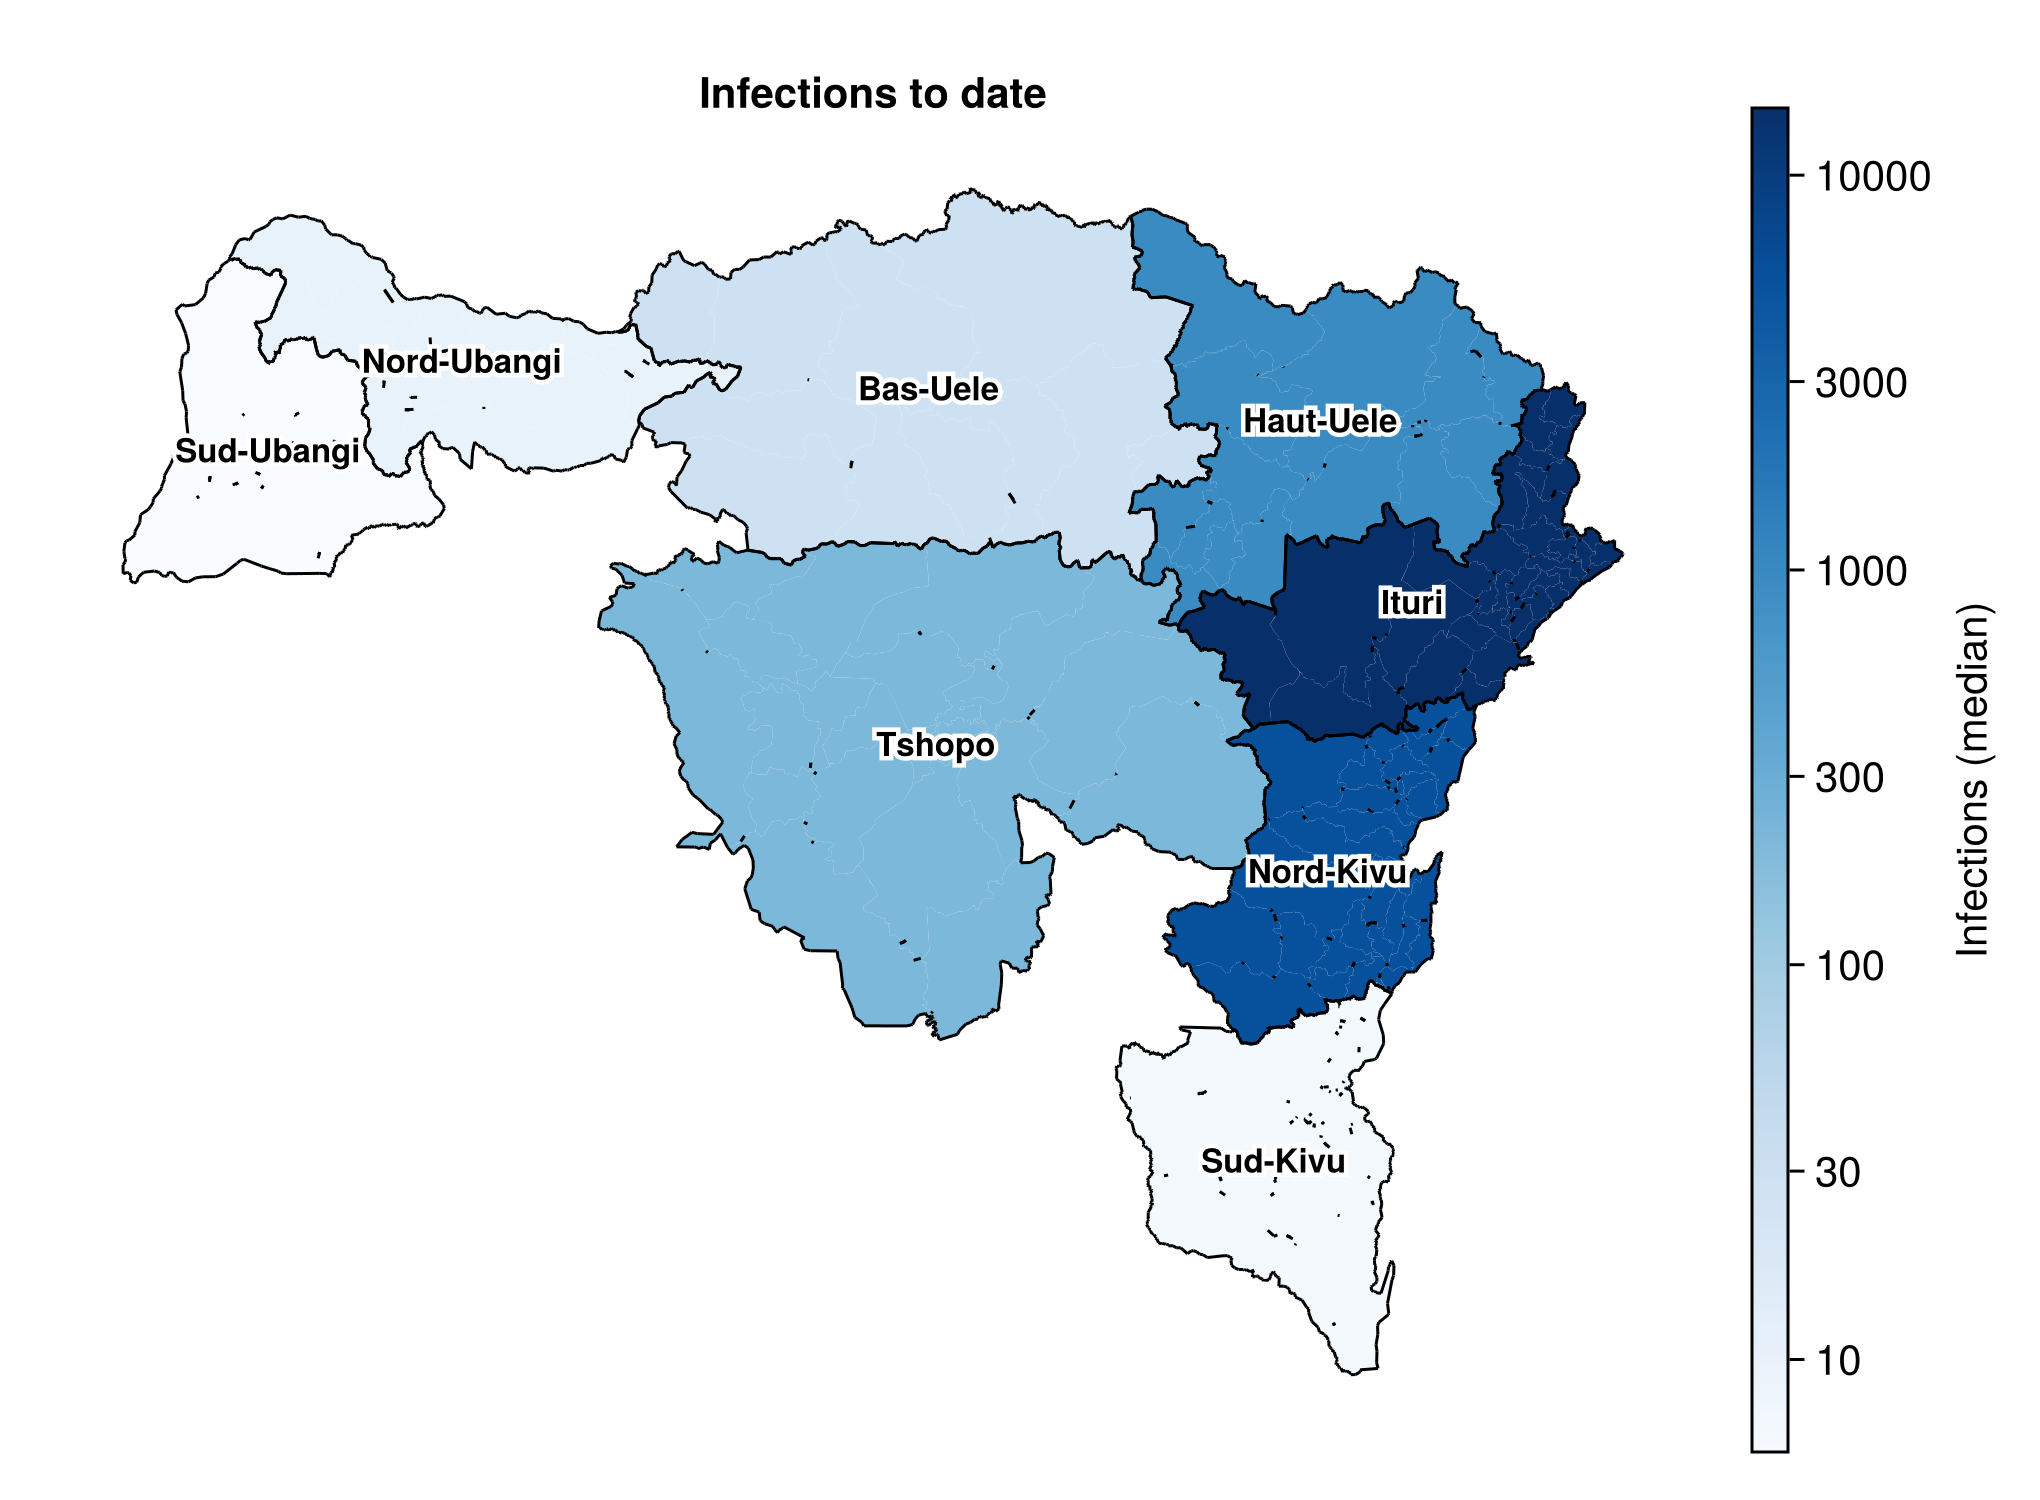
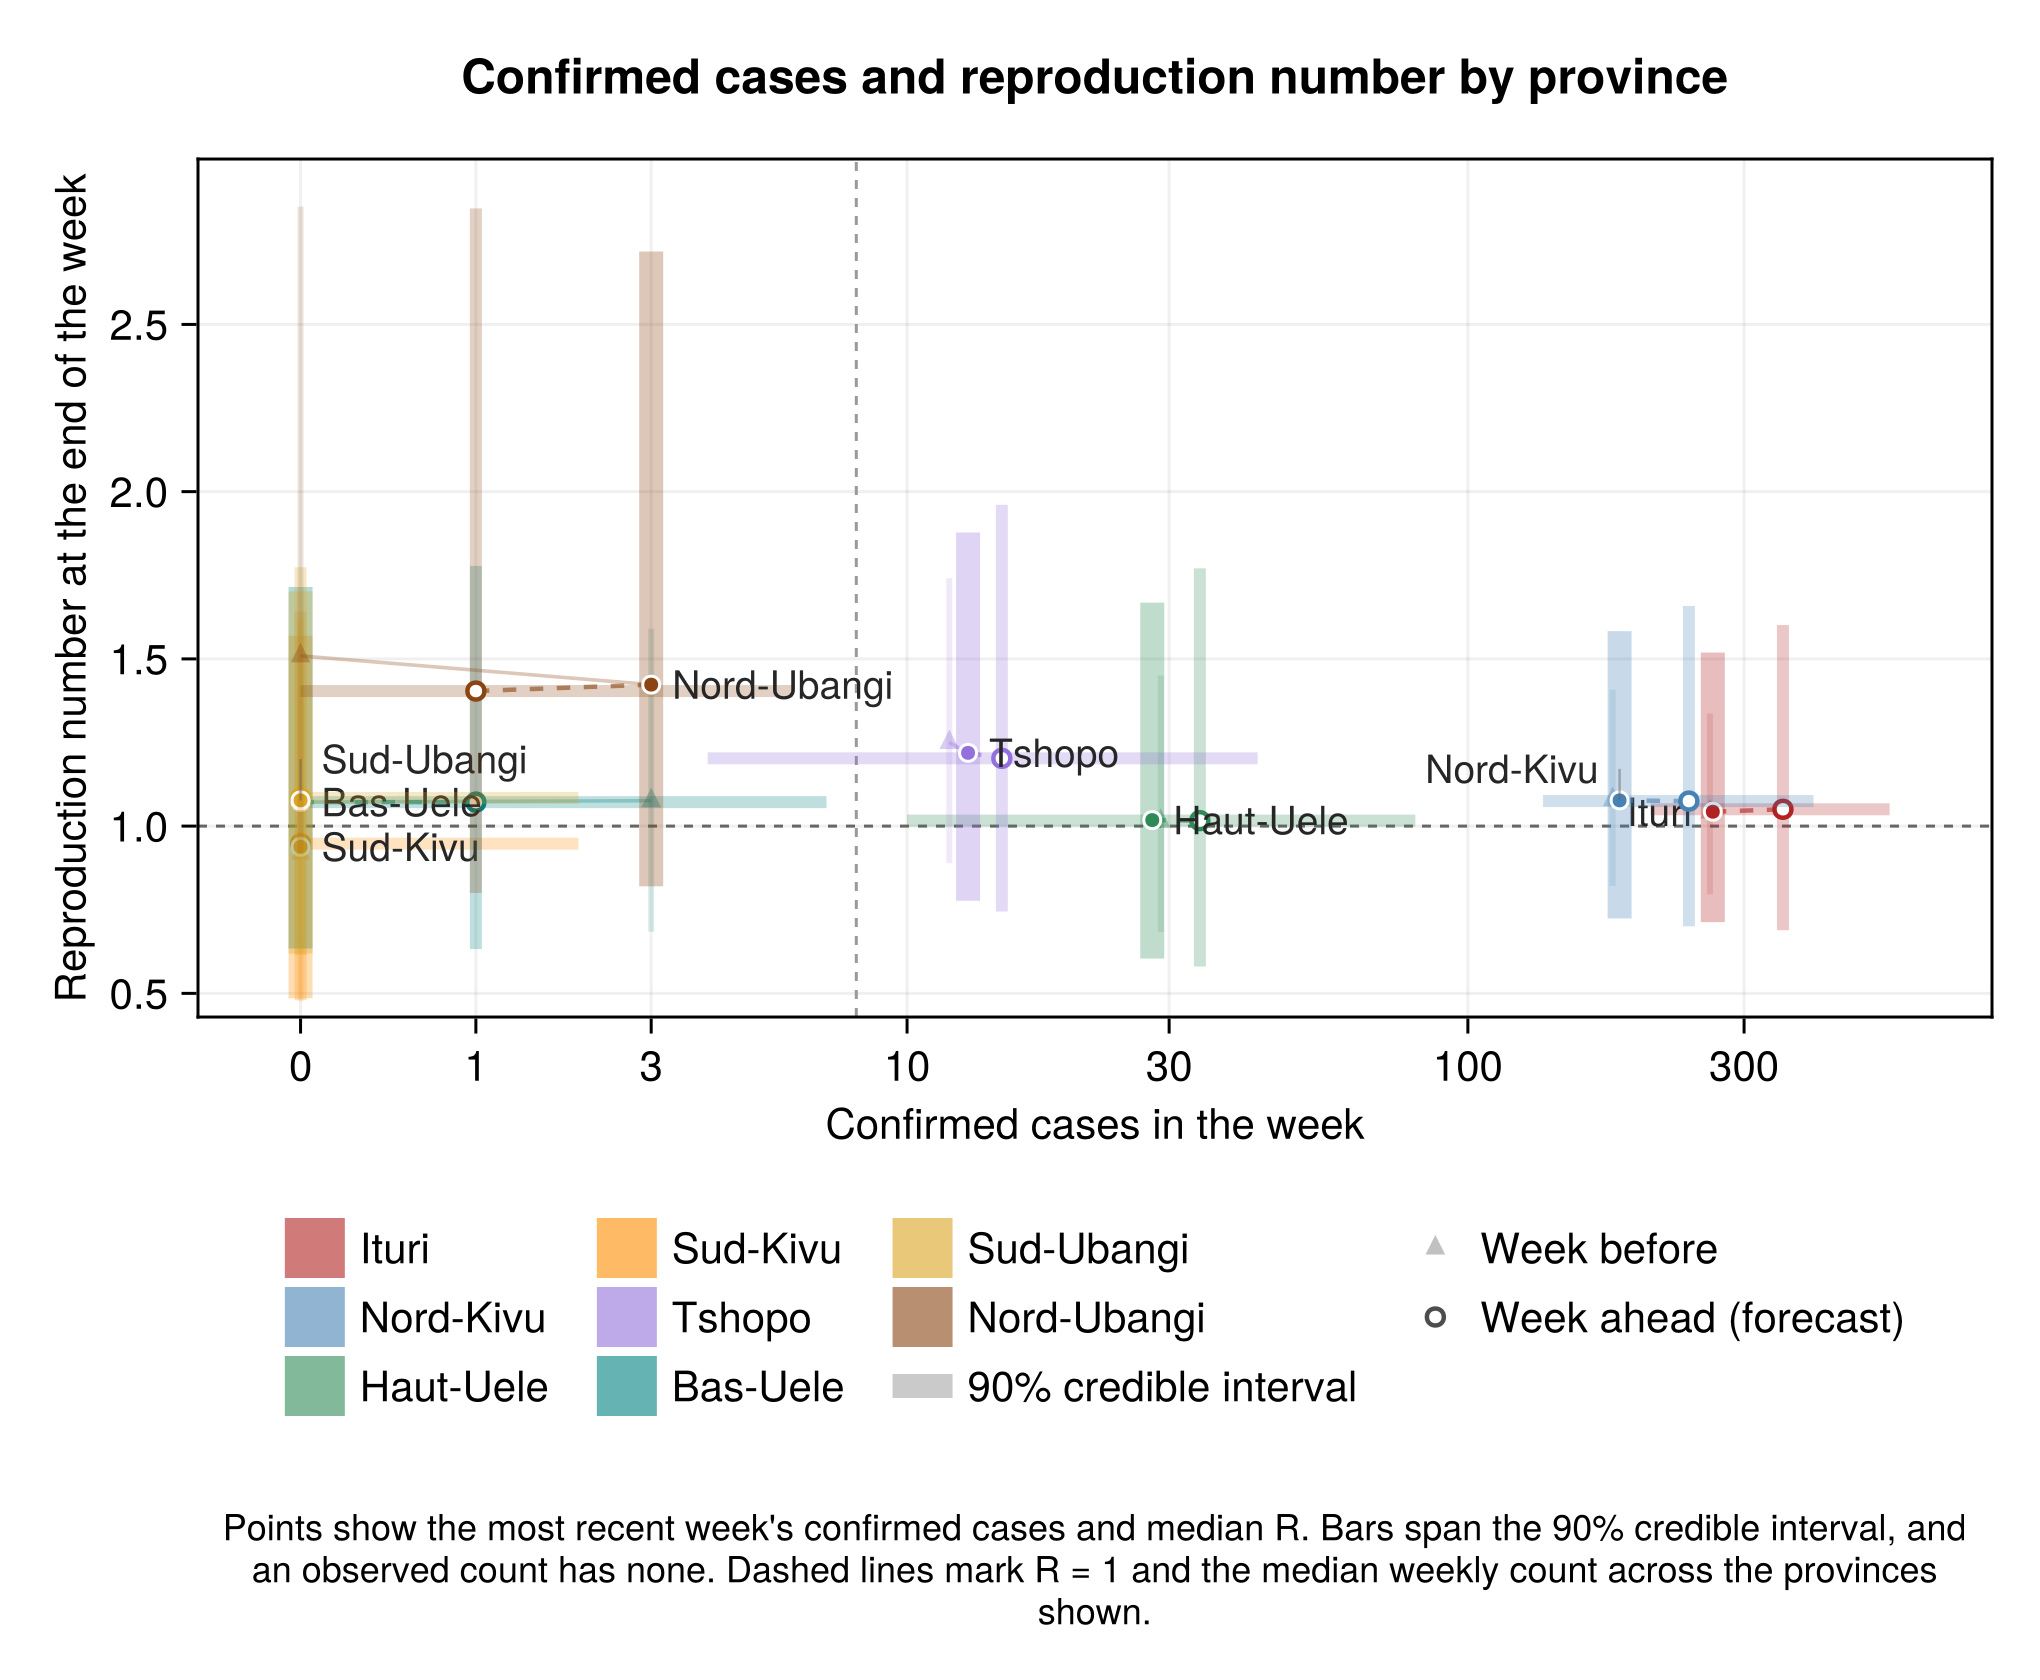
By province
| Province | Infections to date | R at the cut-off | Confirmed cases, latest week |
|---|---|---|---|
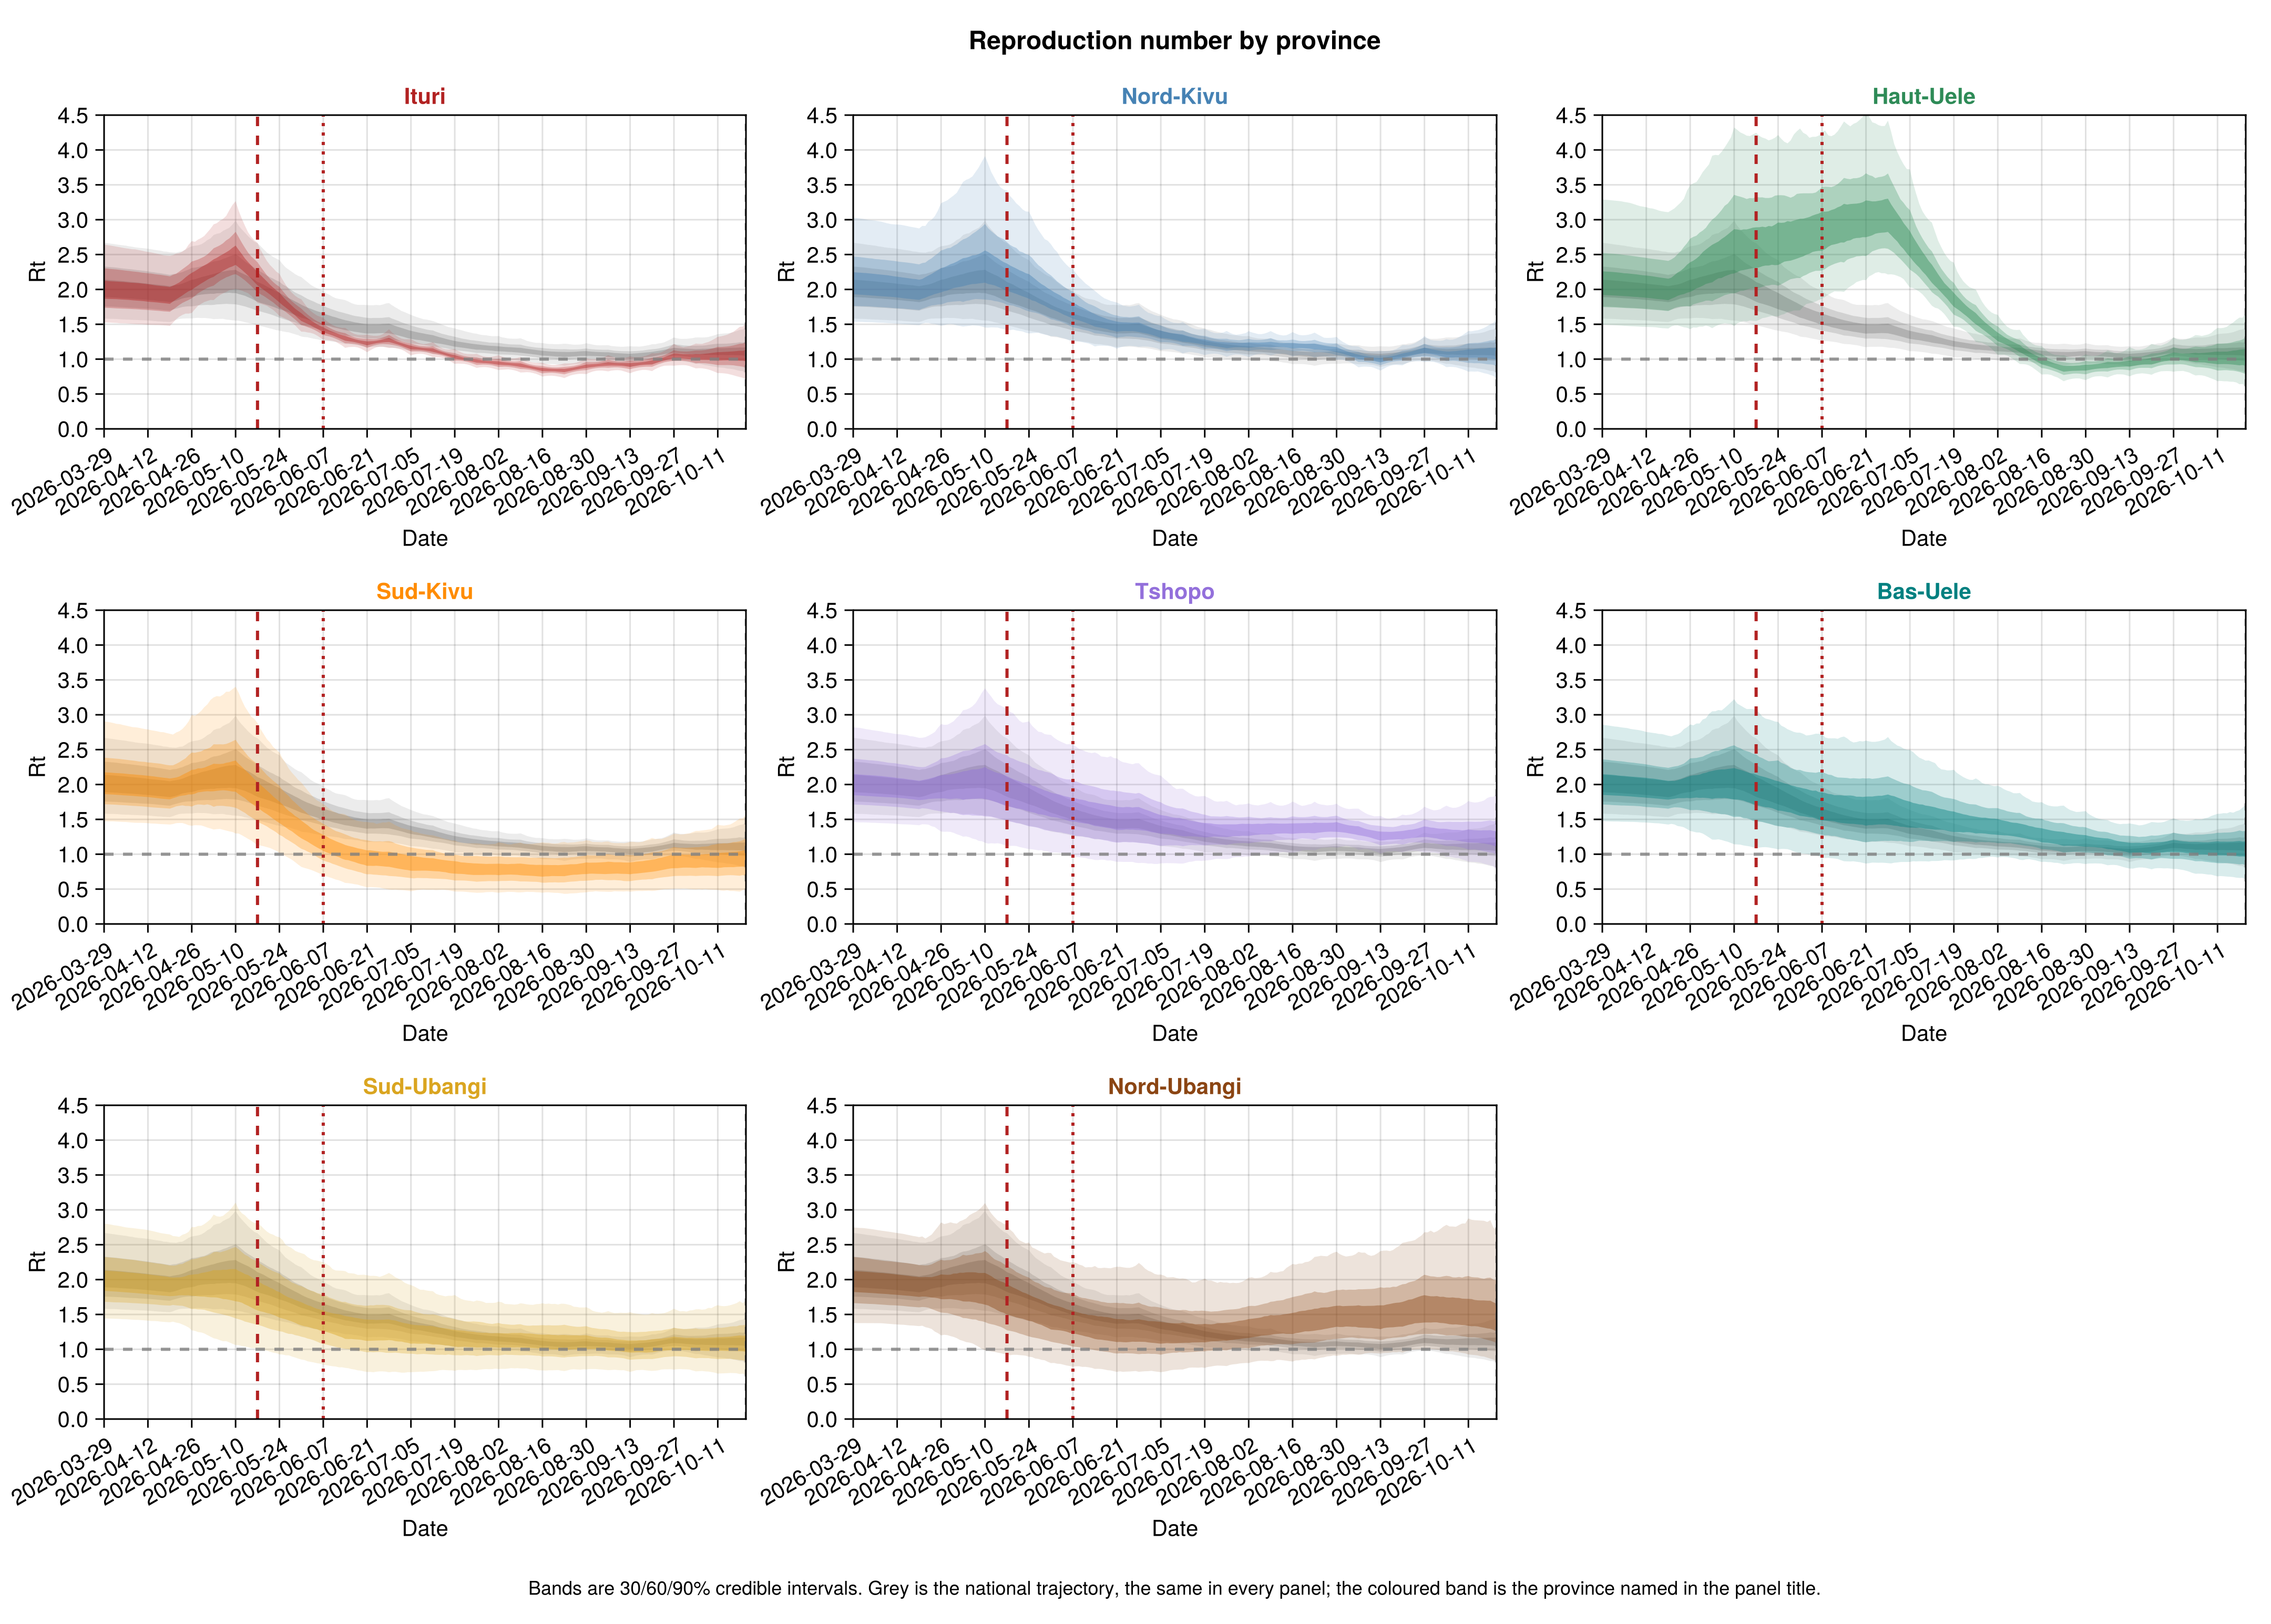
| Ituri | 10008–22365 | 0.71–1.52 | 265 |
| Nord-Kivu | 3697–8606 | 0.72–1.58 | 183 |
| Haut-Uele | 627–1498 | 0.6–1.67 | 28 |
| Sud-Kivu | 2–16 | 0.49–1.57 | 0 |
| Tshopo | 129–353 | 0.78–1.88 | 13 |
| Bas-Uele | 16–57 | 0.63–1.71 | 0 |
| Sud-Ubangi | 2–15 | 0.62–1.7 | 0 |
| Nord-Ubangi | 4–34 | 0.82–2.72 | 3 |
By health zone
| Zone | Province | Cases, past two weeks | Cases to date | Share of province infections (%) | R at the cut-off | P(R > 1) | Confirmed cases, next week | R modelled separately |
|---|---|---|---|---|---|---|---|---|
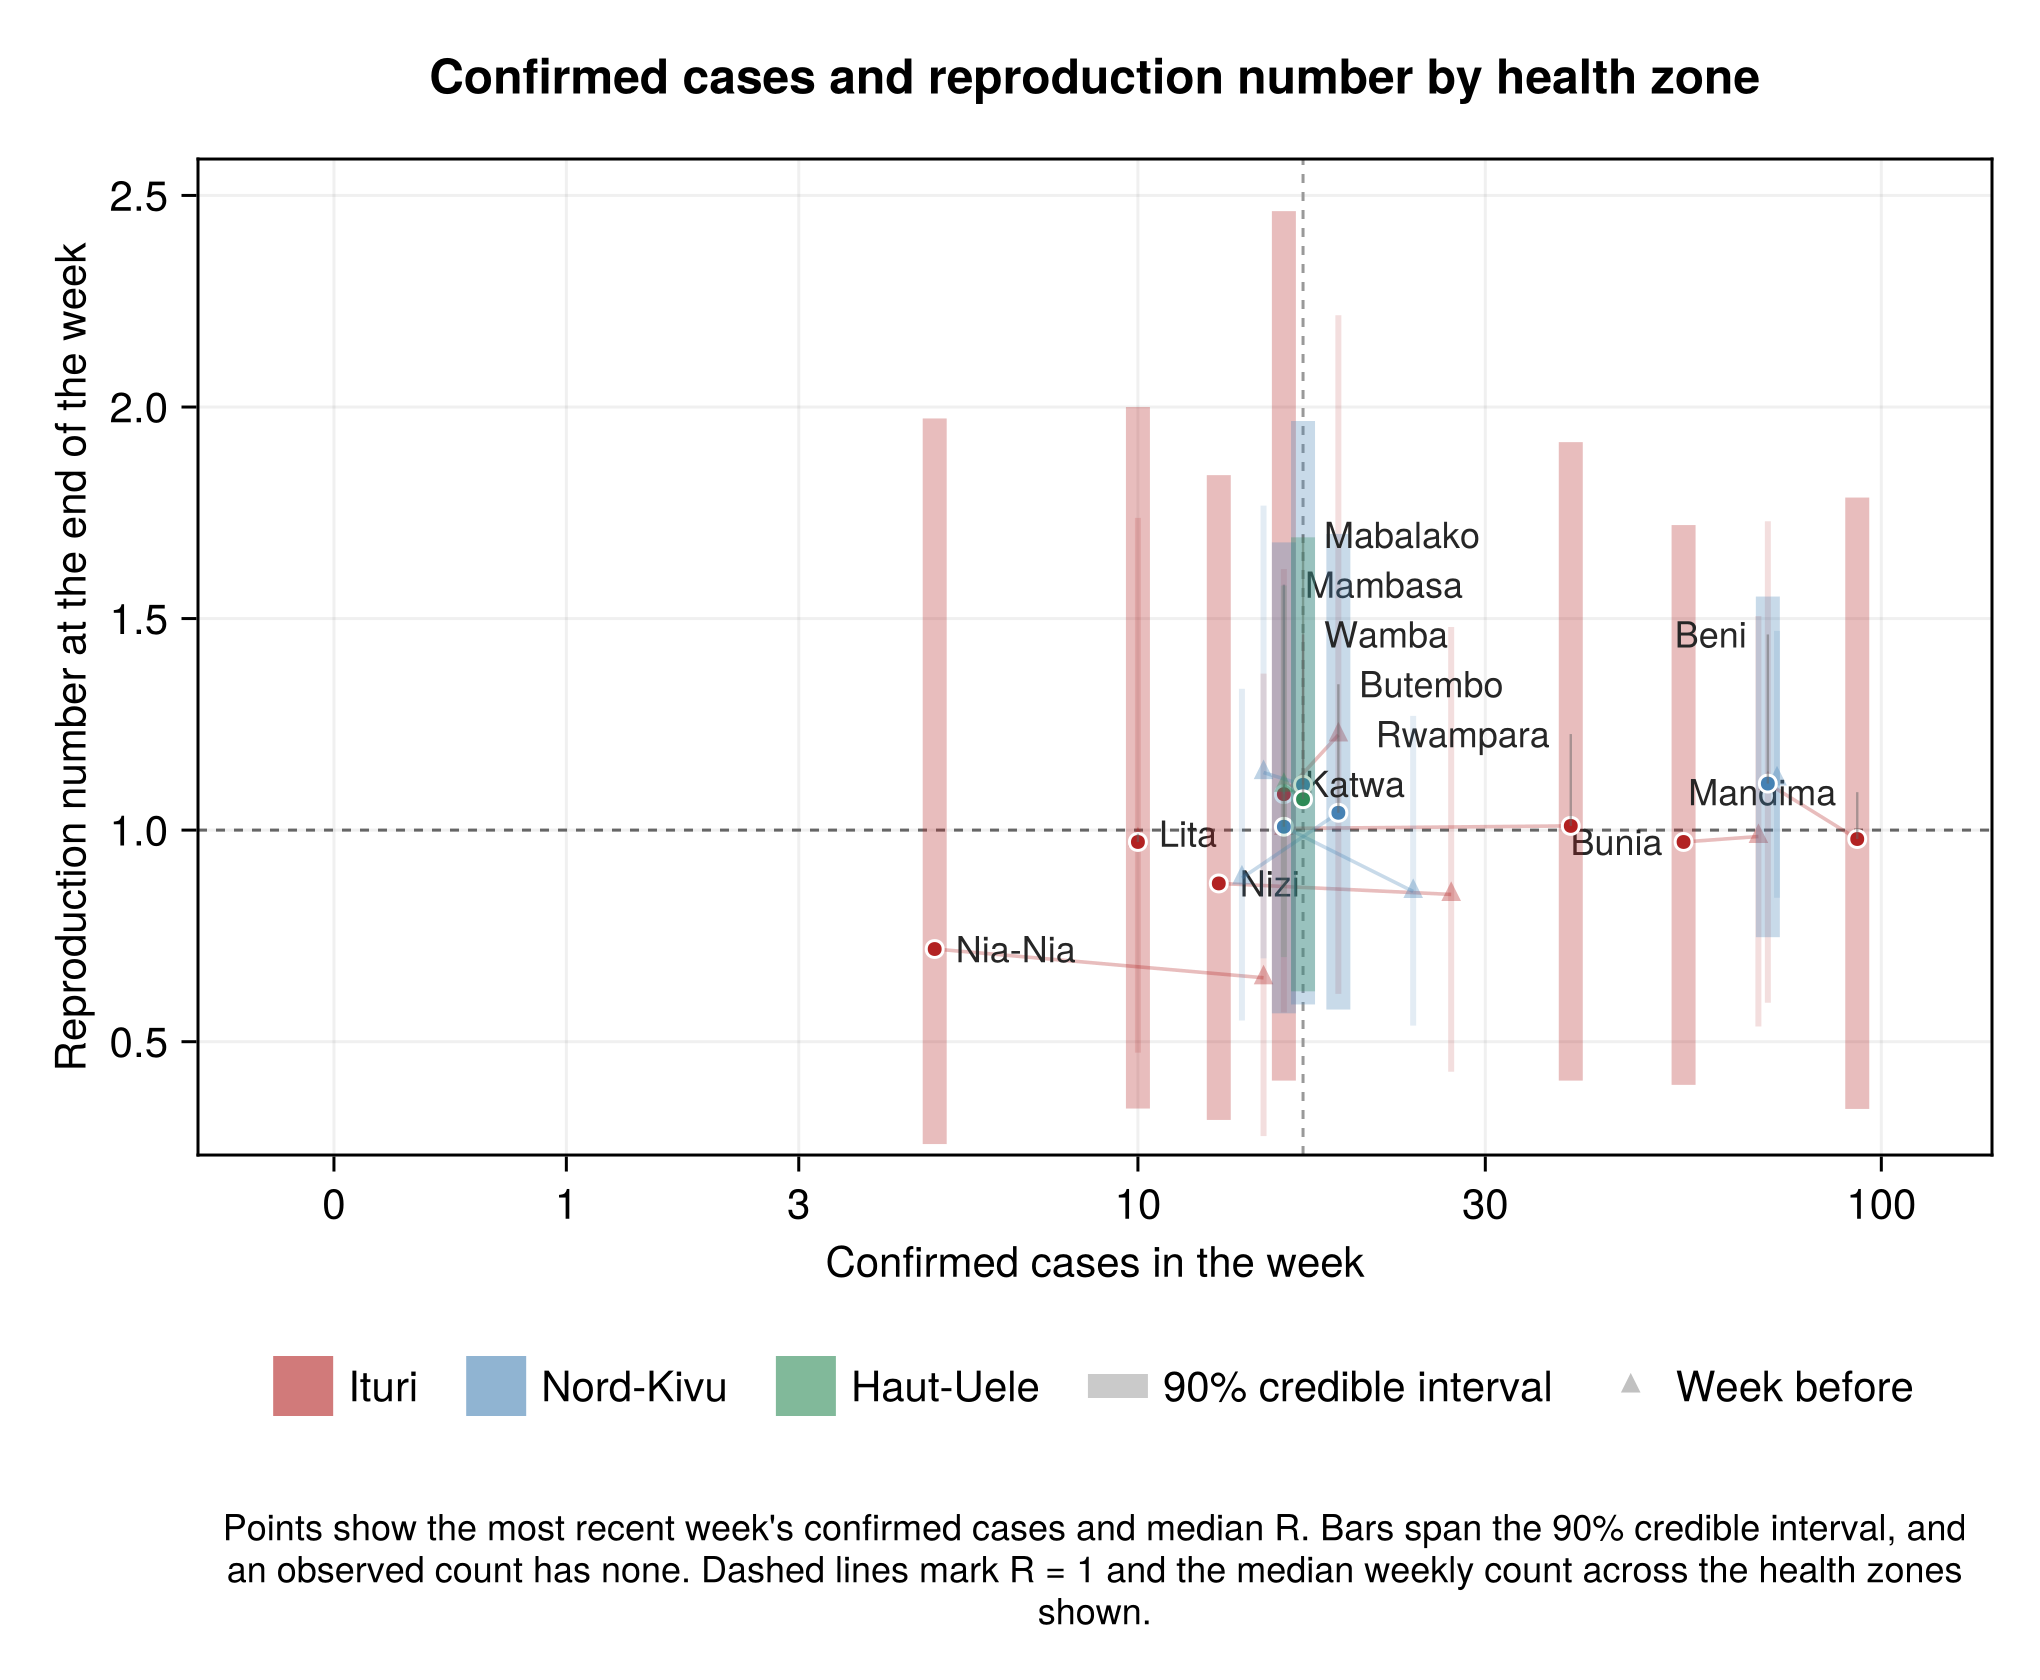
| Mandima | Ituri | 164 | 362 | 8–65 | 0.34–1.79 | 49% | 47–210 | yes |
| Beni | Nord-Kivu | 144 | 553 | 30–65 | 0.75–1.55 | 67% | 51–197 | yes |
| Bunia | Ituri | 124 | 1914 | 6–38 | 0.4–1.72 | 47% | 27–146 | yes |
| Rwampara | Ituri | 55 | 1173 | 3–21 | 0.41–1.92 | 51% | 9–95 | yes |
| Nizi | Ituri | 40 | 832 | 1–12 | 0.31–1.84 | 38% | 1–58 | yes |
| Katwa | Nord-Kivu | 40 | 648 | 4–17 | 0.57–1.68 | 51% | 5–57 | yes |
| Mambasa | Ituri | 35 | 76 | 2–24 | 0.41–2.46 | 56% | 2–67 | yes |
| Butembo | Nord-Kivu | 33 | 319 | 3–12 | 0.58–1.7 | 54% | 2–43 | yes |
| Wamba | Haut-Uele | 33 | 152 | 22–63 | 0.62–1.69 | 58% | 3–39 | yes |
| Mabalako | Nord-Kivu | 32 | 83 | 3–20 | 0.59–1.97 | 61% | 4–60 | yes |
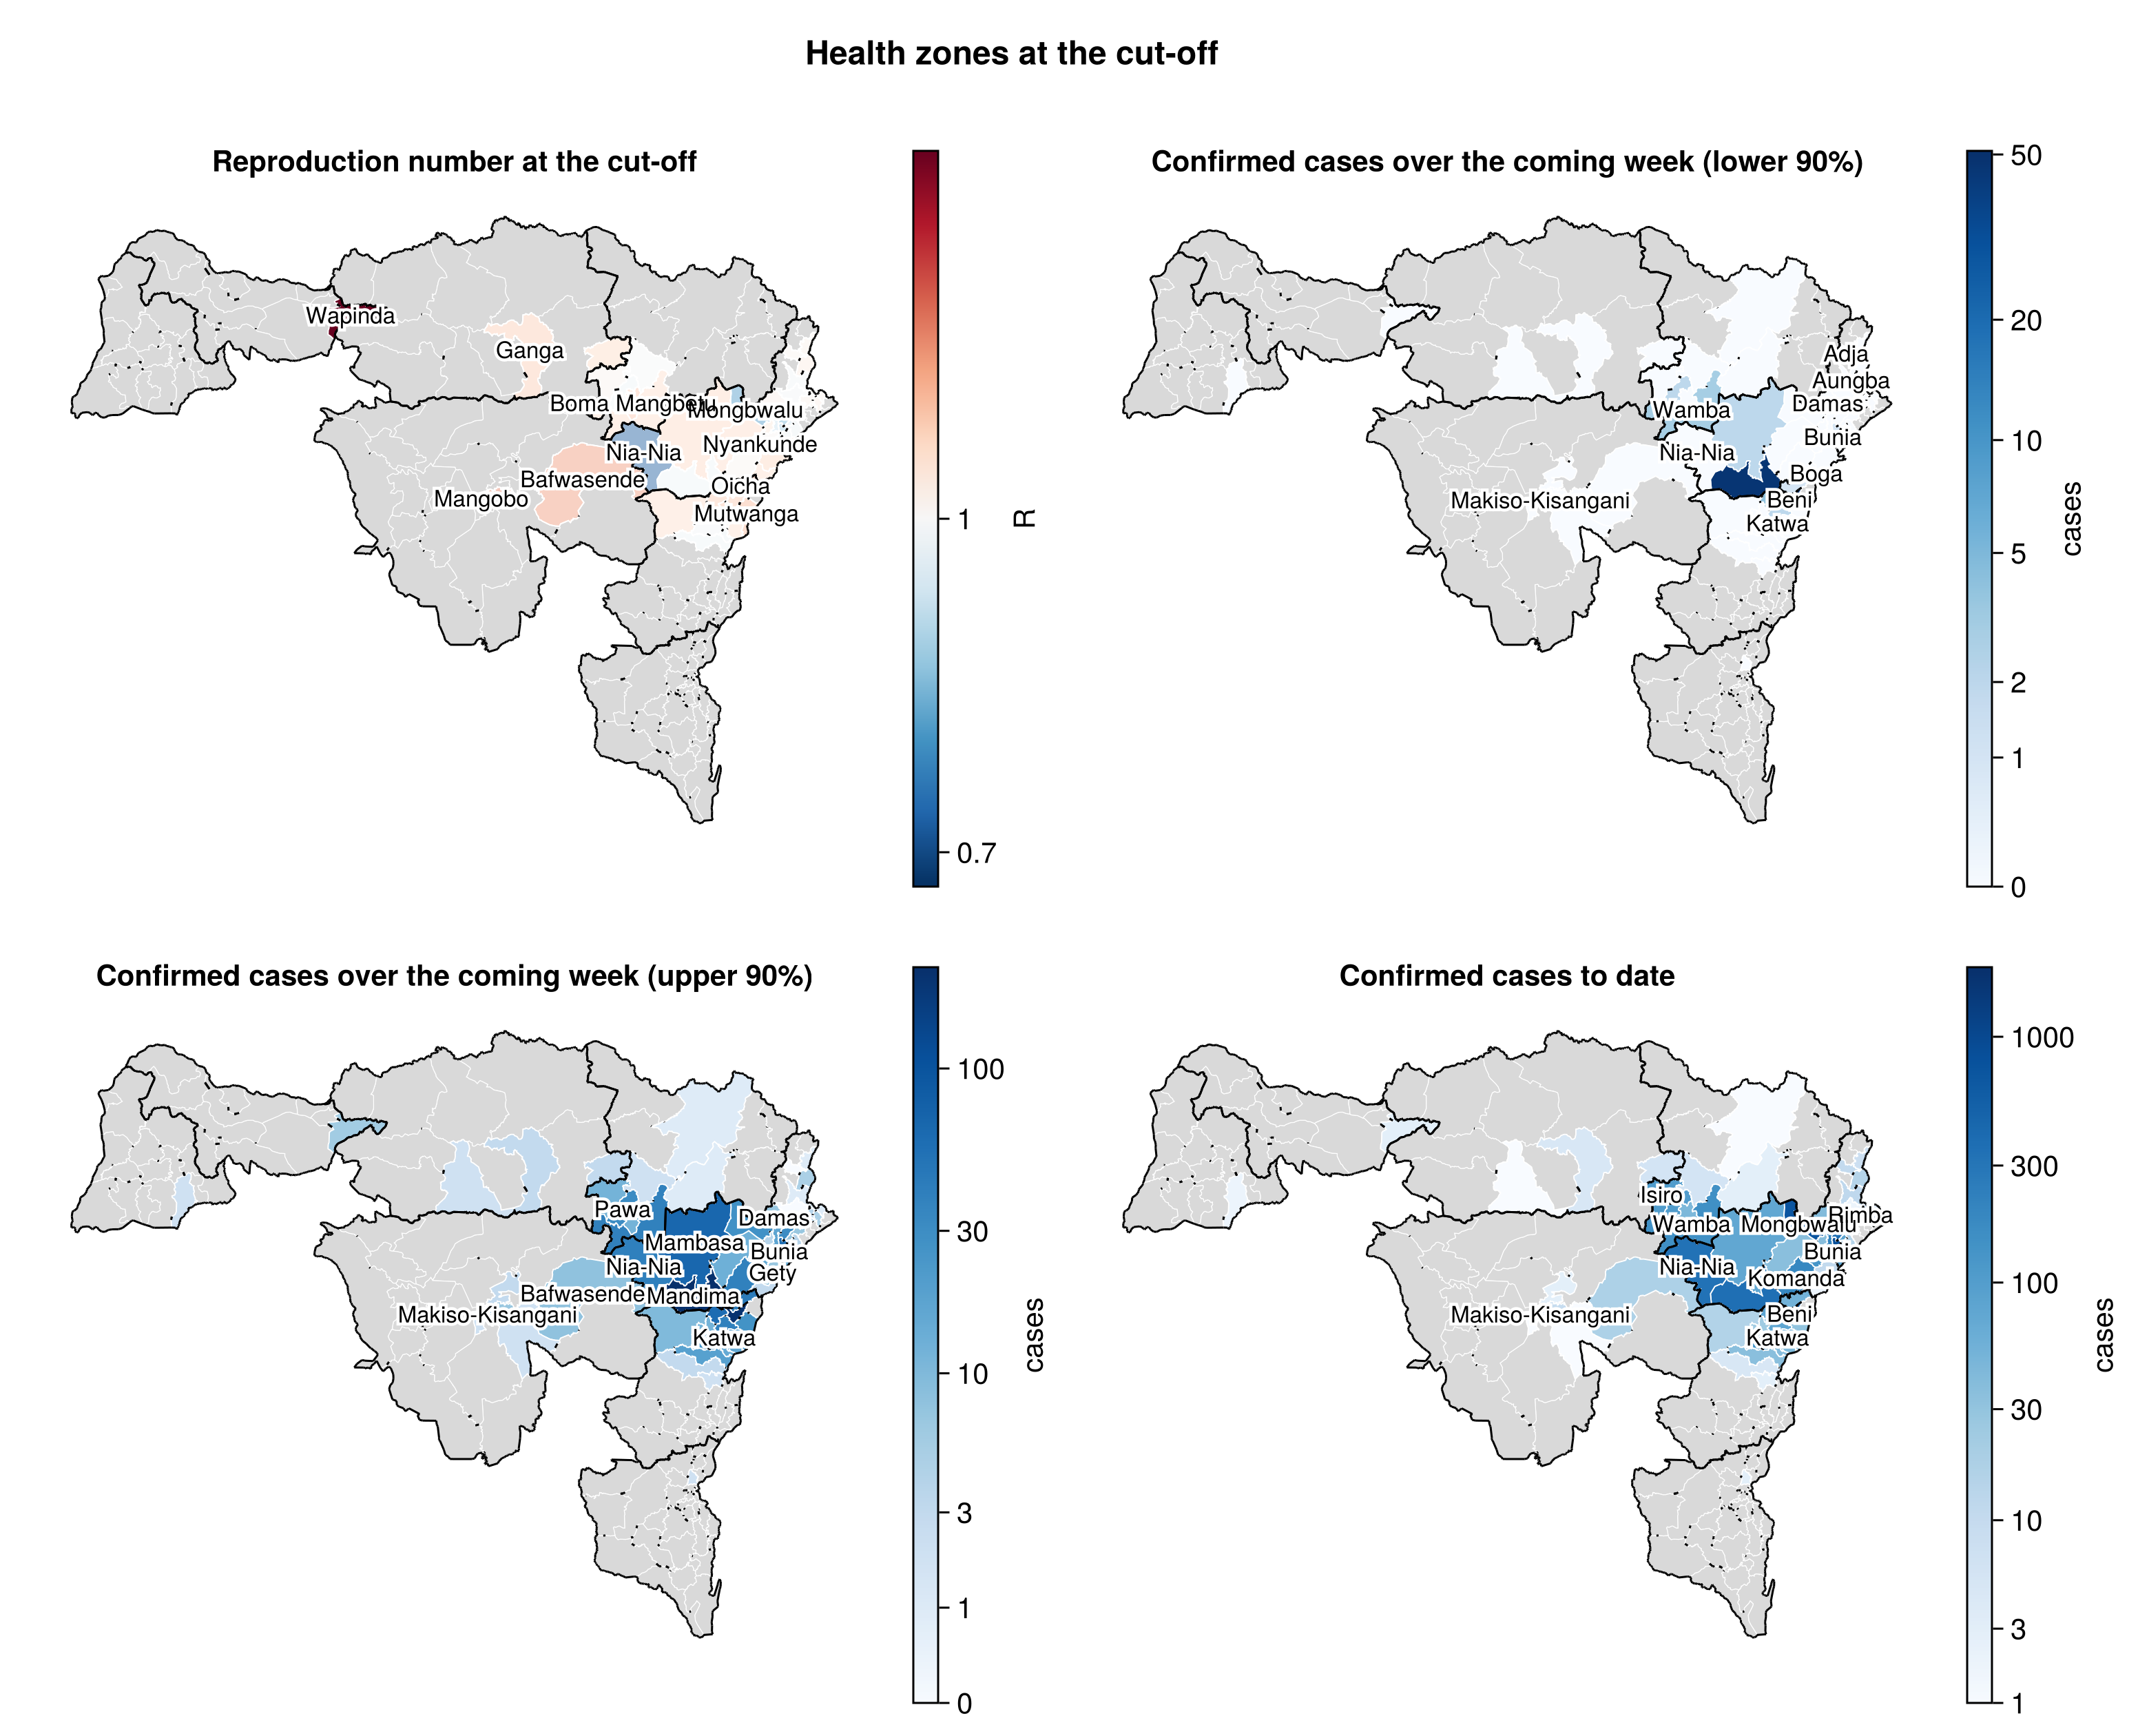
44 of 65 zones had a confirmed case over the past two weeks.
Health-zone forecast
Projected counts are for the week to 2026-10-27.
Most new confirmed cases: Mandima about 111 (90% credible interval 47 to 210); Beni about 105 (90% credible interval 51 to 197); Bunia about 70 (90% credible interval 27 to 146).
Chance of a case: 34 of 65 zones have at least an even chance of reporting a confirmed case, and 14 of reporting at least ten.
Quiet zones: 21 zones have had no case allocated over the past two weeks. Viadana is the most likely of them to report one, at 44%.
Fit diagnostics
The joint fit passes the convergence checks with warnings.
Expand: how the fits behind these numbers sampled
Its worst R-hat is 1.03 and its lowest bulk effective sample size is 60, with 1 divergent transitions in 2000 draws. A fit passes without warnings when its worst R-hat is at most 1.05, its effective sample sizes are at least 100 and at most 1% of its draws diverge.
Across all 12 fits the worst R-hat is 2.19, in the deaths (DRC) fit. The lowest bulk effective sample size is 6, in the deaths (DRC) fit, and the lowest tail effective sample size is 18, in the delay sensitivity fit. Only the joint fit is held to the thresholds above.
| fit | max_rhat | min_ess_bulk | min_ess_tail | divergences |
|---|---|---|---|---|
| joint | 1.032 | 60 | 60 | 1 |
| joint, no patches | 1.009 | 252 | 392 | 0 |
| exports | 1.042 | 43 | 40 | 7 |
| deaths (DRC) | 2.186 | 6 | 20 | 888 |
| cases (DRC) | 1.018 | 106 | 127 | 12 |
| confirmed (DRC) | 1.013 | 98 | 282 | 8 |
| confirmed deaths (DRC) | 1.009 | 214 | 402 | 9 |
| isolation (DRC) | 1.027 | 56 | 29 | 4 |
| onsets (DRC) | 1.062 | 35 | 35 | 0 |
| frozen (1wk back) | 1.12 | 16 | 39 | 1 |
| delay sensitivity | 1.107 | 18 | 18 | 5 |
| clock sensitivity (ExpGrowth) | 1.016 | 75 | 115 | 1 |
Reproduction number trajectory
Infections over time