Summary dashboard
Last updated: 30 September 2026.
Data as of: 26 September 2026.
An outbreak of Ebola disease caused by Bundibugyo virus (BVD) is ongoing in the Democratic Republic of the Congo (DRC), with cases also detected across the border in Uganda. This is a real-time joint Bayesian estimate of the current size of that outbreak, refreshed as new data arrive. Most infections are not yet reported, so the current size has to be inferred from the surveillance data that are available. The model is a discrete-time renewal process on a daily grid, a meta-population over four provincial patches coupled by importation. It fits in a single posterior the daily counts the INSP situation reports publish, including the suspected and confirmed case and death series as well as the laboratory, isolation, treatment-centre and recovery records. We also digitise the epidemic curve by symptom-onset date as intermittently reported in the INSP situation reports and fit them using a model that accounts for time-varying ascertainment and reporting delays. Finally, we fit to data on initial exports of cases and deaths to Uganda, taken from the WHO situation reports and Disease Outbreak News. The same infection process generates all of them, staged to daily symptom onsets and routed into every observation stream. A second stage splits each patch across its health zones, fitted to the per-zone confirmed cases and deaths jointly as a composition within the patch. It conditions on the province fit's posterior weekly patch infections and does not feed back into it. A genetic bound on the time to the most recent common ancestor and priors from the McCabe et al. report complete the inputs. From these it estimates the infections and deaths to date, reported and unreported, the time-varying reproduction number with its growth rate and doubling time, the case-fatality ratio, and the ascertainment of each surveillance system. Every release projects each DRC stream a week ahead. The forecasts are scored with the continuous ranked probability score against the data that arrive later and against a persistence baseline. The aim is a transparent estimate of how far the outbreak has already grown, and of how much each published stream contributes to it.
This page summarises the headline results. See the in-sample checks for how the model fits the data and the forecast evaluation for how past forecasts scored, each with a province and a health-zone page alongside. See Methods for the model, Limitations for its caveats and Sensitivity for the sensitivity analyses.
Headline estimates
The detail is on the National estimates and National forecasts pages.
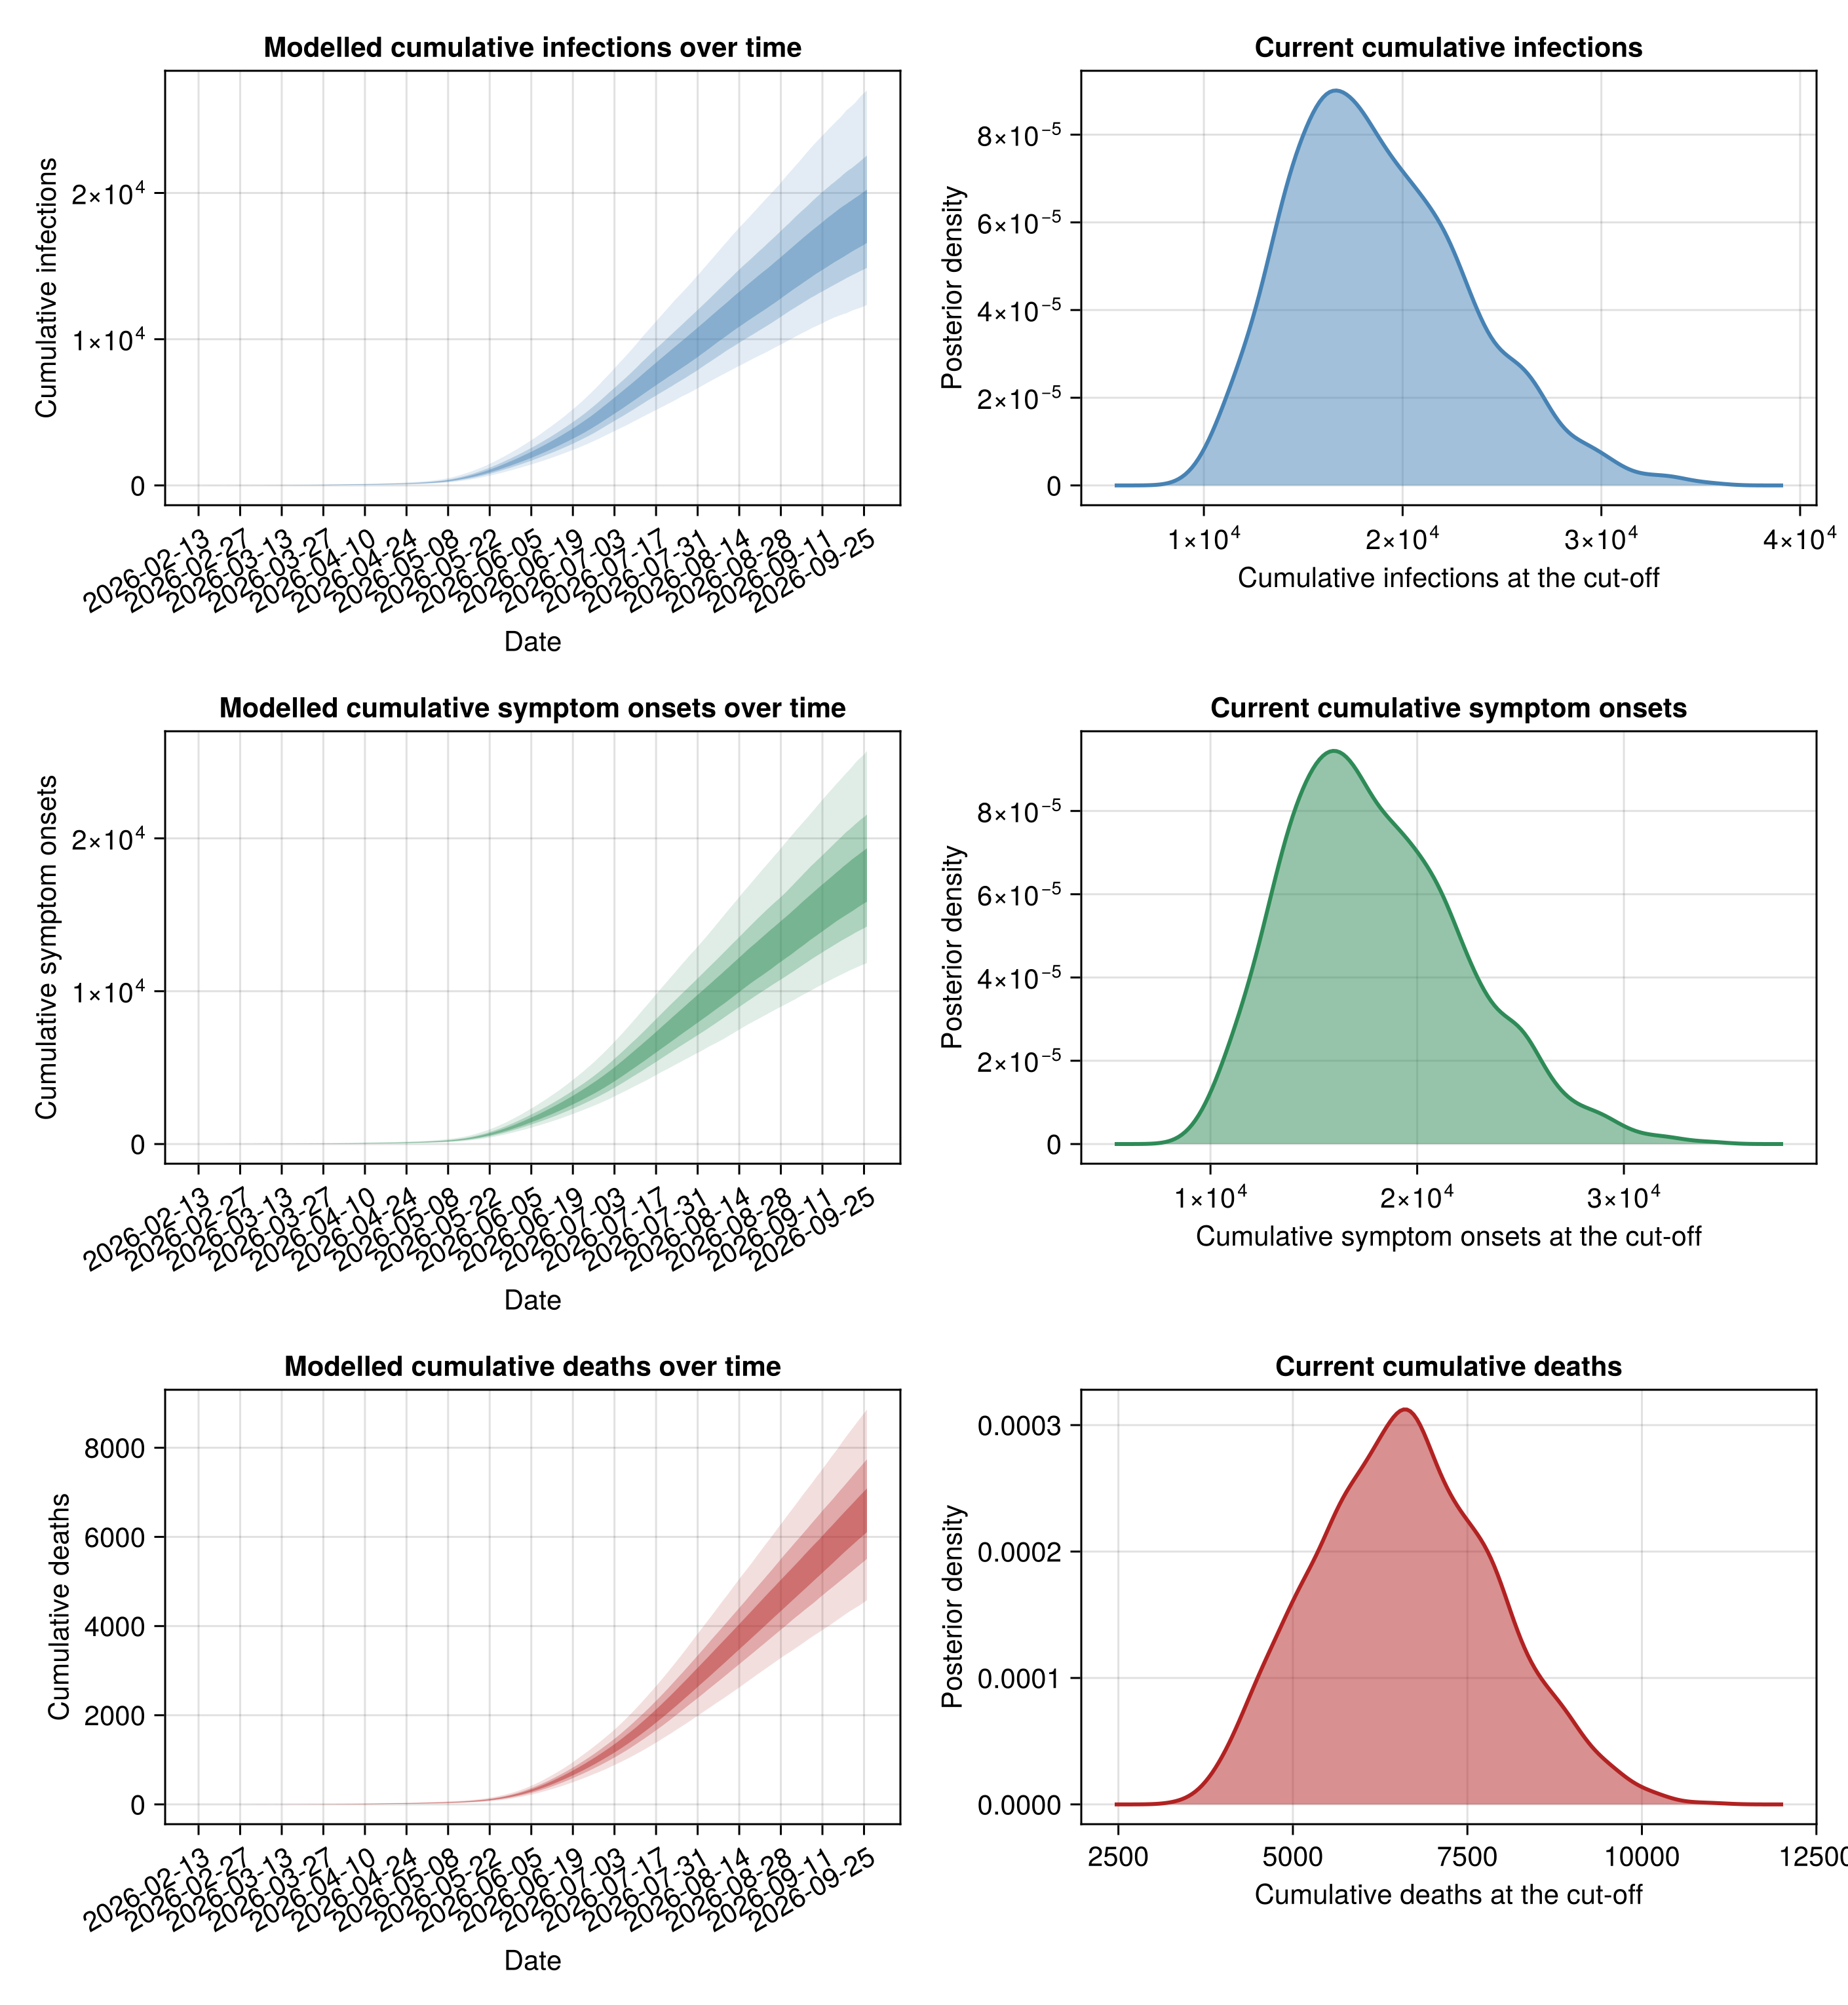
Cumulative infections: the outbreak is estimated to have caused 30% 16593–20232, 60% 14887–22555, 90% 12343–27006 infections to date, reported and unreported.
Against the 8067 laboratory-confirmed cases by the cut-off that is roughly 1.5–3.3× as many infections, so confirmed cases are estimated to capture only a small share of the outbreak.
Outbreak start and age: the outbreak is estimated to have begun on a start date of 30% 2026-03-13–2026-03-20, 60% 2026-03-09–2026-03-24, 90% 2026-02-28–2026-03-28, an elapsed age to the cut-off of 30% 190–197, 60% 186–201, 90% 182–210 days.
Growth rate and doubling time: the initial growth rate is estimated to have been 30% 0.049–0.061, 60% 0.043–0.07, 90% 0.034–0.086 per day, an initial doubling time of 30% 14.1–11.3, 60% 16.0–9.9, 90% 20.1–8.1 days. The latest growth rate is estimated to be 30% -0.015–-0.003, 60% -0.022–0.004, 90% -0.037–0.017 per day, a latest doubling time of 30% -46.6–-199.0, 60% -31.2–191.5, 90% -19.0–41.0 days.
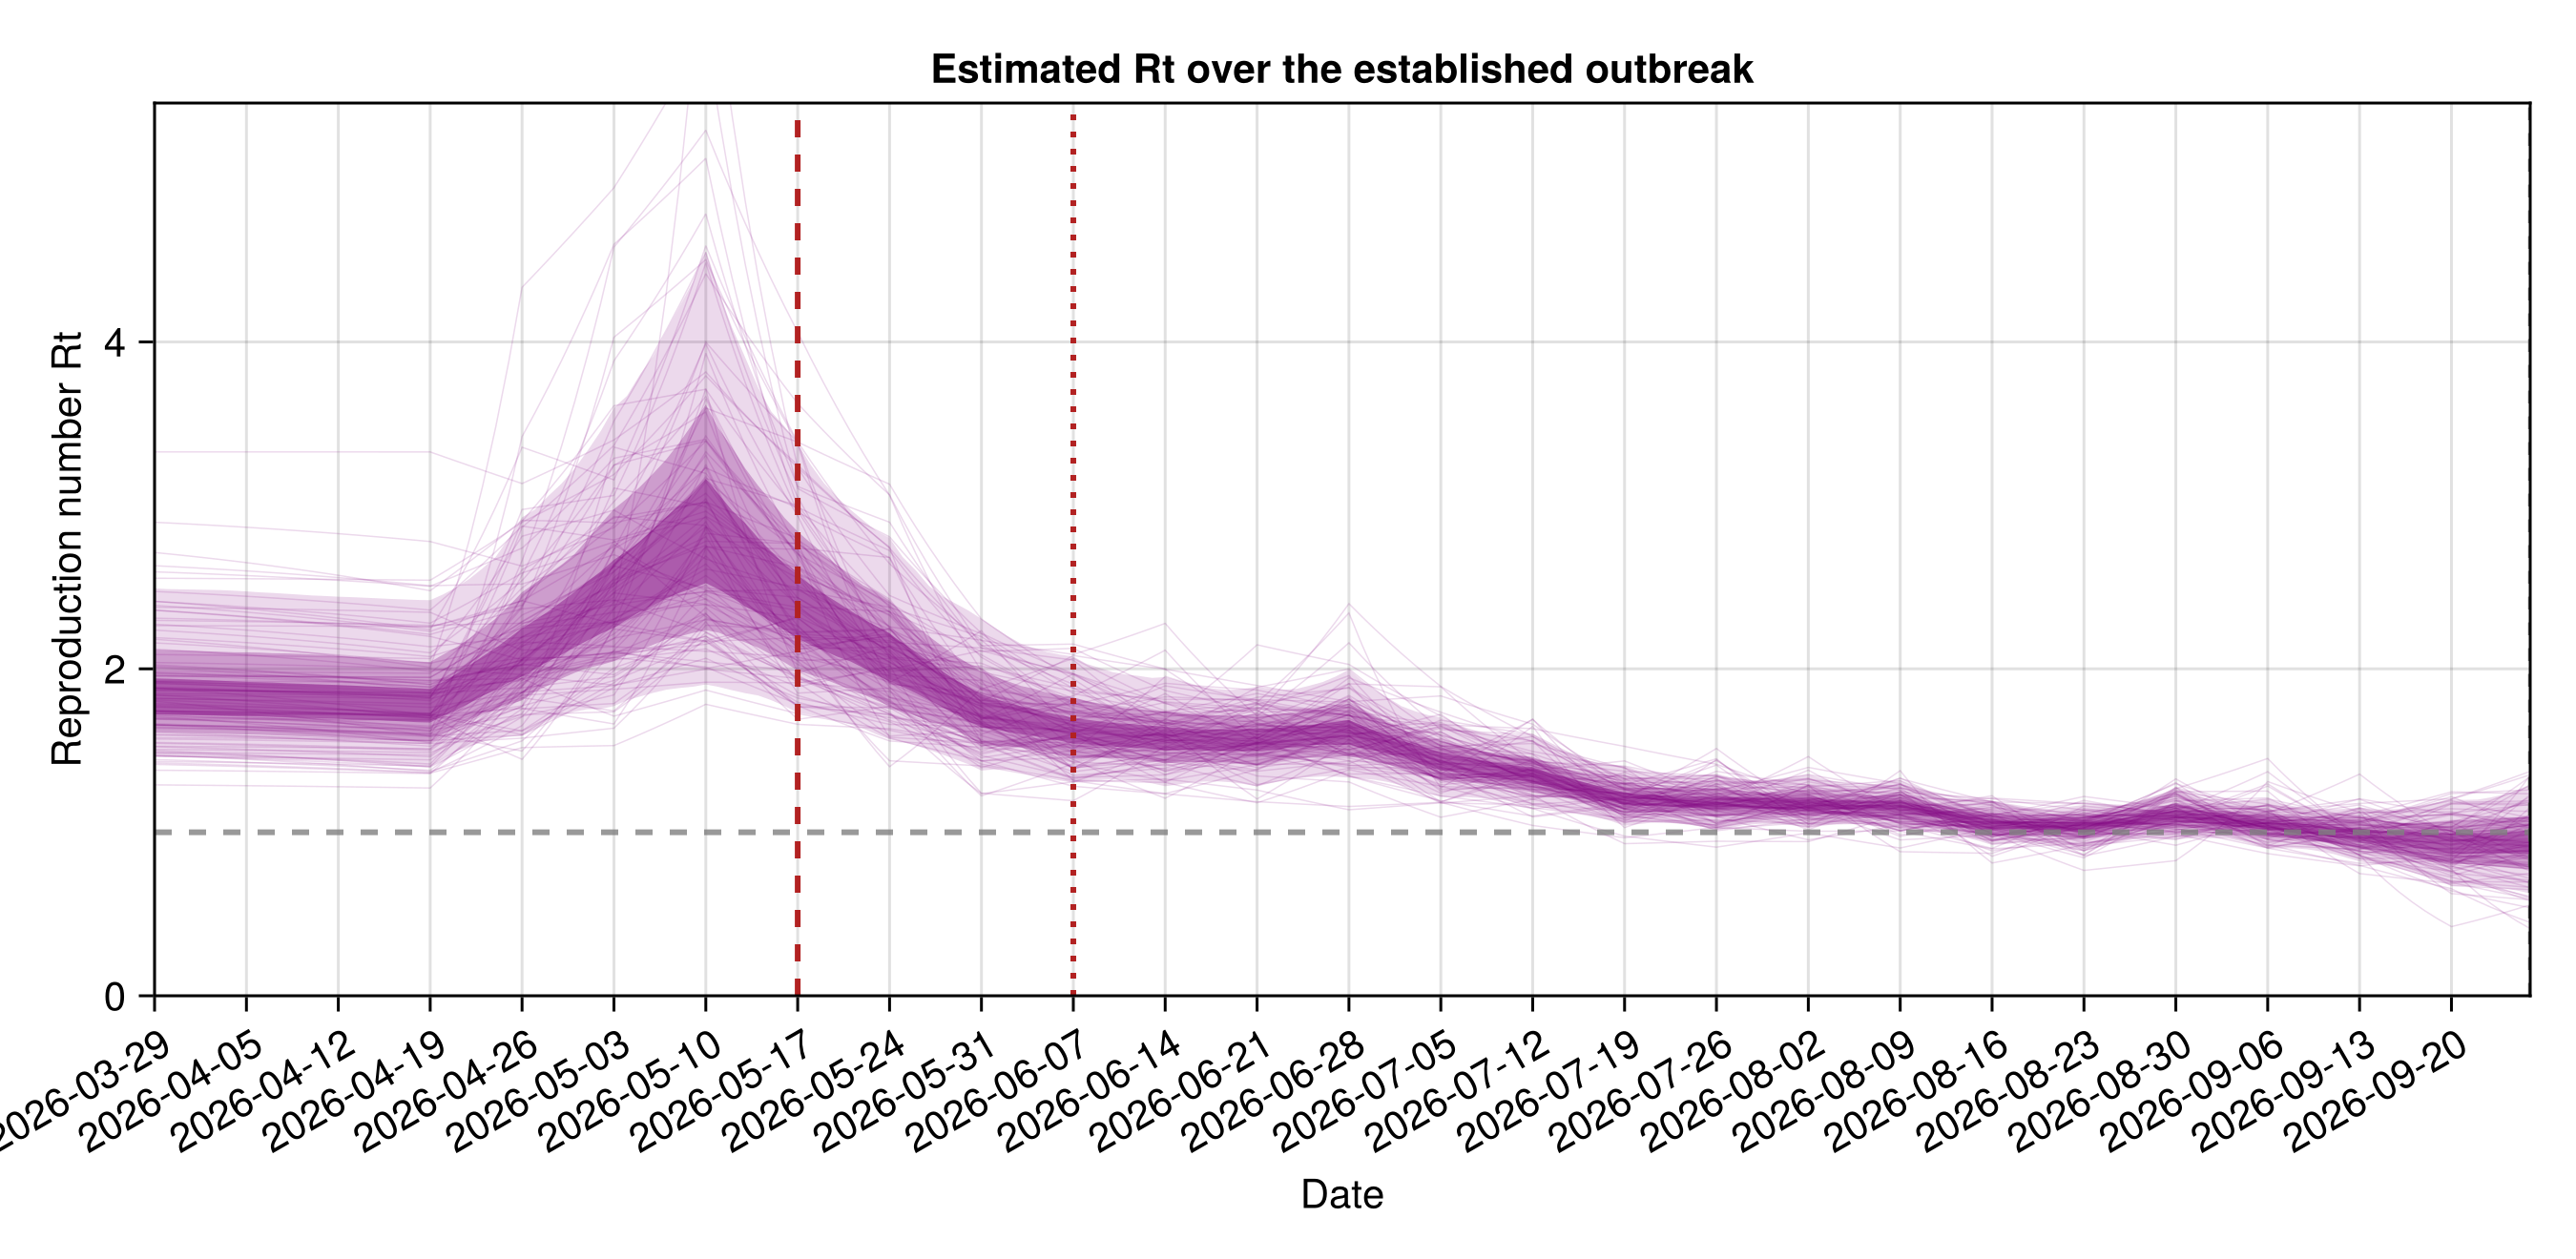
Reproduction number: the initial reproduction number is estimated to have been 30% 1.76–2.0, 60% 1.66–2.17, 90% 1.5–2.57 and the latest to be 30% 0.81–0.95, 60% 0.73–1.05, 90% 0.58–1.24.
Case-fatality ratio: the case-fatality ratio is estimated to be 30% 0.45–0.5, 60% 0.42–0.53, 90% 0.37–0.58.
Shift from priors: how far the data has moved each estimate from its prior, in prior interquartile ranges, where a value of one means the posterior median sits one prior interquartile range from the prior median, zero means unchanged, and the sign gives the direction. The fit moves the cumulative infection count by -0.06, the outbreak age by -1.25 and the doubling time by -1.19; the largest move is in the outbreak age.
Outbreak size and timing
| Quantity | Lower 90% | Lower 60% | Lower 30% | Upper 30% | Upper 60% | Upper 90% |
|---|---|---|---|---|---|---|
| Cumulative infections | 12343 | 14887 | 16593 | 20232 | 22555 | 27006 |
| Outbreak age (days) | 182 | 186 | 190 | 197 | 201 | 210 |
Growth and severity
| Quantity | Lower 90% | Lower 60% | Lower 30% | Upper 30% | Upper 60% | Upper 90% |
|---|---|---|---|---|---|---|
| Initial reproduction number | 1.5 | 1.66 | 1.76 | 2 | 2.17 | 2.57 |
| Latest reproduction number | 0.58 | 0.73 | 0.81 | 0.95 | 1.05 | 1.24 |
| Latest growth rate (per day) | -0.04 | -0.02 | -0.01 | 0 | 0 | 0.02 |
| Latest doubling time (days) | -18.98 | -31.17 | -46.55 | -199.04 | 191.51 | 40.96 |
| Case-fatality ratio | 0.37 | 0.42 | 0.45 | 0.5 | 0.53 | 0.58 |
All intervals are equal-tailed 30%, 60% and 90% credible intervals from the joint posterior.
By province
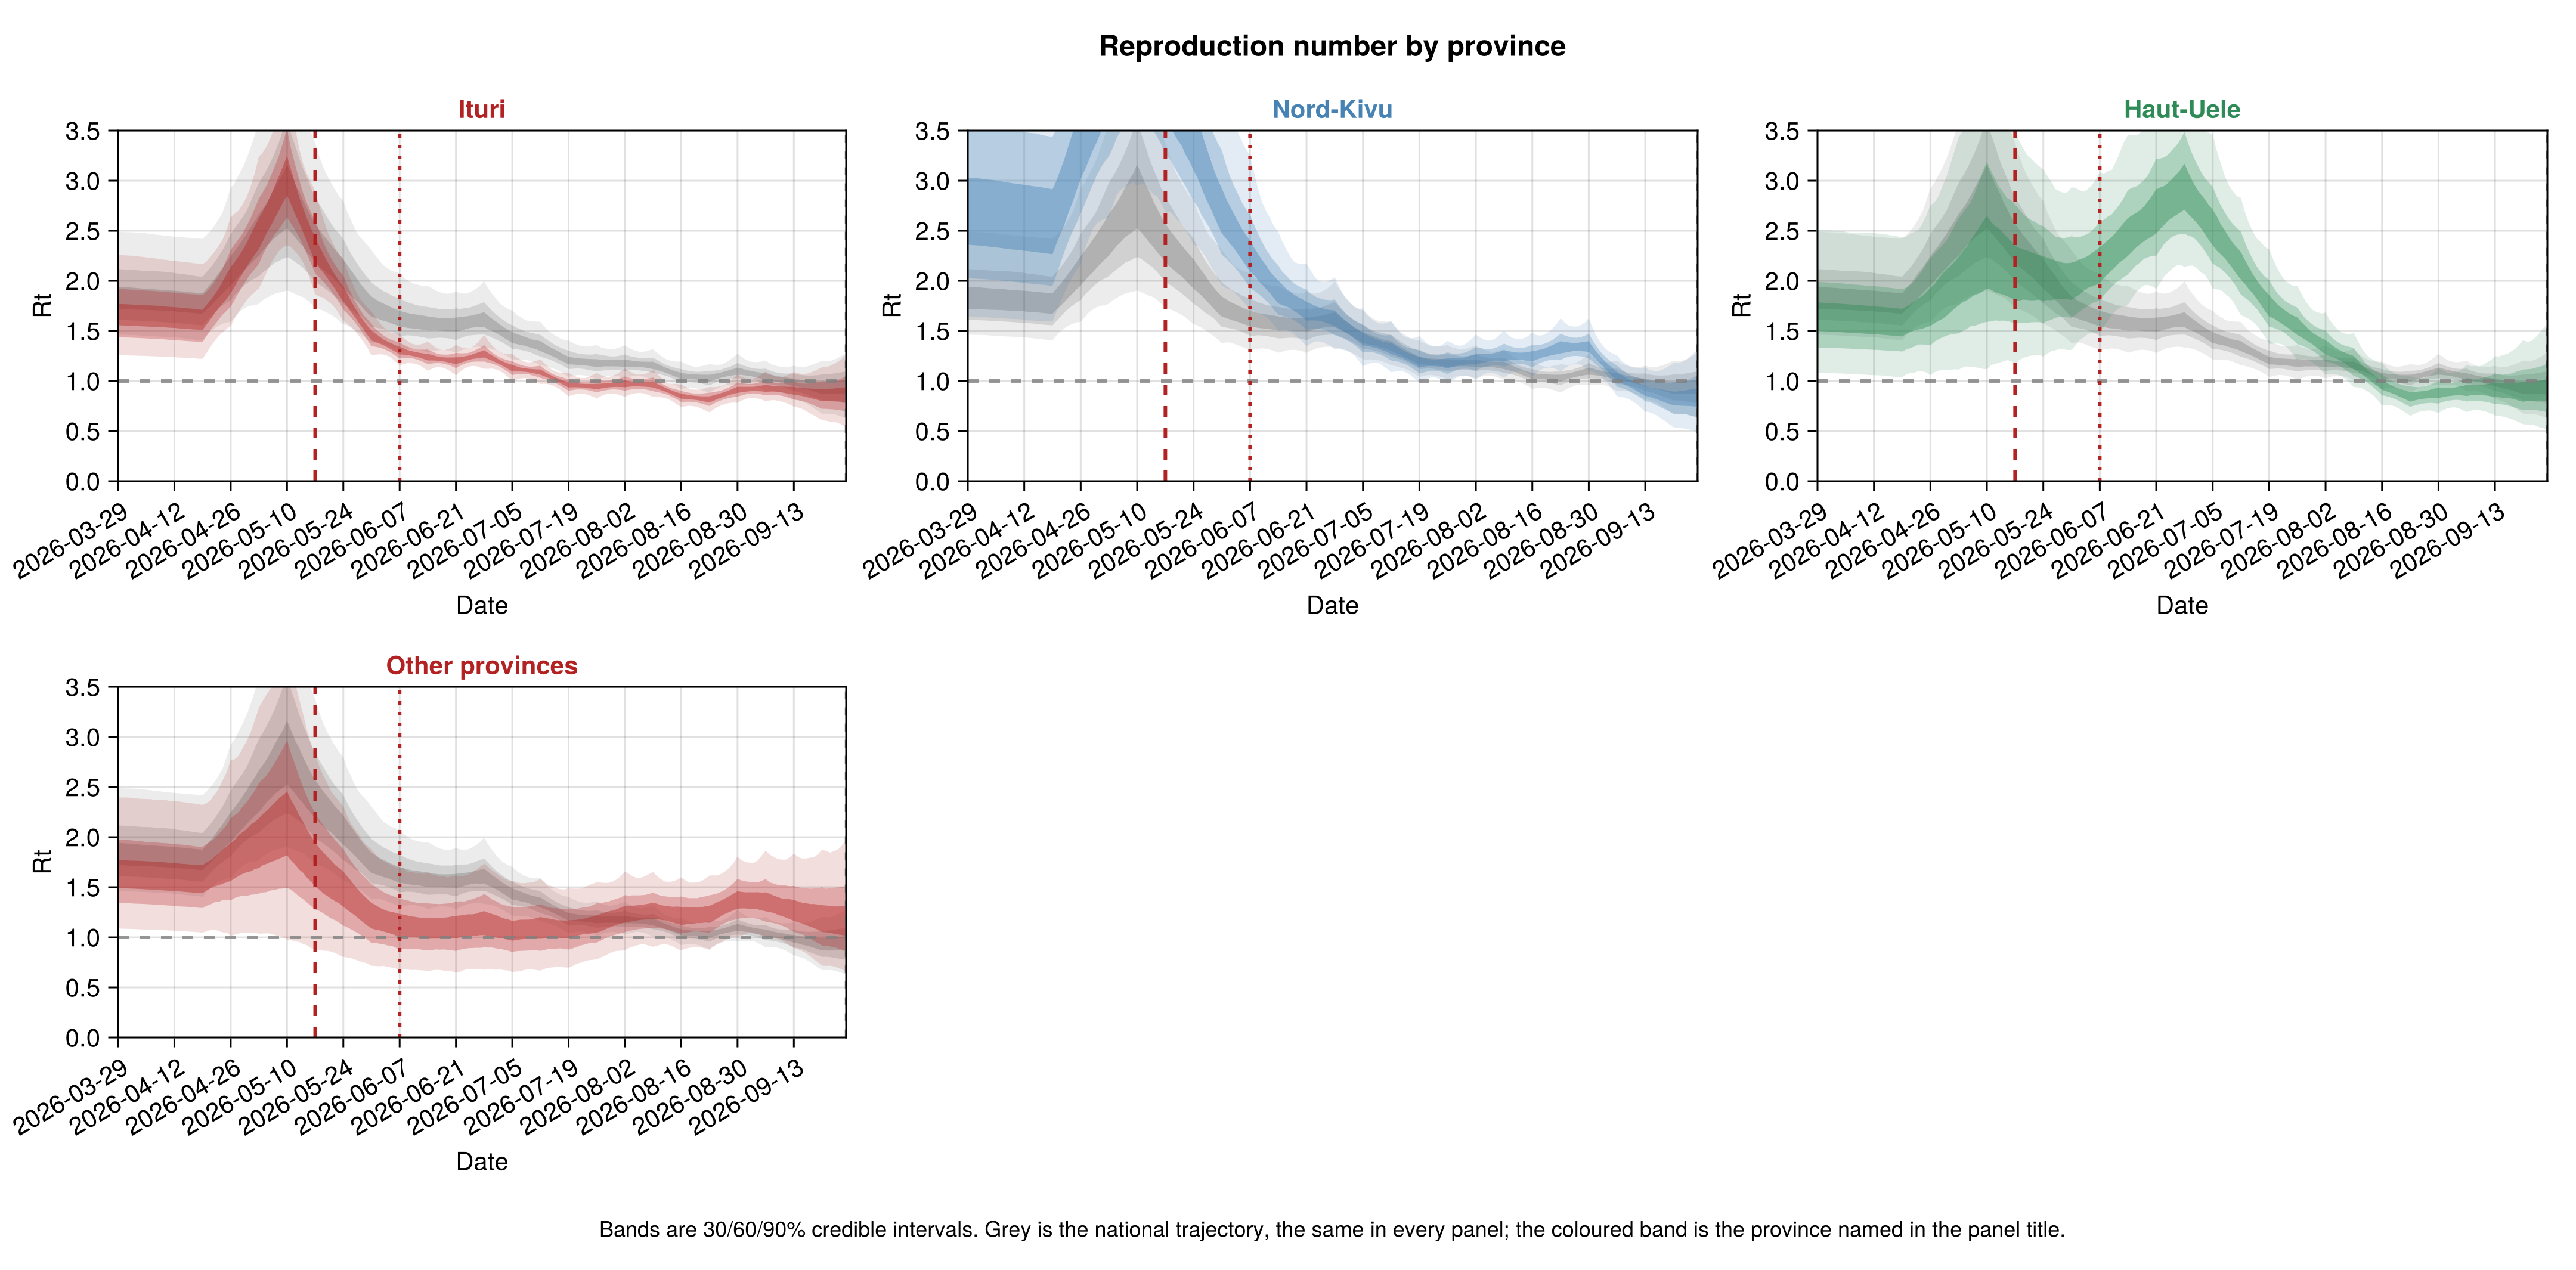
The model runs one renewal equation per province and fits the national streams against the summed provinces, so the national count above is the sum of the provinces. Each range is an equal-tailed 90% credible interval. The reproduction number and the relative ascertainment are read together, because the per-province case data identify only their product. The detail is on the Provinces estimates and Province forecasts pages.
| Province | Share of infections (%) | R at the cut-off | P(R > 1) | CFR (%) | Relative ascertainment |
|---|---|---|---|---|---|
| Ituri | 65–75 | 0.55–1.26 | 26% | 34.4–59.9 | 0.92–1.31 |
| Nord-Kivu | 20–29 | 0.48–1.31 | 26% | 37.5–67.2 | 0.73–1.07 |
| Haut-Uele | 3–6 | 0.51–1.57 | 37% | 34.6–58.8 | 0.89–1.25 |
| Other provinces | 1–1 | 0.66–1.96 | 67% | 34.4–59.8 | 0.79–1.2 |
Ituri has the most infections with probability over 99%, and 1 of 4 provinces is more likely than not to be growing. Infections imported from another province make up 0.0–0.4% of infections to date.
Fit diagnostics
The joint fit passes the convergence checks with warnings.
Expand: how the fits behind these numbers sampled
R-hat sets the spread within each chain against the spread across chains, and a value near one says the chains agree. The bulk effective sample size is the number of independent draws the chains are worth, counted for the parameter where that count is lowest. A divergent transition is a step the sampler could not take accurately. The Sensitivity page breaks these numbers down by parameter.
Its worst R-hat is 1.06 and its lowest bulk effective sample size is 49, with 2 divergent transitions in 2000 draws. A fit passes without warnings when its worst R-hat is at most 1.05, its effective sample sizes are at least 100 and at most 1% of its draws diverge.
Across all 10 fits the worst R-hat is 1.85, in the frozen (1wk back) fit. The lowest bulk effective sample size is 6, in the frozen (1wk back) fit. Only the joint fit is held to the thresholds above.
| fit | max_rhat | min_ess_bulk | divergences |
|---|---|---|---|
| joint | 1.062 | 49 | 2 |
| joint, no patches | 1.022 | 73 | 0 |
| exports | 1.02 | 475 | 0 |
| deaths (DRC) | 1.014 | 268 | 1 |
| cases (DRC) | 1.012 | 496 | 0 |
| confirmed (DRC) | 1.01 | 352 | 11 |
| confirmed deaths (DRC) | 1.015 | 491 | 2 |
| isolation (DRC) | 1.015 | 173 | 2 |
| onsets (DRC) | 1.123 | 16 | 0 |
| frozen (1wk back) | 1.847 | 6 | 1 |
Estimated reproduction number
The time-varying reproduction number R(t), the average number of further infections caused by each infection. A value above one means the outbreak is growing. The detail is on the National estimates and Provinces estimates pages.
The same trajectory by province, with the national one in grey behind each panel. A panel tracking grey says that province moves with the national trend.
Infections over time
Modelled cumulative infections, symptom onsets and deaths. These are the underlying outbreak, upstream of the testing and reporting that produce the observed counts, so they are larger than the reported cases. The detail is on the National estimates page.
Health zones
The split of each patch's infections across its health zones, with the zone maps and the interactive map, is on the Health zones page. The zone split of the week-ahead forecast is on the health-zone forecasts page and its scores on the health-zone forecast evaluation page.
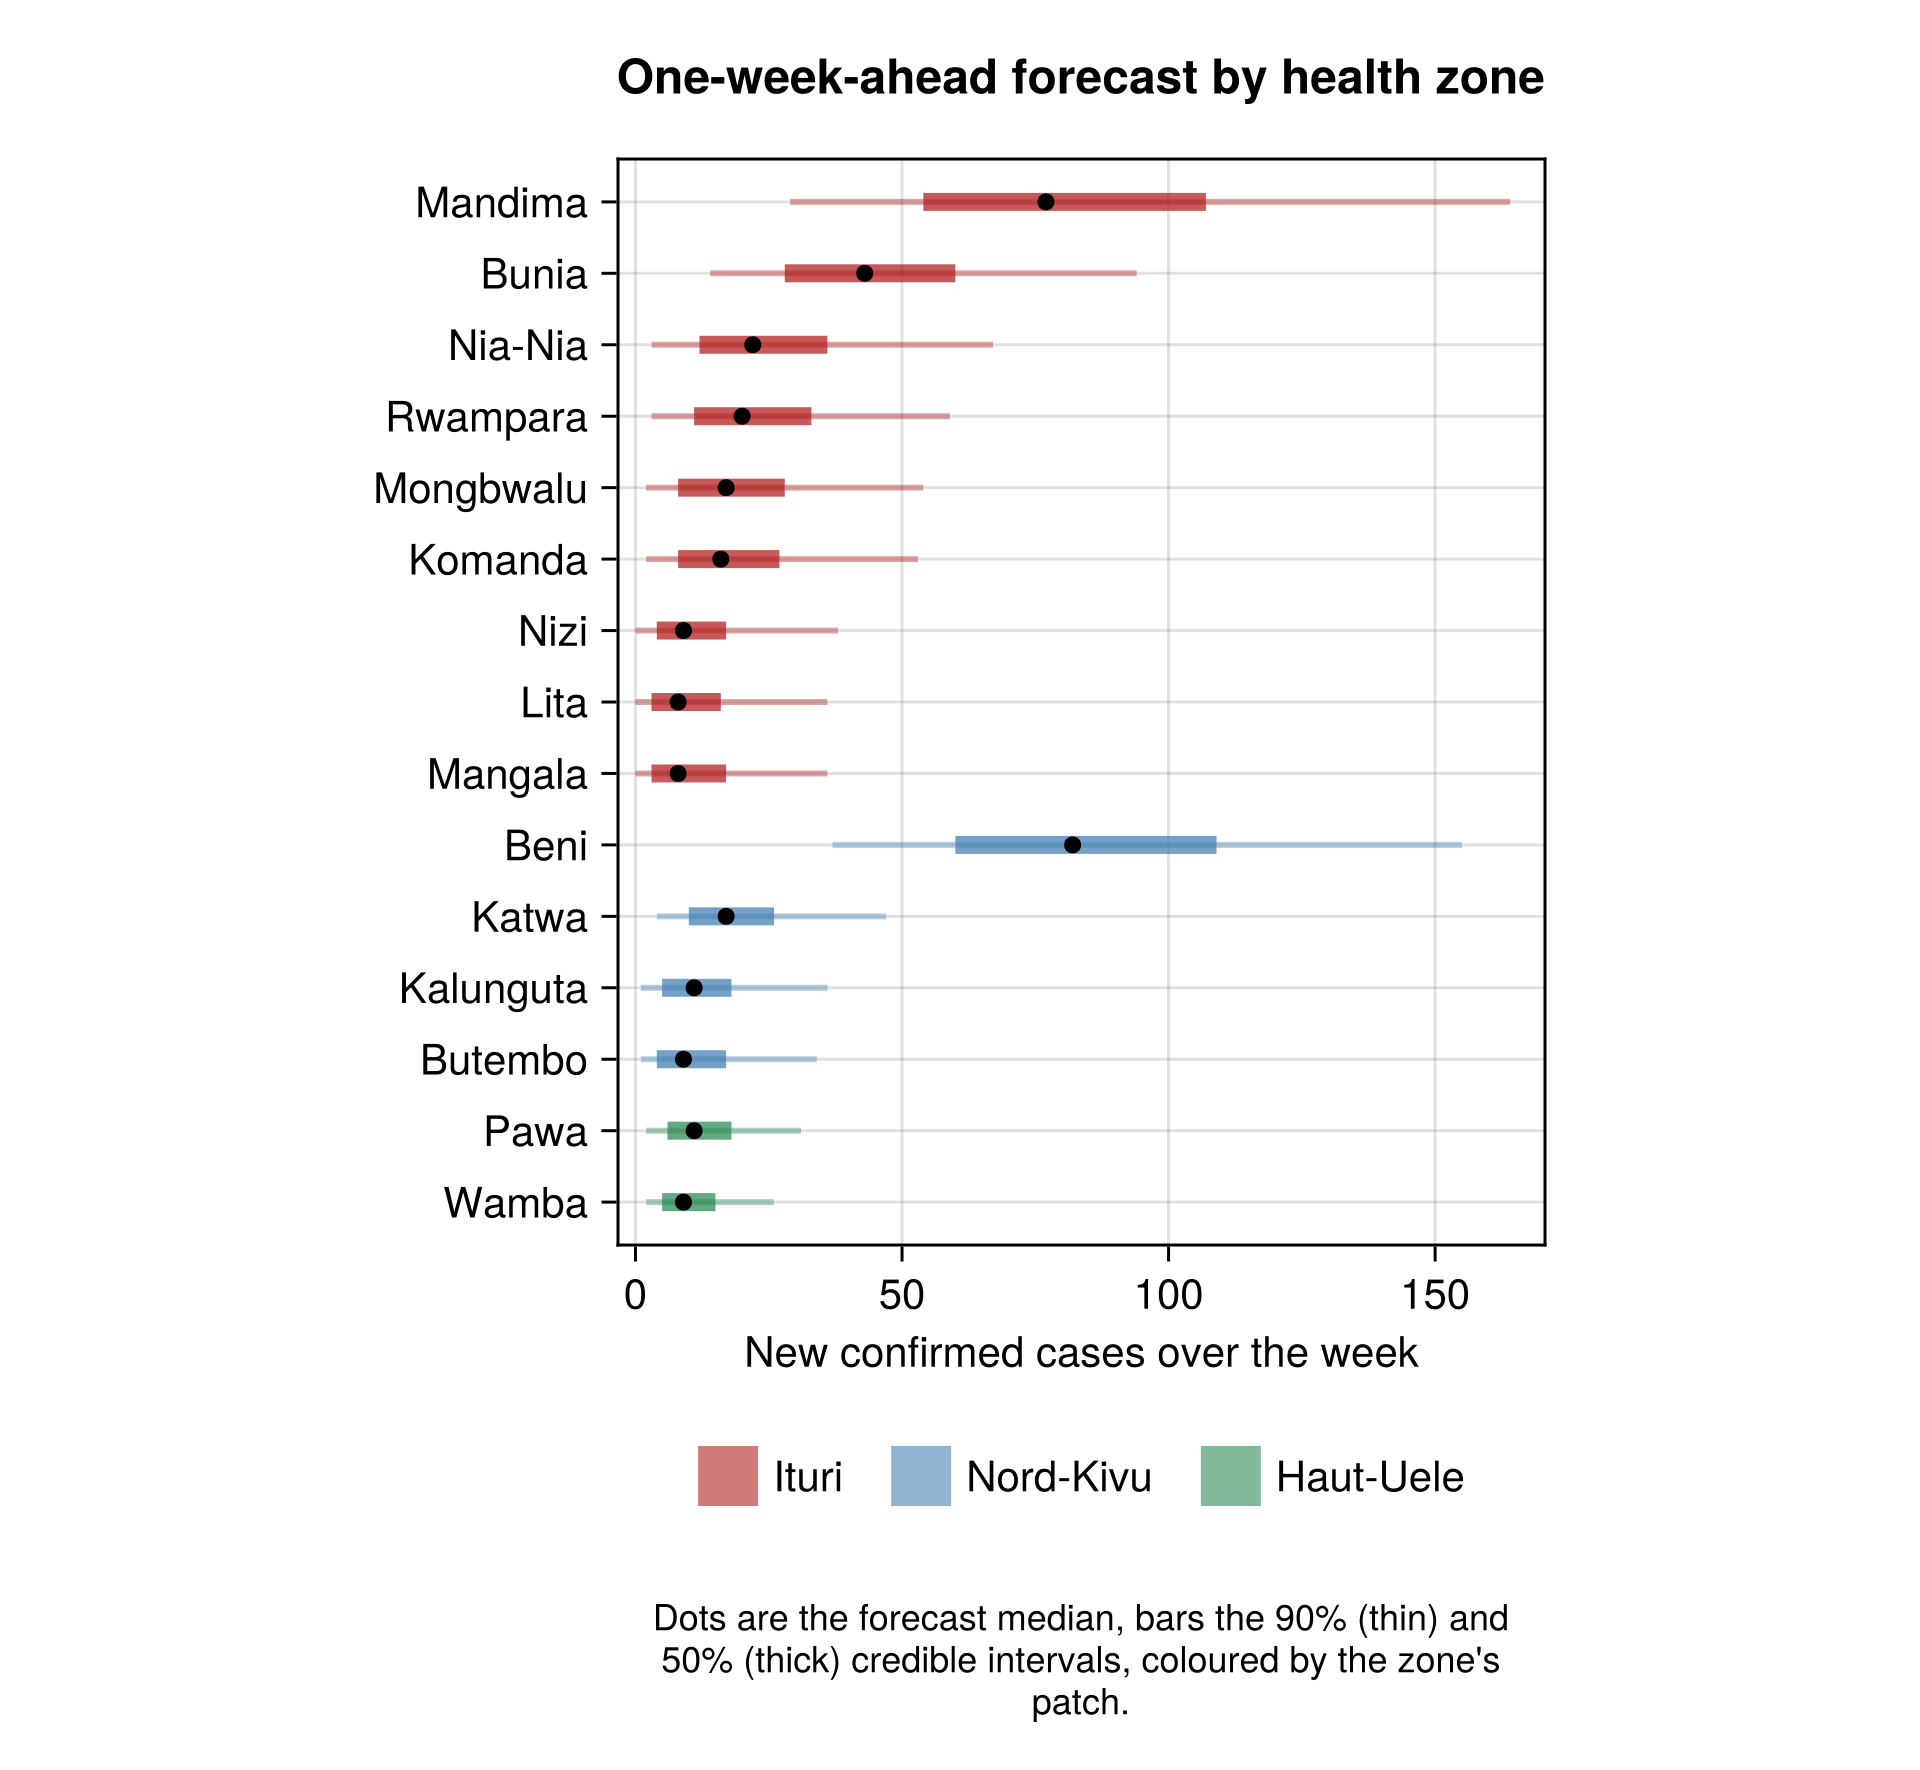
The week-ahead forecast by health zone:
Projected counts are for the week to 2026-10-03.
Most new confirmed cases: Beni about 82 (90% credible interval 37 to 155); Mandima about 77 (90% credible interval 29 to 164); Bunia about 43 (90% credible interval 14 to 94).
Chance of a case: 29 of 63 zones have at least an even chance of reporting a confirmed case, and 11 of reporting at least ten.
Quiet zones: 21 zones have had no case allocated over the past two weeks. Bafwasende is the most likely of them to report one, at 51%.
The map panels give each zone's reproduction number at the cut-off, the 90% interval on its confirmed cases over the coming week and its confirmed cases to date. A reproduction number whose 90% interval spans one is washed towards white.
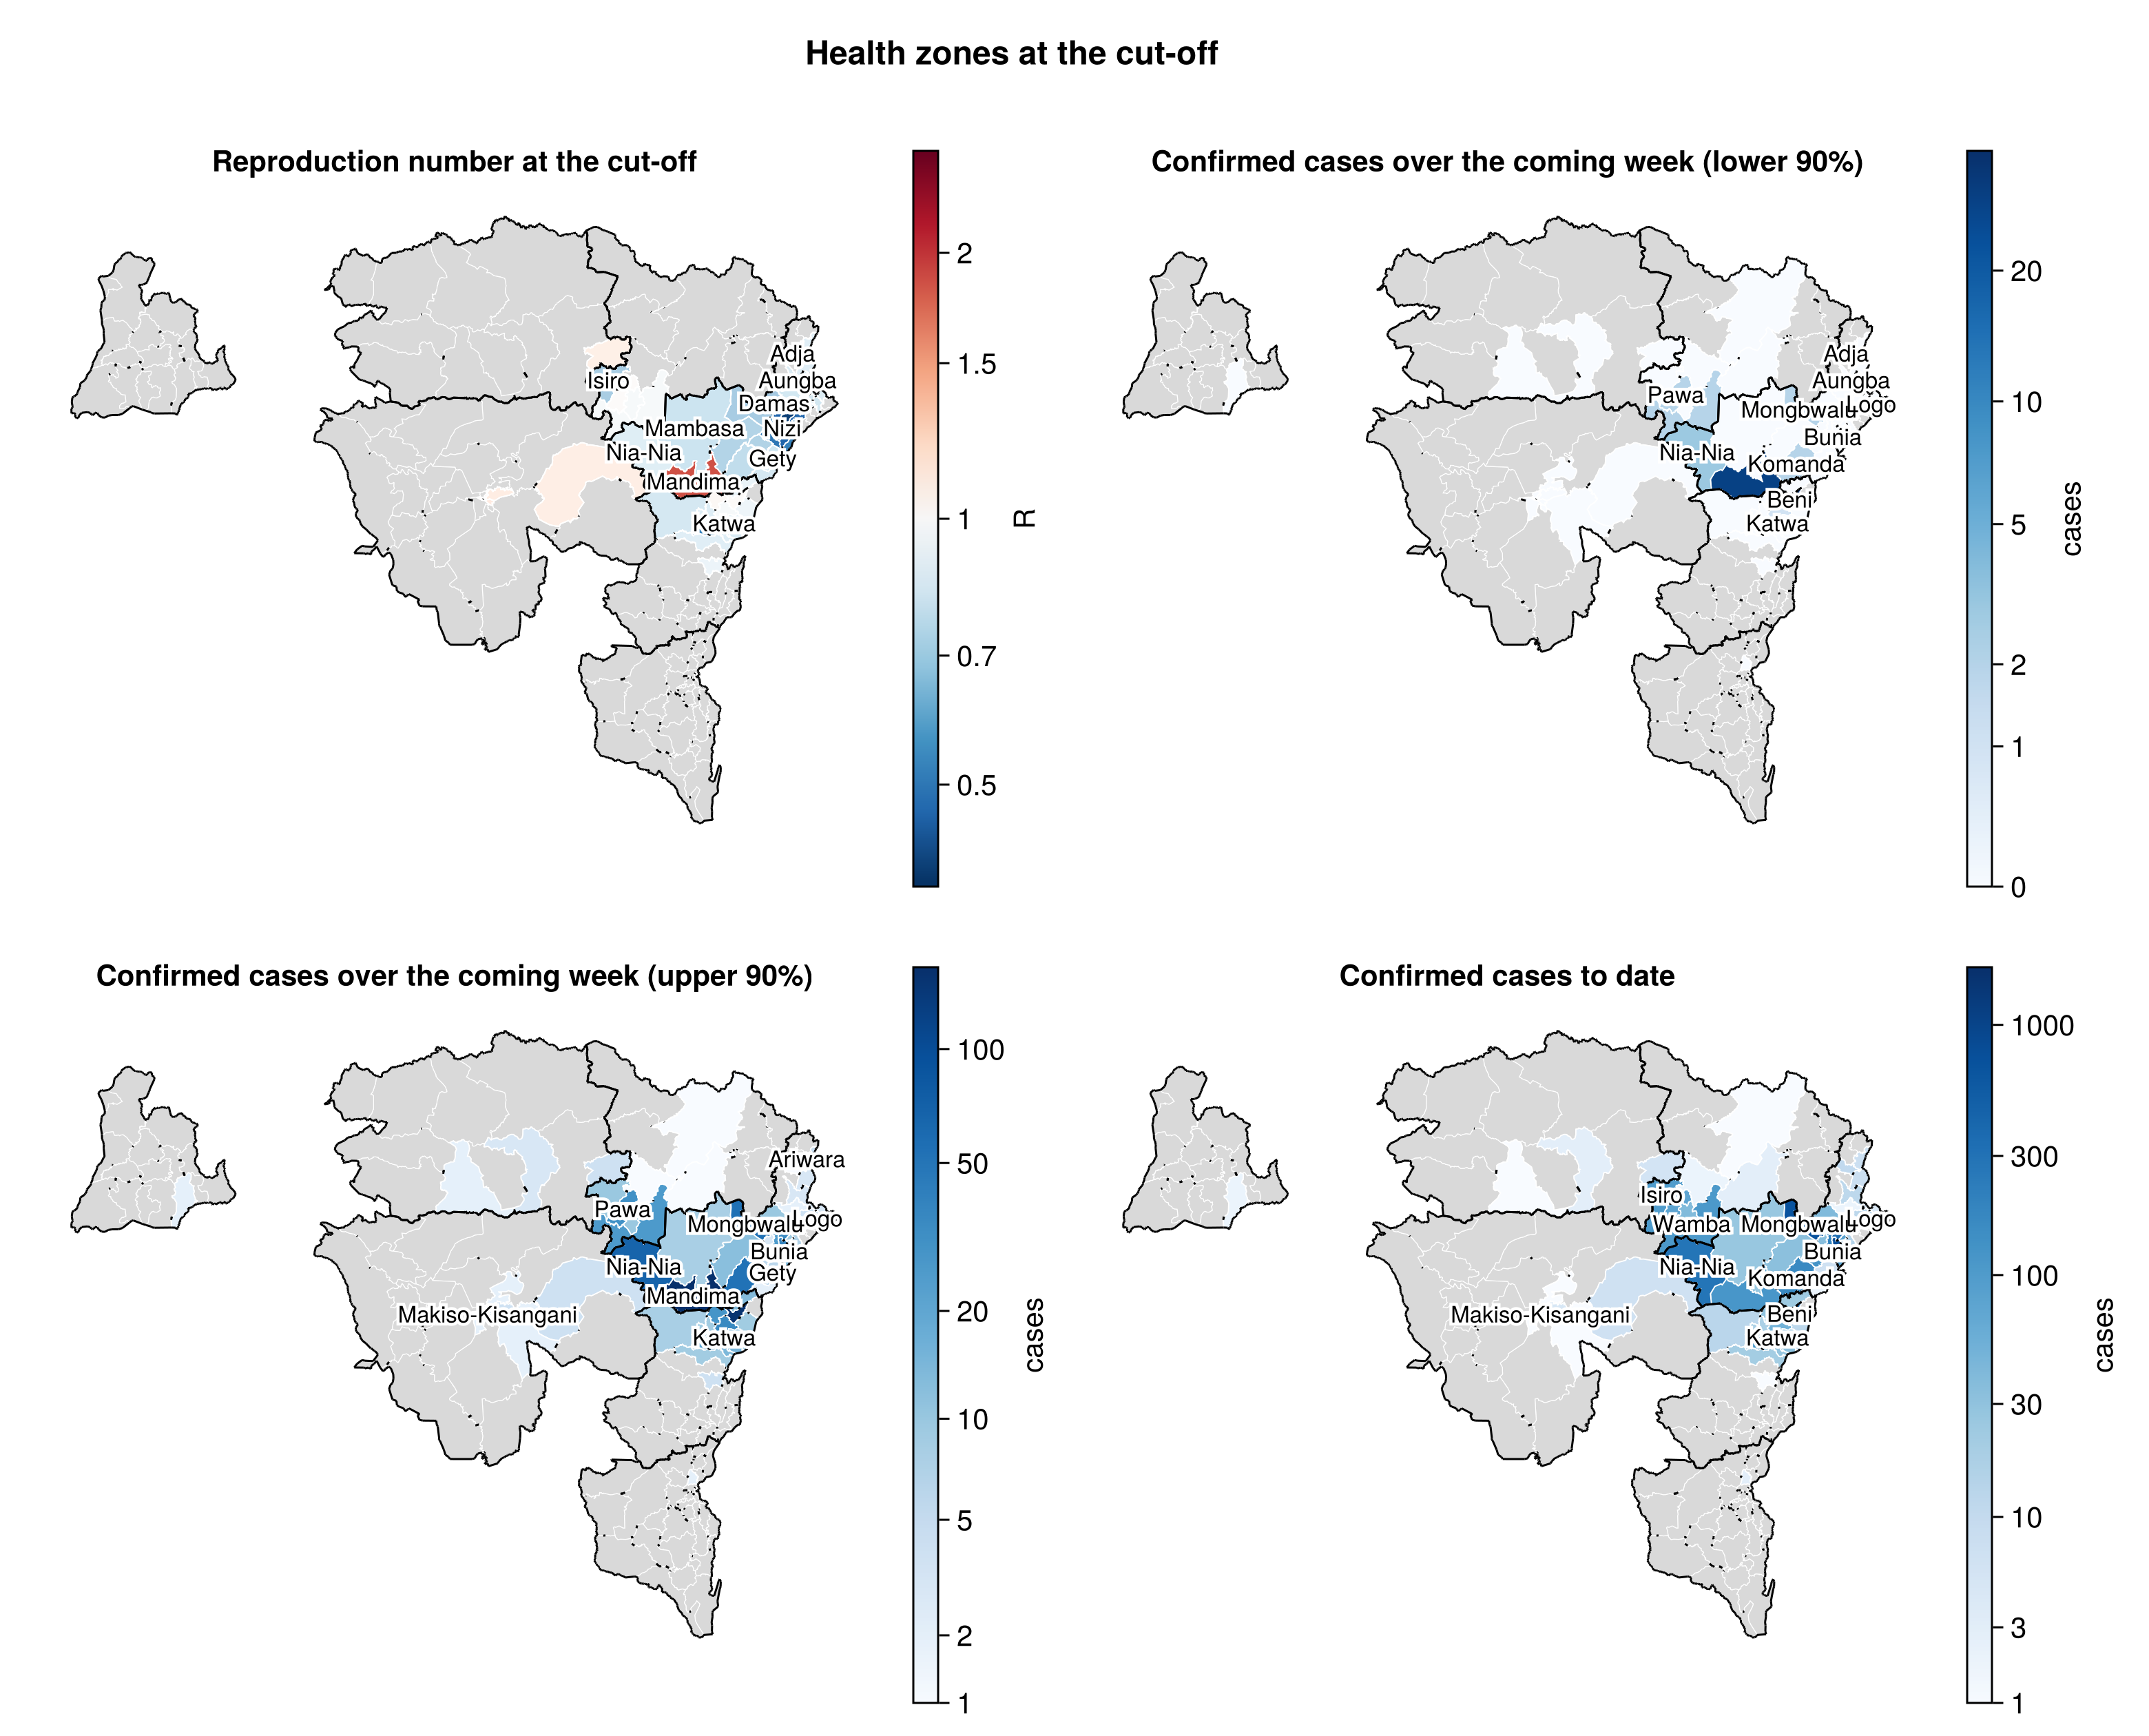
The fifteen zones with the largest forecast confirmed cases over the coming week.
For the full results, methods and code see the National page and the epiforecasts/BVDOutbreakSize repository.