Health-zone forecast evaluation
How the health-zone split on the health-zone forecasts page has scored against what each zone went on to report. The patch totals are scored as in the national forecast evaluation and the zone split against two persistence rules of its own. The same scoring by province is on the province forecast evaluation page. The in-sample zone checks are on the health-zone in-sample checks page.
Load packages, data and fitted chains
# Shared setup: packages, observations and the fit registry. See
# `docs/pages/_setup.jl`.
using BVDOutbreakSize
include(joinpath(pkgdir(BVDOutbreakSize), "docs", "pages", "_setup.jl"))
validation_forecast_from (generic function with 1 method)# The zone fit melded from the frozen joint, loaded from the cache here.
frozen_local = load_fit("local_frozen_validation");Summary
The overall bullets come first, then a block per province, from the scores further down this page. The log score of the split is higher when the model allocates the week's cases better than the persistence rules.
- Split: the zone model allocates the week better than both persistence rules in 1 of 4 provinces scored, over 395 observed confirmed cases.
Ituri
Log score of the split: -83.57, against -203.89 for share persistence and -110.11 for naive persistence.
Total over 242 observed cases: bias 0.79, within the 90% interval: true.
Nord-Kivu
Log score of the split: -54.56, against -106.66 for share persistence and -49.13 for naive persistence.
Total over 121 observed cases: bias 0.96, within the 90% interval: false.
Haut-Uele
Log score of the split: -6.62, against -9.31 for share persistence and -6.57 for naive persistence.
Total over 24 observed cases: bias 0.52, within the 90% interval: true.
Other provinces
Log score of the split: -10.76, against -10.45 for share persistence and -8.12 for naive persistence.
Total over 8 observed cases: bias 0.24, within the 90% interval: true.
Across releases
- No zone forecast has been scored yet. Scores appear from the first release that archives the zone forecast onwards.
Forecast by health zone
The one-week-ahead forecast split by health zone, scored against what each zone went on to report. Each zone's forecast is drawn from the health-zone model melded from the frozen fit, run a week past the frozen cut-off. The observed count is the change in each zone's cumulative confirmed cases between the frozen cut-off and the vintage a week later, clamped at zero. The week is scored only when the zone tables carry a vintage on its last day. The split of each patch's weekly total is scored by its multinomial log score at the forecast shares. It is set against share persistence, the cumulative zone shares at the cut-off, and naive persistence, the zone split of the last seven days, each with a pseudo-count of 0.5 per zone. The patch total is scored against a naive persistence total with negative-binomial noise, as in the forecast scoring of the analysis methods. The figure shows the fifteen zones with the largest forecast medians and the fold below the scores holds every zone.
Zone forecast against observed
# `frozen_zone_stage_inputs` is defined in the shared setup, so the zone
# estimates page reads the same frozen inputs.
frozen_zone_inputs = frozen_zone_stage_inputs(; forecast = true);
# The week is scored when the current zone tables carry a vintage a week
# past the frozen cut-off. Otherwise the section shows a note in place of
# its outputs.
zone_validation_horizon = frozen_zone_inputs.model_data.forecast.horizon
zone_truth = zone_forecast_truth(
    obs, frozen_zone_inputs;
    made_date = frozen_local.o.cutoff, horizon = zone_validation_horizon
)
_zone_validation_missing = Markdown.parse(
    "_The zone tables carry no vintage a week after the frozen cut-off, so " *
        "the zone forecast is not scored in this build._"
)
if any(!ismissing, zone_truth)
    zone_validation_forecast = zone_forecast(
        frozen_local.chn, frozen_zone_inputs
    )
    zone_validation_table = zone_forecast_vs_truth(
        zone_validation_forecast, frozen_zone_inputs; truth = zone_truth
    )
    zone_validation_scores = zone_forecast_scores(
        zone_validation_forecast, frozen_zone_inputs; truth = zone_truth
    )
    zone_validation_fig = plot_zone_forecast(
        zone_validation_table;
        patch_labels = frozen_zone_inputs.patch_labels,
        xlabel = "New confirmed cases over $(zone_validation_horizon) days",
        title = "Zone forecast from $(frozen_local.o.cutoff) against observed"
    )
else
    # The frames stay frames, since the release assets below write them.
    zone_validation_table = DataFrame()
    zone_validation_scores = DataFrame()
    zone_validation_fig = _zone_validation_missing
end;
# The scores rounded for display. Share persistence forecasts the split
# alone, so its total columns are blank. No patch is scored when every
# observed total is zero or incomplete, which leaves an empty frame
# without the columns.
zone_validation_scores_table = isempty(zone_validation_scores) ?
    _zone_validation_missing :
    let s = zone_validation_scores
        fmt(x, d) = ismissing(x) || isnan(x) ? "" :
        string(round(x; digits = d))
        DataFrame(
            "Province" => s.patch, "Rule" => s.method,
            "Observed total" => s.observed,
            "Log score of the split" => [fmt(x, 2) for x in s.log_score],
            "CRPS of the total" => [fmt(x, 1) for x in s.crps],
            "Log CRPS" => [fmt(x, 2) for x in s.log_crps],
            "Dispersion" => [fmt(x, 1) for x in s.dispersion],
            "Bias" => [fmt(x, 2) for x in s.bias],
            "Total within 90%" => [
                ismissing(x) ? "" : string(x)
                for x in s.coverage_90
            ]
        )
end;
zone_validation_table_display = isempty(zone_validation_table) ?
    _zone_validation_missing :
    zone_validation_table;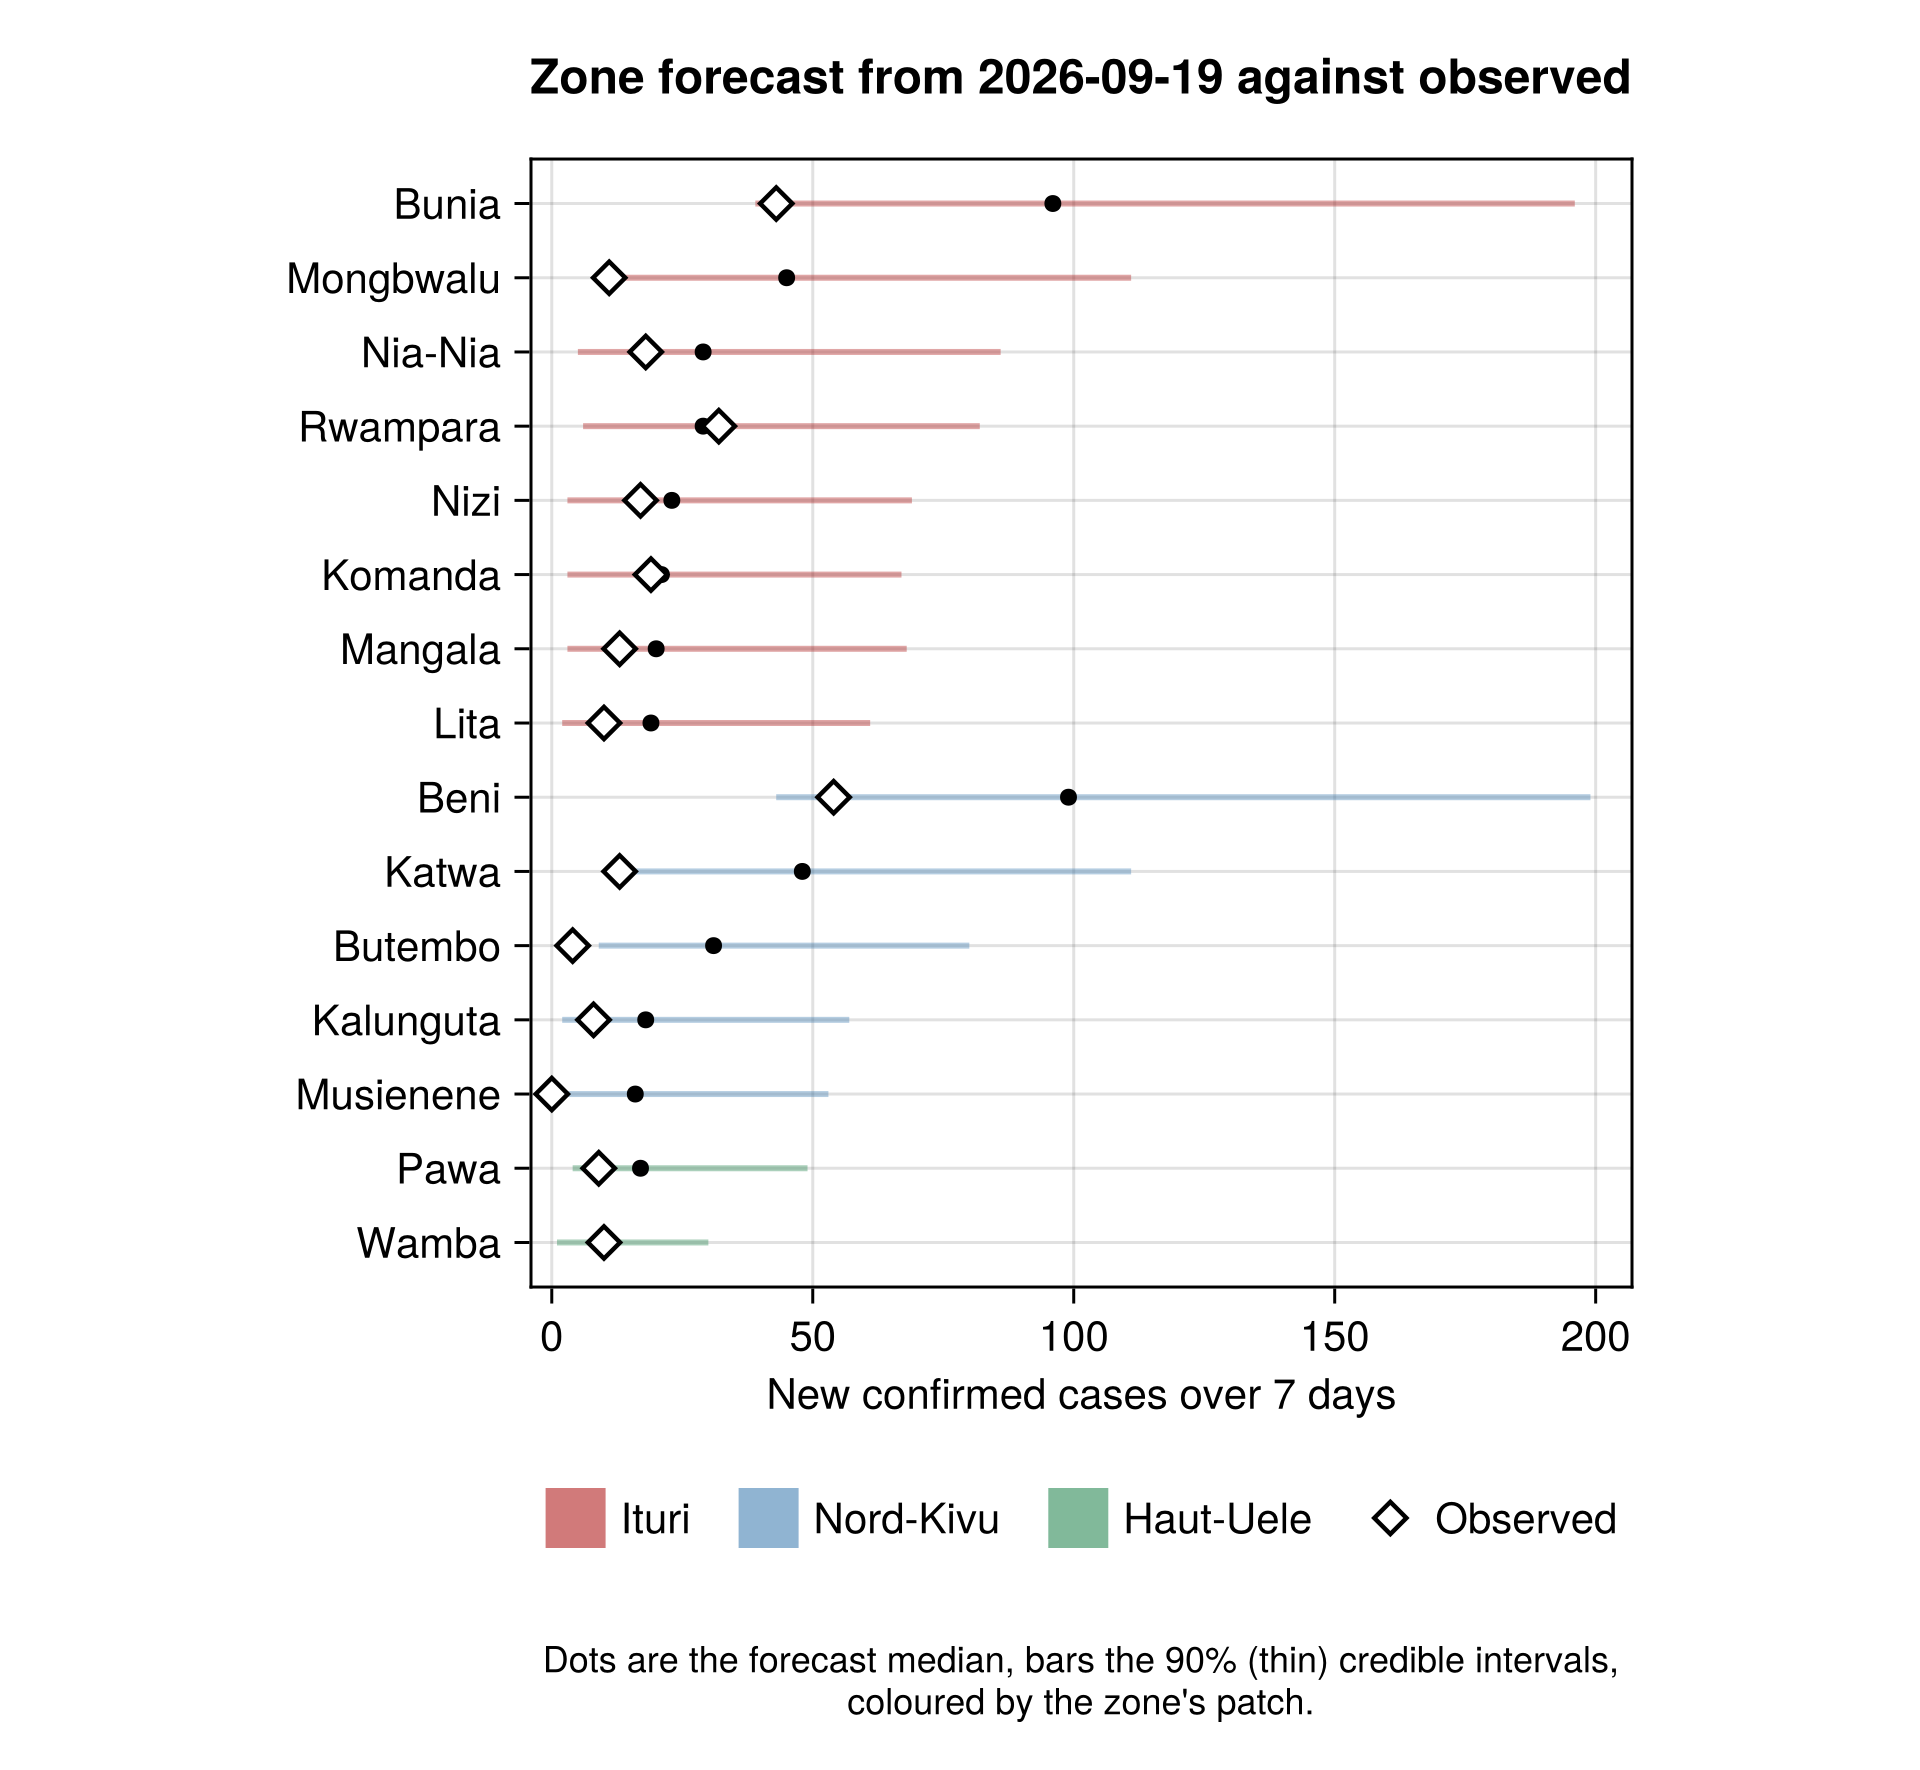
| Province | Rule | Observed total | Log score of the split | CRPS of the total | Log CRPS | Dispersion | Bias | Total within 90% |
|---|---|---|---|---|---|---|---|---|
| Ituri | zone model | 242 | -83.57 | 83.1 | 0.27 | 26.6 | 0.79 | true |
| Ituri | share persistence | 242 | -203.89 | |||||
| Ituri | naive persistence | 242 | -110.11 | 35.5 | 0.13 | 30.6 | 0.25 | true |
| Nord-Kivu | zone model | 121 | -54.56 | 109.5 | 0.6 | 22.0 | 0.96 | false |
| Nord-Kivu | share persistence | 121 | -106.66 | |||||
| Nord-Kivu | naive persistence | 121 | -49.13 | 13.4 | 0.11 | 13.3 | 0.05 | true |
| Haut-Uele | zone model | 24 | -6.62 | 10.0 | 0.28 | 6.0 | 0.52 | true |
| Haut-Uele | share persistence | 24 | -9.31 | |||||
| Haut-Uele | naive persistence | 24 | -6.57 | 3.2 | 0.12 | 3.1 | 0.13 | true |
| Other provinces | zone model | 8 | -10.76 | 2.3 | 0.21 | 2.1 | 0.24 | true |
| Other provinces | share persistence | 8 | -10.45 | |||||
| Other provinces | naive persistence | 8 | -8.12 | 2.5 | 0.21 | 1.5 | 0.49 | true |
Zone forecast against observed, every zone
| zone | patch | central_estimate | lower_90 | lower_50 | upper_50 | upper_90 | observed | within_90 |
|---|---|---|---|---|---|---|---|---|
| Adja | Ituri | 0 | 0 | 0 | 0 | 2 | 0 | true |
| Ariwara | Ituri | 0 | 0 | 0 | 0 | 5 | 0 | true |
| Aru | Ituri | 0 | 0 | 0 | 0 | 6 | 0 | true |
| Aungba | Ituri | 0 | 0 | 0 | 0 | 6 | 0 | true |
| Bambu | Ituri | 7 | 0 | 2 | 15 | 38 | 8 | true |
| Boga | Ituri | 0 | 0 | 0 | 0 | 3 | 0 | true |
| Bunia | Ituri | 96 | 39 | 69 | 131 | 196 | 43 | true |
| Damas | Ituri | 1 | 0 | 0 | 4 | 19 | 0 | true |
| Drodro | Ituri | 0 | 0 | 0 | 2 | 10 | 0 | true |
| Fataki | Ituri | 0 | 0 | 0 | 3 | 17 | 1 | true |
| Gety | Ituri | 0 | 0 | 0 | 0 | 7 | 0 | true |
| Kambala | Ituri | 0 | 0 | 0 | 0 | 4 | 0 | true |
| Kilo | Ituri | 0 | 0 | 0 | 0 | 6 | 1 | true |
| Komanda | Ituri | 21 | 3 | 11 | 36 | 67 | 19 | true |
| Lita | Ituri | 19 | 2 | 9 | 33 | 61 | 10 | true |
| Logo | Ituri | 0 | 0 | 0 | 0 | 7 | 0 | true |
| Lolwa | Ituri | 0 | 0 | 0 | 2 | 14 | 2 | true |
| Mahagi | Ituri | 0 | 0 | 0 | 0 | 5 | 0 | true |
| Mambasa | Ituri | 0 | 0 | 0 | 1 | 9 | 6 | true |
| Mandima | Ituri | 6 | 0 | 1 | 15 | 37 | 59 | false |
| Mangala | Ituri | 20 | 3 | 10 | 35 | 68 | 13 | true |
| Mongbwalu | Ituri | 45 | 12 | 27 | 66 | 111 | 11 | false |
| Nia-Nia | Ituri | 29 | 5 | 16 | 46 | 86 | 18 | true |
| Nizi | Ituri | 23 | 3 | 12 | 39 | 69 | 17 | true |
| Nyankunde | Ituri | 0 | 0 | 0 | 0 | 7 | 1 | true |
| Rimba | Ituri | 0 | 0 | 0 | 0 | 6 | 0 | true |
| Rwampara | Ituri | 29 | 6 | 17 | 48 | 82 | 32 | true |
| Tchomia | Ituri | 3 | 0 | 0 | 10 | 29 | 1 | true |
| Patch total | Ituri | 374 | 218 | 298 | 450 | 594 | 242 | true |
| Beni | Nord-Kivu | 99 | 43 | 72 | 135 | 199 | 54 | true |
| Biena | Nord-Kivu | 1 | 0 | 0 | 4 | 14 | 0 | true |
| Butembo | Nord-Kivu | 31 | 9 | 19 | 46 | 80 | 4 | false |
| Goma | Nord-Kivu | 0 | 0 | 0 | 0 | 4 | 0 | true |
| Kalunguta | Nord-Kivu | 18 | 2 | 9 | 31 | 57 | 8 | true |
| Katwa | Nord-Kivu | 48 | 15 | 32 | 72 | 111 | 13 | false |
| Kayna | Nord-Kivu | 0 | 0 | 0 | 0 | 7 | 0 | true |
| Kyondo | Nord-Kivu | 6 | 0 | 2 | 12 | 32 | 1 | true |
| Lubero | Nord-Kivu | 1 | 0 | 0 | 4 | 17 | 5 | true |
| Mabalako | Nord-Kivu | 2 | 0 | 0 | 7 | 21 | 7 | true |
| Manguredjipa | Nord-Kivu | 0 | 0 | 0 | 2 | 10 | 3 | true |
| Masereka | Nord-Kivu | 3 | 0 | 0 | 8 | 21 | 4 | true |
| Musienene | Nord-Kivu | 16 | 2 | 8 | 28 | 53 | 0 | false |
| Mutwanga | Nord-Kivu | 0 | 0 | 0 | 3 | 12 | 4 | true |
| Oicha | Nord-Kivu | 2 | 0 | 0 | 5 | 17 | 11 | true |
| Vuhovi | Nord-Kivu | 3 | 0 | 0 | 7 | 21 | 7 | true |
| Patch total | Nord-Kivu | 274 | 146 | 214 | 342 | 471 | 121 | false |
| Boma Mangbetu | Haut-Uele | 3 | 0 | 1 | 6 | 13 | 3 | true |
| Dungu | Haut-Uele | 0 | 0 | 0 | 0 | 2 | 0 | true |
| Gombari | Haut-Uele | 0 | 0 | 0 | 0 | 2 | 0 | true |
| Isiro | Haut-Uele | 5 | 0 | 3 | 10 | 21 | 2 | true |
| Pawa | Haut-Uele | 17 | 4 | 10 | 28 | 49 | 9 | true |
| Rungu | Haut-Uele | 0 | 0 | 0 | 0 | 3 | 0 | true |
| Wamba | Haut-Uele | 9 | 1 | 5 | 16 | 30 | 10 | true |
| Patch total | Haut-Uele | 39 | 10 | 25 | 59 | 97 | 24 | true |
| Miti-Murhesa | Other provinces | 0 | 0 | 0 | 1 | 3 | 0 | true |
| Bafwasende | Other provinces | 1 | 0 | 0 | 2 | 4 | 0 | true |
| Kabondo | Other provinces | 1 | 0 | 0 | 2 | 4 | 0 | true |
| Lubunga | Other provinces | 0 | 0 | 0 | 1 | 2 | 0 | true |
| Makiso-Kisangani | Other provinces | 4 | 0 | 2 | 7 | 15 | 3 | true |
| Mangobo | Other provinces | 1 | 0 | 0 | 2 | 5 | 1 | true |
| Tshopo | Other provinces | 0 | 0 | 0 | 1 | 2 | 0 | true |
| Wanie-Rukula | Other provinces | 0 | 0 | 0 | 1 | 2 | 0 | true |
| Buta | Other provinces | 0 | 0 | 0 | 1 | 2 | 0 | true |
| Ganga | Other provinces | 0 | 0 | 0 | 1 | 4 | 0 | true |
| Viadana | Other provinces | 0 | 0 | 0 | 1 | 3 | 3 | true |
| Bulu | Other provinces | 0 | 0 | 0 | 0 | 1 | 1 | true |
| Patch total | Other provinces | 10 | 1 | 6 | 18 | 33 | 8 | true |
Forecast by health zone across releases
The archived zone forecast of each release, scored against what each zone went on to report. The scores are those of the province forecast evaluation, with each zone scored as its own stream against a persistence baseline built from the zone's own history. A week is left out when the zone tables carry no vintage on its last day, when it holds a harmonisation-break day, or when its province moved unallocated cases into named zones during it. The figures show the ten zones with the most observed cases over the scored weeks, and the folds hold every zone.
Load and summarise the zone forecast scores
# Written by `scripts/score_releases.jl` from each release's
# `zone_forecast.csv`. Missing files read as empty tables.
zone_release_scores_df = _release_data(
    joinpath("zone", "forecast_scores.csv"),
    (;
        release = String, made_date = Date, stream = String, horizon = Int,
        target_date = Date, fit = String, crps = Float64,
        log_crps = Float64, dispersion = Float64, overprediction = Float64,
        underprediction = Float64, coverage_50 = Float64,
        coverage_90 = Float64,
        bias = Float64, n_samples = Int,
        log_rel_to_baseline = Float64,
    )
)
zone_release_overlay_df = scored_overlay(
    _release_data(
        joinpath("zone", "forecast_overlay.csv"),
        (;
            release = String, made_date = Date, stream = String,
            horizon = Int, target_date = Date, fit = String,
            observed = Float64, median = Float64, lo30 = Float64,
            hi30 = Float64, lo60 = Float64, hi60 = Float64, lo90 = Float64,
            hi90 = Float64,
        )
    )
)
# Every scored zone, ordered by its observed cases over the scored weeks.
zone_release_keys = let o = zone_release_overlay_df[
        zone_release_overlay_df.fit .== JOINT_FIT, :,
    ]
    tot = Dict{String, Float64}()
    for r in eachrow(o)
        k = zone_score_key(r.stream)
        k === nothing || (tot[k] = get(tot, k, 0.0) + r.observed)
    end
    sort!(collect(keys(tot)); by = k -> (-tot[k], k))
end
zone_release_labels = let lab = Dict(
        zip(frozen_zone_inputs.zone_keys, frozen_zone_inputs.zone_labels)
    )
    [get(lab, k, k) for k in zone_release_keys]
end
zone_release_top = first(zone_release_keys, 10)
_zone_release(tbl, keys = zone_release_keys) = zone_score_rows(
    tbl, keys, zone_release_labels[indexin(keys, zone_release_keys)]
)
# Zones in the order of `zone_release_keys`, under a `zone` column.
_zone_release_display(tbl) = let t = drop_degenerate_fit_column(
        drop_individual_fit_columns(tbl)
    )
    t = t[sortperm(indexin(t.stream, zone_release_labels)), :]
    DataFrame([(c == "stream" ? "zone" : c) => t[!, c] for c in names(t)])
end
zone_release_by_horizon = forecast_score_by_horizon(
    _zone_release(zone_release_scores_df, zone_release_top)
)
zone_release_by_release = forecast_score_by_release(
    _zone_release(zone_release_scores_df, zone_release_top)
)
zone_release_overview_display = _zone_release_display(
    forecast_score_overview(_zone_release(zone_release_scores_df))
)
zone_release_by_release_display = _zone_release_display(
    forecast_score_by_release(_zone_release(zone_release_scores_df))
);

_zone_release_empty = "No zone forecast has been scored yet. Scores " *
    "appear from the first release that archives the zone forecast onwards.";
# A plain statement above the tables: when nothing is scored yet, and
# otherwise the first cut-off scored.
zone_release_note = Markdown.parse(
    size(zone_release_scores_df, 1) == 0 ? _zone_release_empty :
        string(
            "Scores run from the forecast made on ",
            minimum(zone_release_scores_df.made_date), "."
        )
);
No zone forecast has been scored yet. Scores appear from the first release that archives the zone forecast onwards.
What the error is made of, one panel per zone: the mean CRPS split into its width, its overprediction and its underprediction.
zone_release_crps_fig = plot_forecast_crps_by_horizon(
    zone_release_by_horizon;
    title = "CRPS decomposition, by health zone",
    empty_message = _zone_release_empty
);
The relative skill against the baseline release by release, on a log-scaled skill axis with the reference line at one.
zone_release_by_cutoff_fig = plot_forecast_skill_by_cutoff(
    zone_release_by_release;
    title = "Relative skill against the baseline by release, by health zone",
    empty_message = _zone_release_empty
);
Each release's zone forecasts against what each zone went on to report. The x-axis is the cut-off each forecast was made from. Each forecast shows its median and 90% predictive interval, beside the persistence baseline and the observed count.
zone_release_overlay_fig = plot_forecast_overlay(
    _zone_release(zone_release_overlay_df, zone_release_top);
    empty_message = _zone_release_empty
);
Zone scores across releases, every zone
| zone | fit | n | crps | rel_to_baseline | log_crps | log_rel_to_baseline | dispersion | overprediction | underprediction | coverage_50 | coverage_90 | bias | | — | — | —: | —: | —: | —: | —: | —: | —: | —: | —: | —: | —: |
Zone scores by release, every zone
| made_date | zone | fit | n | crps | rel_to_baseline | log_crps | log_rel_to_baseline | dispersion | overprediction | underprediction | coverage_50 | coverage_90 | bias | | — | — | — | —: | —: | —: | —: | —: | —: | —: | —: | —: | —: | —: |
Saving zone forecast outputs
The frozen zone fit's one-week-ahead forecast against the observed zone increments, and its scores against the two persistence rules, are written as release assets.
Write zone forecast outputs
output_dir = get(
    ENV, "BVD_OUTPUT_DIR",
    joinpath(pkgdir(BVDOutbreakSize), "output")
)
mkpath(output_dir)
CSV.write(
    joinpath(output_dir, "zone_forecast_validation.csv"),
    zone_validation_table
)
CSV.write(
    joinpath(output_dir, "zone_forecast_scores.csv"),
    zone_validation_scores
)"/home/runner/work/BVDOutbreakSize/BVDOutbreakSize/output/zone_forecast_scores.csv"Write the summary bullets
# The bullets under the summary heading at the top of the page. They read
# the scores built further down, so they are written here and read back
# when the site is assembled.
evaluation_forecast_zone_summary = let s = zone_validation_scores
    fmt(x) = ismissing(x) || (x isa Real && isnan(x)) ? "n/a" :
        string(round(x; digits = 2))
    if isempty(s)
        string(
            "- **Zone forecasts:** the zone tables end at or before the ",
            "frozen cut-off, so no zone forecast is scored in this build."
        )
    else
        patches = unique(s.patch)
        rule(p, m) = let r = s[(s.patch .== p) .& (s.method .== m), :]
            size(r, 1) == 0 ? nothing : first(eachrow(r))
        end
        beats(p) = let m = rule(p, "zone model")
            m === nothing ? false :
                all(
                    r -> r === nothing || m.log_score >= r.log_score,
                    [rule(p, "share persistence"), rule(p, "naive persistence")]
                )
        end
        observed_total = sum(s[s.method .== "zone model", :observed])
        overall = [
            string(
                "- **Split:** the zone model allocates the week better ",
                "than both persistence rules in ", count(beats, patches),
                " of ", length(patches), " provinces scored, over ",
                observed_total, " observed confirmed cases."
            ),
        ]
        function detail(p)
            m = rule(p, "zone model")
            m === nothing && return string("**", p, "**", "\n\n- Not scored.")
            return join(
                [
                    string("**", p, "**"), "",
                    string(
                        "- Log score of the split: ", fmt(m.log_score),
                        ", against ",
                        fmt(
                            rule(p, "share persistence") === nothing ?
                                missing : rule(p, "share persistence").log_score
                        ),
                        " for share persistence and ",
                        fmt(
                            rule(p, "naive persistence") === nothing ?
                                missing : rule(p, "naive persistence").log_score
                        ),
                        " for naive persistence."
                    ),
                    string(
                        "- Total over ", m.observed,
                        " observed cases: bias ", fmt(m.bias),
                        ", within the 90% interval: ",
                        ismissing(m.coverage_90) ? "n/a" :
                            string(m.coverage_90), "."
                    ),
                ], "\n"
            )
        end
        join(vcat([join(overall, "\n")], [detail(p) for p in patches]), "\n\n")
    end
end
dashboard_dir = joinpath(
    pkgdir(BVDOutbreakSize), "docs", "src", "summary_assets"
)
mkpath(dashboard_dir)
write(
    joinpath(dashboard_dir, "evaluation_forecast_zone.md"),
    evaluation_forecast_zone_summary
);
Add the across-release scores to the summary
# A block on the zone forecasts scored across releases, after the
# per-province blocks above.
zone_release_summary = let ov = forecast_score_overview(
        _zone_release(zone_release_scores_df)
    )
    rows = filter(r -> !ismissing(r.rel_to_baseline), ov)
    size(rows, 1) == 0 ?
        "**Across releases**\n\n- $(_zone_release_empty)" :
        string(
            "**Across releases**\n\n- ", count(<(1), rows.rel_to_baseline),
            " of ", size(rows, 1), " zones scored beat the persistence ",
            "baseline, from the forecast made on ",
            minimum(zone_release_scores_df.made_date), " onwards."
        )
end
open(joinpath(dashboard_dir, "evaluation_forecast_zone.md"), "a") do io
    write(io, "\n\n", zone_release_summary)
end;