Health-zone in-sample checks
Whether the fitted health-zone model reproduces the per-zone data it was fitted to. The national checks are on the national in-sample checks page and the provincial ones on the province in-sample checks page. The per-zone confirmed cases and deaths enter the model as compositions of their patch's totals, so the checks here are on each zone's share of its patch.
Load packages, data and fitted chains
# Shared setup: packages, observations and the fit registry. See
# `docs/pages/_setup.jl`.
using BVDOutbreakSize
include(joinpath(pkgdir(BVDOutbreakSize), "docs", "pages", "_setup.jl"))
validation_forecast_from (generic function with 1 method)# The fits this page reads, loaded from the cache here. The headline joint
# carries the patch trajectories the zone stage conditions on.
chn_joint = load_fit("joint");
chn_local = load_fit("local");Summary
The overall bullets come first, then a block per province, from the calibration further down this page. Bias runs from −1 to 1 and is zero when the observed counts sit at the predictive median, negative when the model under-predicts. Coverage is nominally 0.9.
Least well reproduced: Haut-Uele (cases) (bias 0.04, 90% coverage 0.94); Nord-Kivu (cases) (bias -0.01, 90% coverage 0.98); Other provinces (cases) (bias 0.01, 90% coverage 0.97).
Coverage: 8 of 8 composition rows have 90% coverage of at least 0.8; the lowest is Haut-Uele (cases) at 0.94.
Ituri
Confirmed cases: bias -0.0 and 90% coverage 0.97 over 2744 cells.
Confirmed deaths: bias 0.0 and 90% coverage 0.98 over 2688 cells.
Nord-Kivu
Confirmed cases: bias -0.01 and 90% coverage 0.98 over 1488 cells.
Confirmed deaths: bias -0.0 and 90% coverage 0.98 over 1408 cells.
Haut-Uele
Confirmed cases: bias 0.04 and 90% coverage 0.94 over 420 cells.
Confirmed deaths: bias 0.01 and 90% coverage 0.98 over 336 cells.
Other provinces
Confirmed cases: bias 0.01 and 90% coverage 0.97 over 384 cells.
Confirmed deaths: bias -0.0 and 90% coverage 0.99 over 240 cells.
Zone compositions
The per-zone confirmed cases and deaths are fitted as two compositions conditional on their patch's total, one level below the province compositions. The cases run on the infection-to-report delay and the deaths on the infection-to-confirmed-death delay, each with its own overdispersion, so the two are checked separately. What the model predicts is each zone's share of its patch rather than its count.
Load the zone fit's inputs and prior
# `zone_stage_inputs` and `zone_prior_draws` are defined in the shared setup,
# so the zone estimates and forecast pages read the same fixed inputs.
zone_inputs = zone_stage_inputs();
zone_patch = zone_inputs.patch_of_zone;
prior_chn_zone = zone_prior_draws(zone_inputs);
Confirmed cases
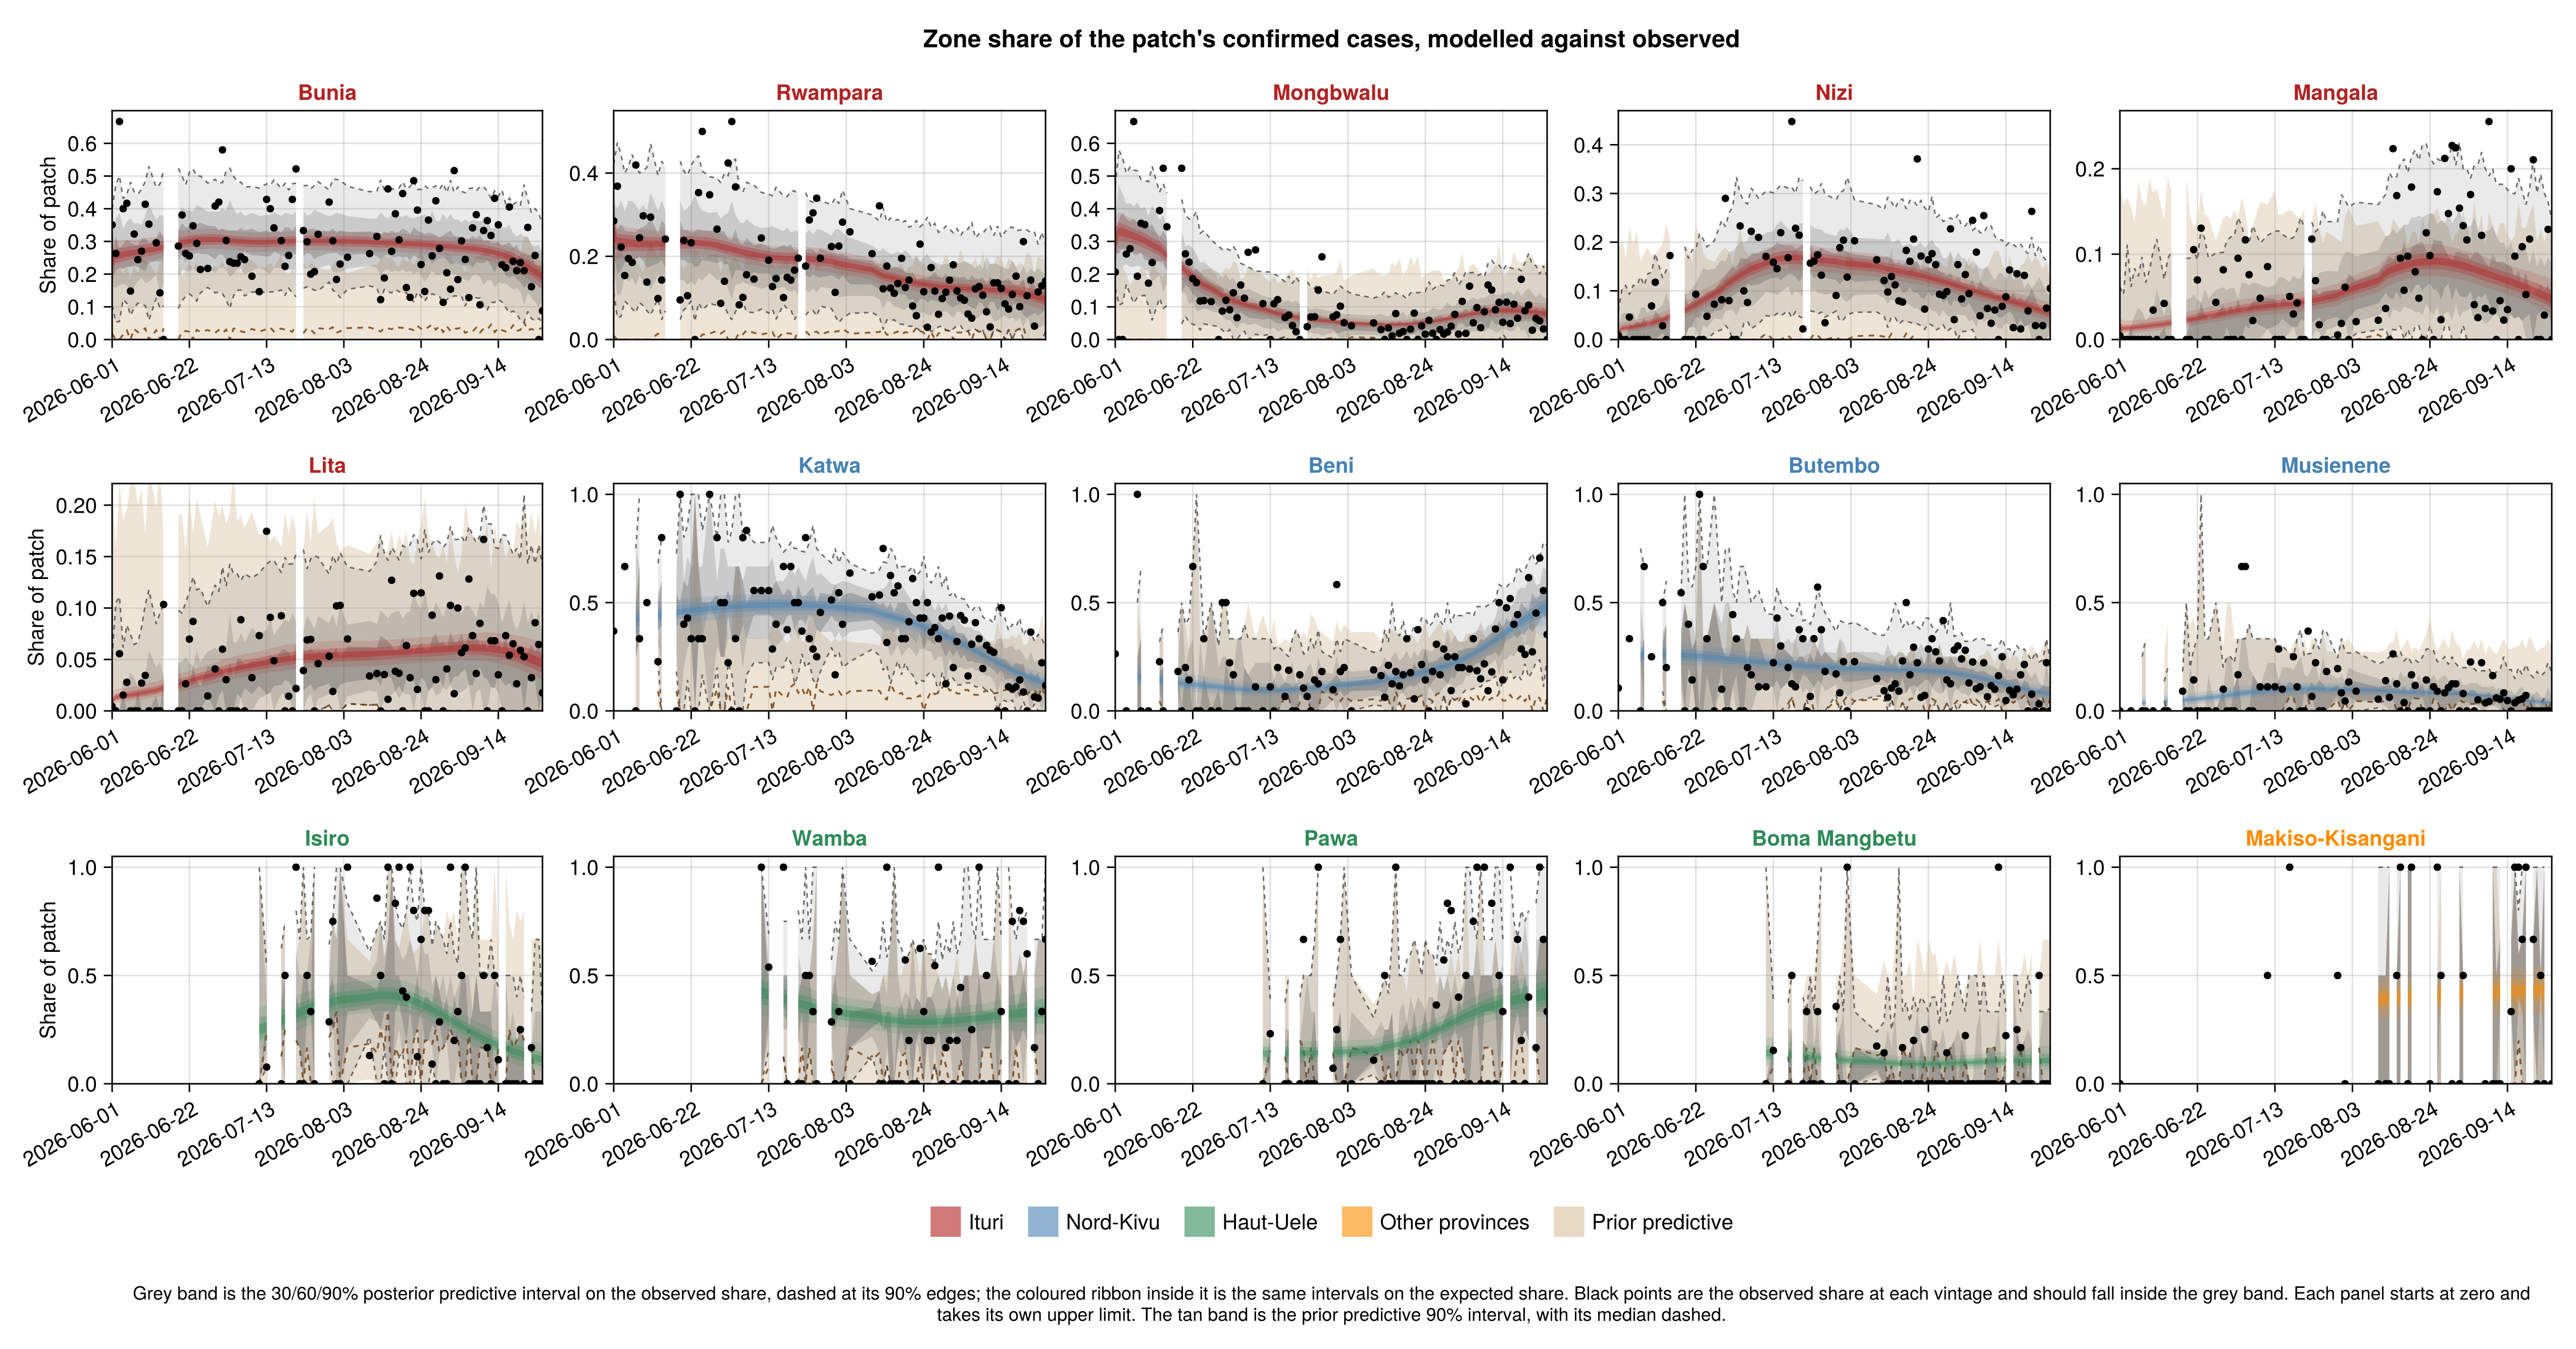
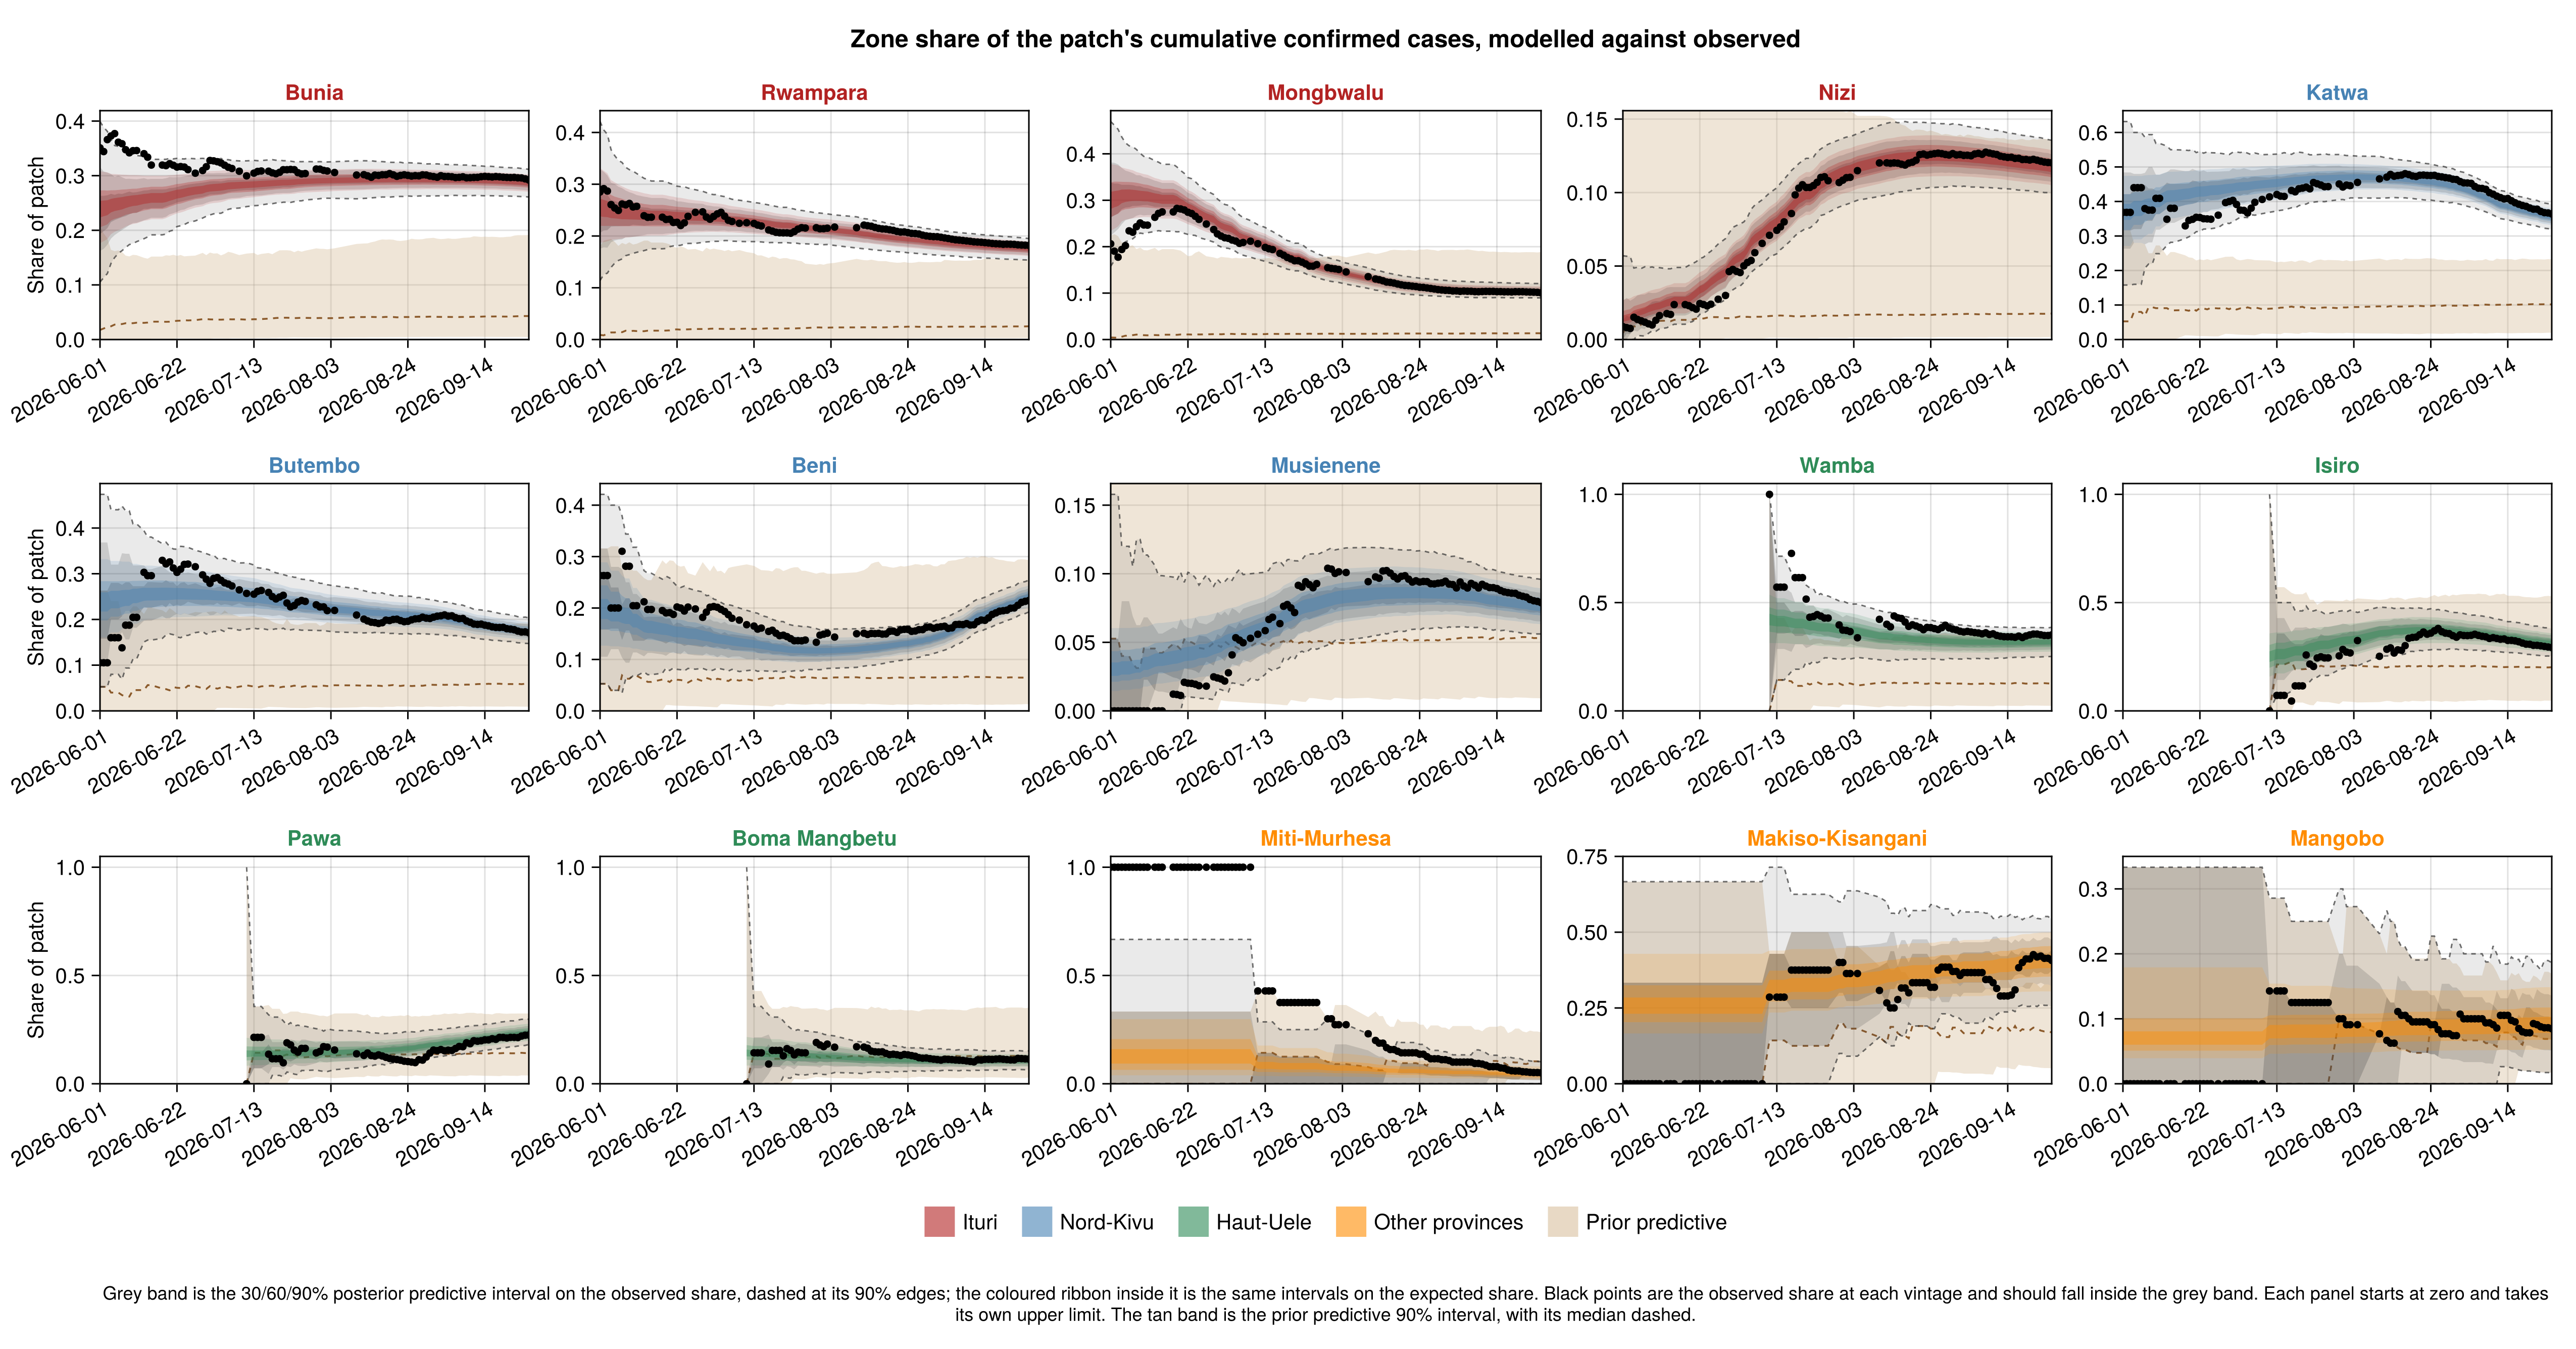
The panels show, for the zones with the largest observed shares, the modelled share of the patch's confirmed cases at each vintage against the observed one. Each panel carries three bands: the tan prior predictive share, the grey posterior predictive interval on the observed share, and the coloured ribbon of the expected share inside it. The observed points should fall inside the grey band. A zone with a handful of cases per vintage has an observed share that jumps between zero and one, and its band spans the same range. The second figure is the same check on the cumulative allocation, each zone's share of its patch's cumulative allocated cases at every vintage.
Zone case composition predictive checks
# Per-draw expected, predictive and observed zone shares at every vintage,
# from the posterior and from the zone prior, per vintage and cumulative.
zone_ppc = zone_composition_draws(chn_local, zone_inputs);
zone_ppc_prior = zone_composition_draws(prior_chn_zone, zone_inputs);
zone_ppc_cum = zone_composition_draws(
    chn_local, zone_inputs;
    cumulative = true
);
zone_ppc_prior_cum = zone_composition_draws(
    prior_chn_zone, zone_inputs;
    cumulative = true
);
zone_ppc_fig = plot_zone_shares(
    zone_ppc.expected, zone_ppc.observed,
    zone_inputs.dates, zone_inputs.zone_labels;
    zone_patch, patch_labels = zone_inputs.patch_labels,
    pred_draws = zone_ppc.predictive_share,
    prior_draws = zone_ppc_prior.predictive_share, top = 15, ncols = 5
);
zone_ppc_cum_fig = plot_zone_shares(
    zone_ppc_cum.expected,
    zone_ppc_cum.observed, zone_inputs.dates, zone_inputs.zone_labels;
    zone_patch, patch_labels = zone_inputs.patch_labels,
    pred_draws = zone_ppc_cum.predictive_share,
    prior_draws = zone_ppc_prior_cum.predictive_share, top = 15, ncols = 5,
    title = "Zone share of the patch's cumulative confirmed cases, " *
        "modelled against observed"
);
Confirmed deaths
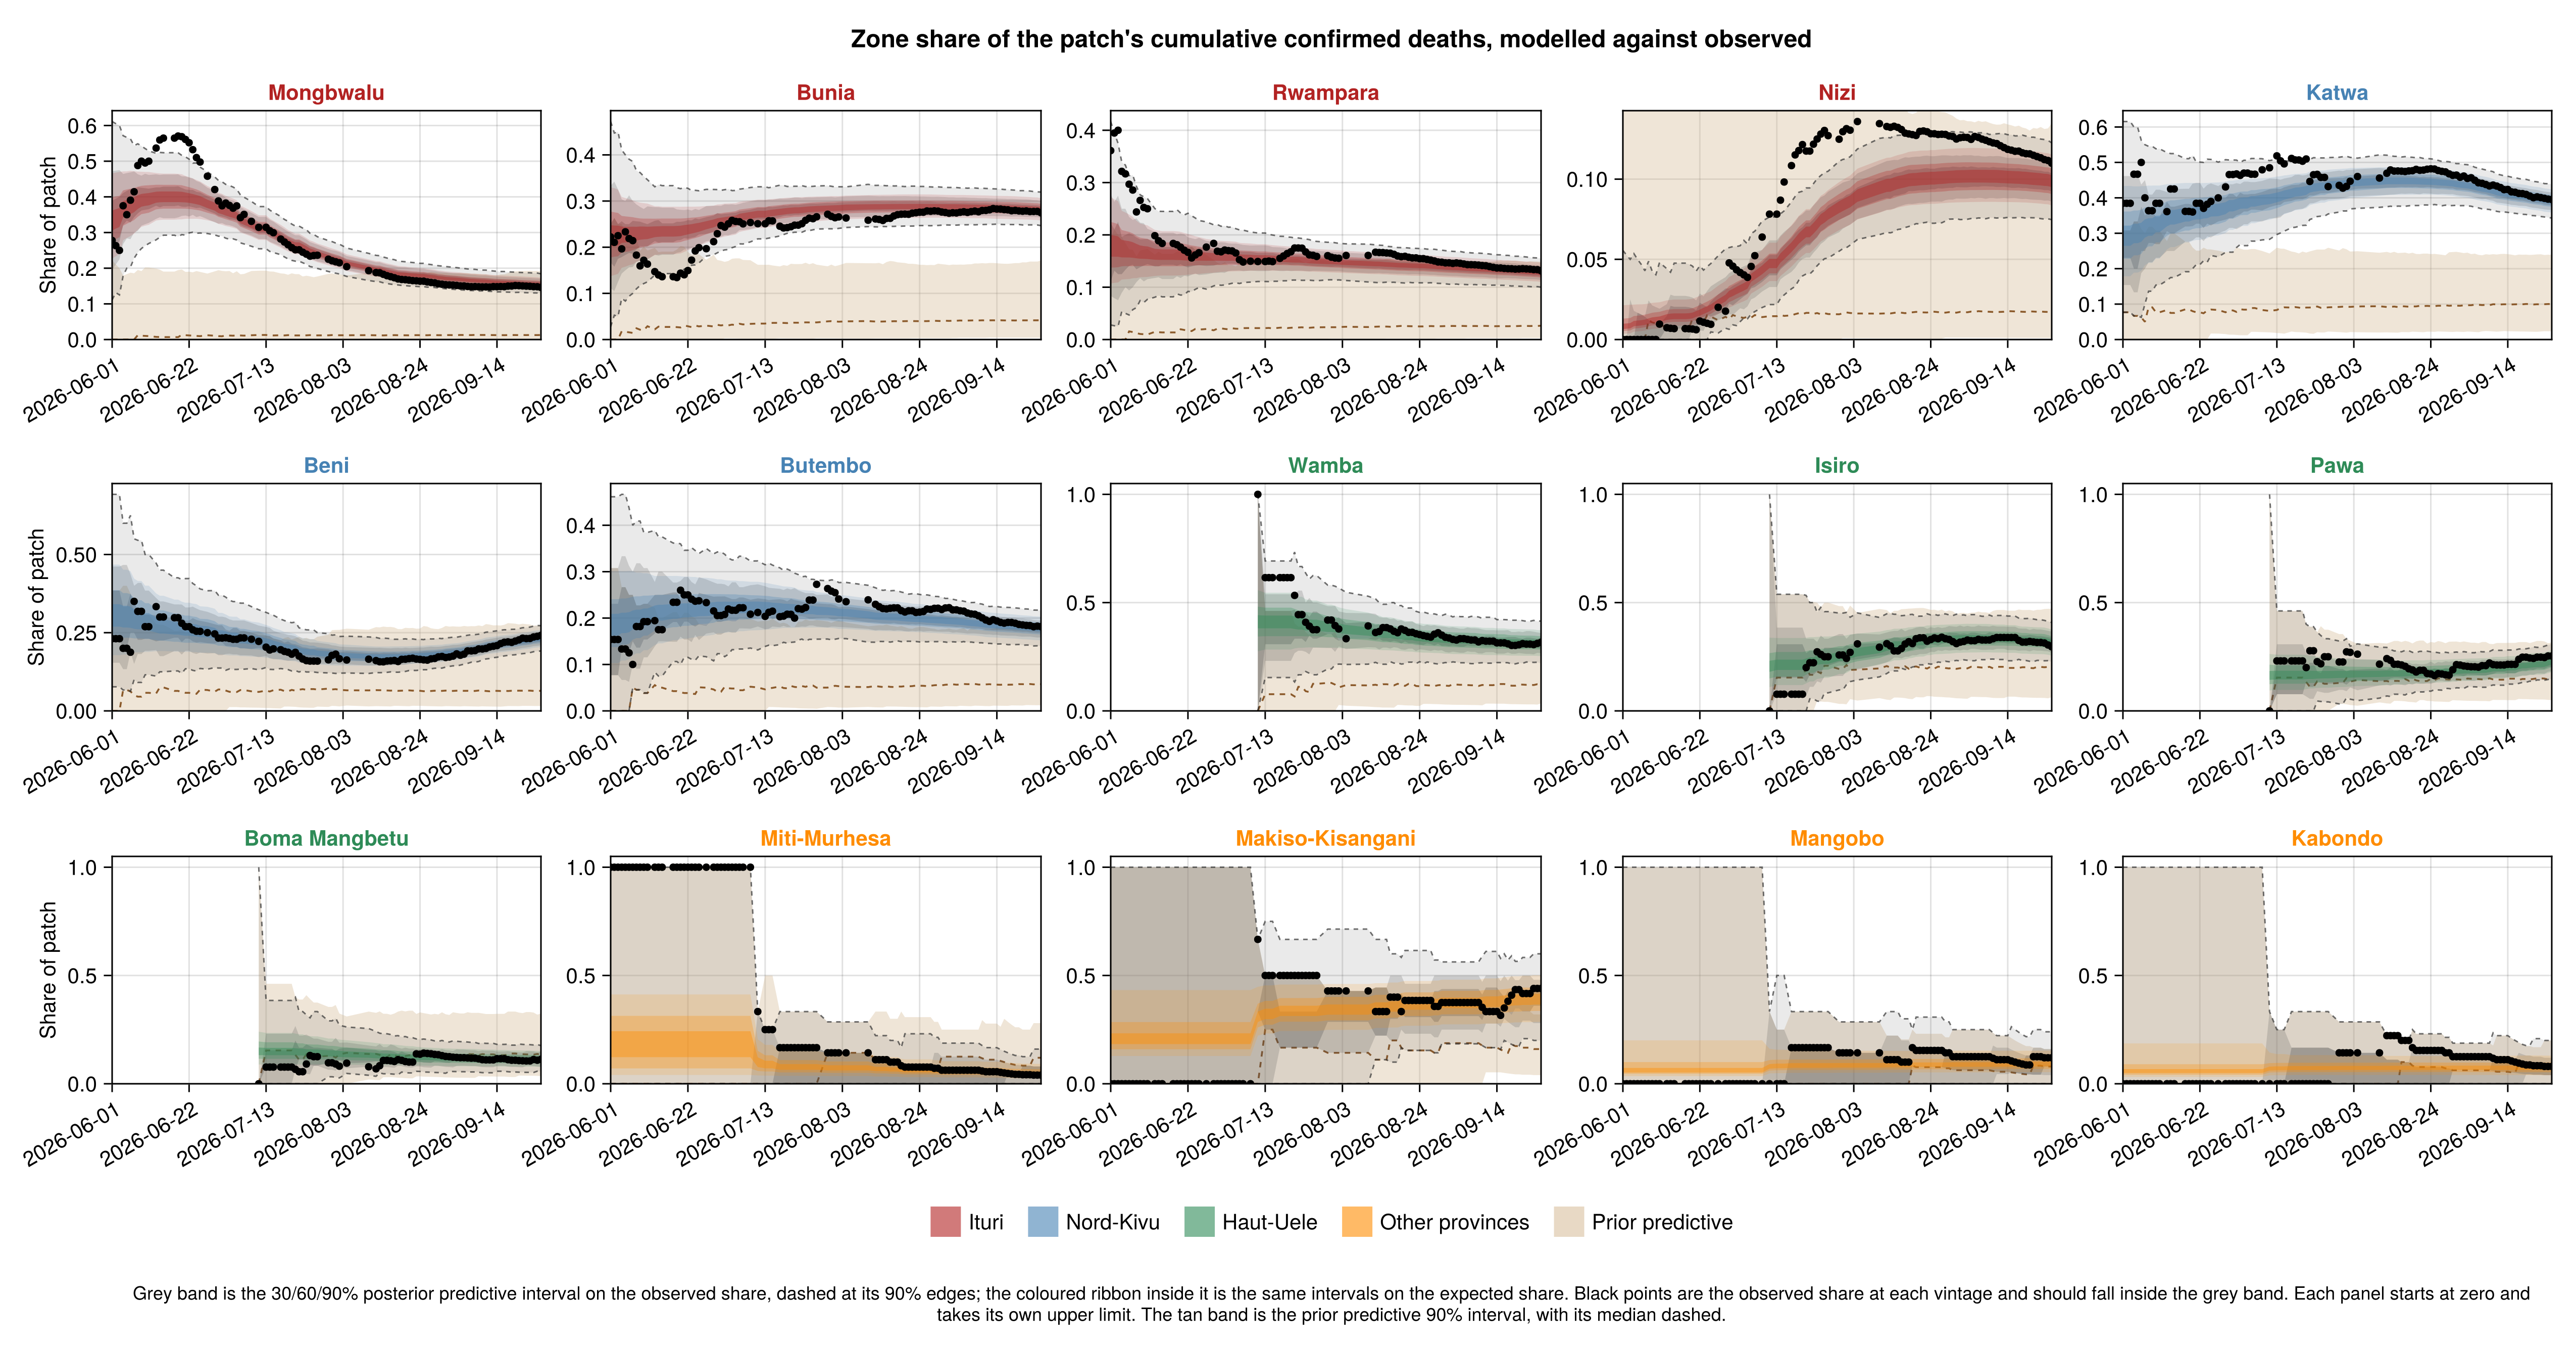
The same check on the death composition, over the zones with the largest observed death shares. Most per-vintage death cells are empty, so the check is read on the cumulative allocation, each zone's share of its patch's cumulative allocated deaths at every vintage.
Zone death composition predictive check
zone_death_ppc_cum = zone_composition_draws(
    chn_local, zone_inputs;
    stream = :deaths, cumulative = true
);
zone_death_ppc_prior_cum = zone_composition_draws(
    prior_chn_zone, zone_inputs;
    stream = :deaths, cumulative = true
);
zone_death_ppc_cum_fig = plot_zone_shares(
    zone_death_ppc_cum.expected, zone_death_ppc_cum.observed,
    zone_inputs.dates, zone_inputs.zone_labels;
    zone_patch, patch_labels = zone_inputs.patch_labels,
    pred_draws = zone_death_ppc_cum.predictive_share,
    prior_draws = zone_death_ppc_prior_cum.predictive_share,
    top = 15, ncols = 5,
    title = "Zone share of the patch's cumulative confirmed deaths, " *
        "modelled against observed"
);
Zone composition calibration
The calibration table scores both compositions the way the stream calibration scores the national streams, over every zone and vintage of each patch: the mean bias of the predictive allocation and the fractions of observed zone counts inside the central 50% and 90% predictive intervals. A cell with no case or death is covered by any interval that includes zero, so the coverage is read with the share of empty cells in mind.
Zone composition calibration
# The two compositions in one table, each patch row named by the
# composition it belongs to so the calibration plot reads them apart.
zone_calibration_table = let
    function tagged(stream, what)
        tbl = zone_composition_calibration(
            chn_local, zone_inputs; stream = stream
        )
        tbl[!, "Stream"] = string.(tbl[!, "Stream"], " ($what)")
        return tbl
    end
    vcat(tagged(:cases, "cases"), tagged(:deaths, "deaths"))
end;
zone_calibration_fig = plot_stream_calibration(zone_calibration_table);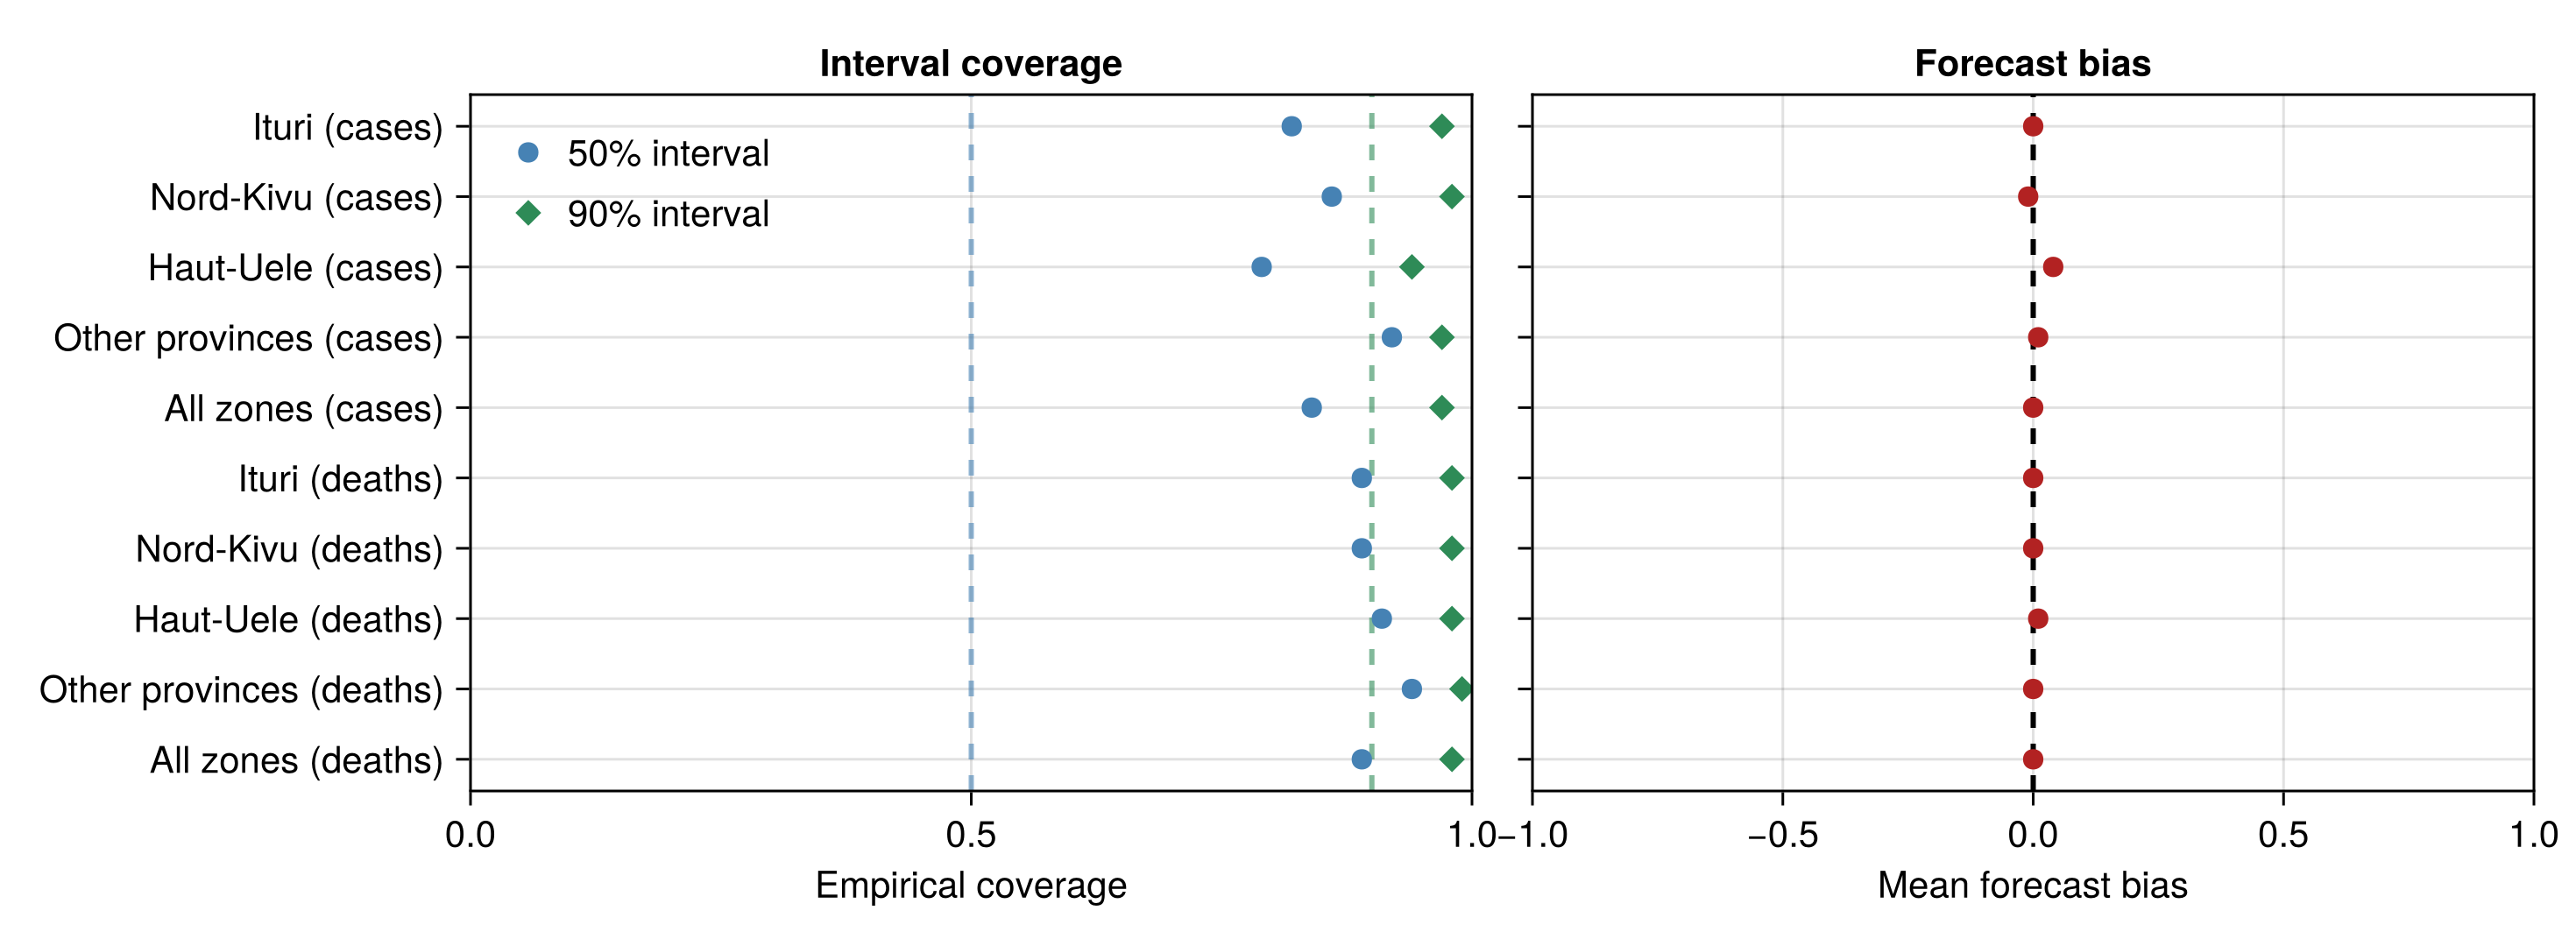
| Stream | Vintages | Bias | 50% coverage | 90% coverage |
|---|---|---|---|---|
| Ituri (cases) | 2744 | 0 | 0.82 | 0.97 |
| Nord-Kivu (cases) | 1488 | -0.01 | 0.86 | 0.98 |
| Haut-Uele (cases) | 420 | 0.04 | 0.79 | 0.94 |
| Other provinces (cases) | 384 | 0.01 | 0.92 | 0.97 |
| All zones (cases) | 5036 | 0 | 0.84 | 0.97 |
| Ituri (deaths) | 2688 | 0 | 0.89 | 0.98 |
| Nord-Kivu (deaths) | 1408 | 0 | 0.89 | 0.98 |
| Haut-Uele (deaths) | 336 | 0.01 | 0.91 | 0.98 |
| Other provinces (deaths) | 240 | 0 | 0.94 | 0.99 |
| All zones (deaths) | 4672 | 0 | 0.89 | 0.98 |
Saving zone in-sample outputs
Write the summary bullets
# The bullets under the summary heading at the top of the page. They read
# the calibration table built further down, so they are written here and
# read back when the site is assembled.
evaluation_insample_zone_summary = let
    fmt(x) = ismissing(x) || !isfinite(x) ? "n/a" :
        string(round(x; digits = 2))
    # The per-patch rows only: the table's "All zones" rows pool them and
    # would be counted twice.
    fitted = filter(
        r -> isfinite(r["Bias"]) && !startswith(r["Stream"], "All zones"),
        zone_calibration_table
    )
    worst = first(
        sort(fitted, "Bias"; by = abs, rev = true), min(3, size(fitted, 1))
    )
    low = first(sort(fitted, "90% coverage"), min(1, size(fitted, 1)))
    overall = [
        string(
            "- **Least well reproduced:** ",
            join(
                [
                    string(
                        r["Stream"], " (bias ", fmt(r["Bias"]),
                        ", 90% coverage ", fmt(r["90% coverage"]), ")"
                    )
                        for r in eachrow(worst)
                ], "; "
            ), "."
        ),
        string(
            "- **Coverage:** ", count(>=(0.8), fitted[!, "90% coverage"]),
            " of ", size(fitted, 1),
            " composition rows have 90% coverage of at least 0.8",
            size(low, 1) == 0 ? "." :
                string(
                    "; the lowest is ", low[1, "Stream"], " at ",
                    fmt(low[1, "90% coverage"]), "."
                )
        ),
    ]
    rows(tbl) = Dict(r["Stream"] => r for r in eachrow(tbl))
    cal = rows(zone_calibration_table)
    function calibration(p, what, label)
        r = get(cal, string(PROVINCE_LABELS[p], " (", what, ")"), nothing)
        r === nothing && return string("- ", label, ": not scored.")
        return string(
            "- ", label, ": bias ", fmt(r["Bias"]), " and 90% coverage ",
            fmt(r["90% coverage"]), " over ", r["Vintages"], " cells."
        )
    end
    detail = [
        join(
            [
                string("**", PROVINCE_LABELS[p], "**"), "",
                calibration(p, "cases", "Confirmed cases"),
                calibration(p, "deaths", "Confirmed deaths"),
            ], "\n"
        )
            for p in 1:N_PATCHES
    ]
    join(vcat([join(overall, "\n")], detail), "\n\n")
end
dashboard_dir = joinpath(
    pkgdir(BVDOutbreakSize), "docs", "src", "summary_assets"
)
mkpath(dashboard_dir)
write(
    joinpath(dashboard_dir, "evaluation_insample_zone.md"),
    evaluation_insample_zone_summary
);