Province forecast evaluation
How the province forecasts on the province forecasts page have scored against what each province went on to report. Scoring follows the national forecast evaluation, against the same persistence baseline. The in-sample province checks are on the province in-sample checks page.
Load packages, data and fitted chains
# Shared setup: packages, observations and the fit registry. See
# `docs/pages/_setup.jl`.
using BVDOutbreakSize
include(joinpath(pkgdir(BVDOutbreakSize), "docs", "pages", "_setup.jl"))
validation_forecast_from (generic function with 1 method)# The fits this page reads, loaded from the cache here.
frozen_lastweek = load_fit("frozen_validation");
chn_joint = load_fit("joint");Summary
The overall bullets come first, then a short block per province, from the scores further down this page. Relative skill is the model's CRPS over the persistence baseline's, so a value below one beats the baseline.
- Forecasts: no province forecast has been scored yet. This fills in as releases carrying the per-province projection accumulate.
Ituri
- No scored forecast yet.
Nord-Kivu
- No scored forecast yet.
Haut-Uele
- No scored forecast yet.
Other provinces
- No scored forecast yet.
Forecast by province
The frozen fit's one-week-ahead forecast of each province's confirmed cases and deaths, scored against what each province went on to report. The forecast is defined in the province forecast Methods section. Every release's archived province forecast is scored against what has since been observed in Forecast by province across releases.
Province forecast against observed
# The frozen fit's one-week-ahead national forecast, the same one the
# forecast evaluation page validates. `validation_forecast_from` is defined
# in the shared setup.
validation_forecast = validation_forecast_from("frozen_validation");

# Per-province cumulative confirmed cases and deaths at the frozen cut-off
# and at the current one, so the truth for the week is their difference.
# Read off the same increment matrices the compositions are scored on, so
# the clamped revision is treated identically on both sides.
province_truth = let
    cur_c = province_increment_matrix(
        obs.province_confirmed_history,
        PROVINCE_NAMES, N_PATCHES
    )
    cur_d = province_increment_matrix(
        obs.province_death_history,
        PROVINCE_NAMES, N_PATCHES
    )
    froz_c = province_increment_matrix(
        frozen_lastweek.o.province_confirmed_history,
        PROVINCE_NAMES, N_PATCHES
    )
    froz_d = province_increment_matrix(
        frozen_lastweek.o.province_death_history, PROVINCE_NAMES, N_PATCHES
    )
    (;
        observed = vec(sum(cur_c.increments; dims = 2)),
        baseline = vec(sum(froz_c.increments; dims = 2)),
        death_observed = vec(sum(cur_d.increments; dims = 2)),
        death_baseline = vec(sum(froz_d.increments; dims = 2)),
    )
end

province_validation_table = province_forecast_vs_truth(
    fit_forecast("frozen_validation"), validation_forecast;
    observed = province_truth.observed,
    baseline = province_truth.baseline,
    death_observed = province_truth.death_observed,
    death_baseline = province_truth.death_baseline,
    n_patches = N_PATCHES
);| Province | Stream | Lower 90% | Upper 90% | Observed | Within 90% PI |
|---|---|---|---|---|---|
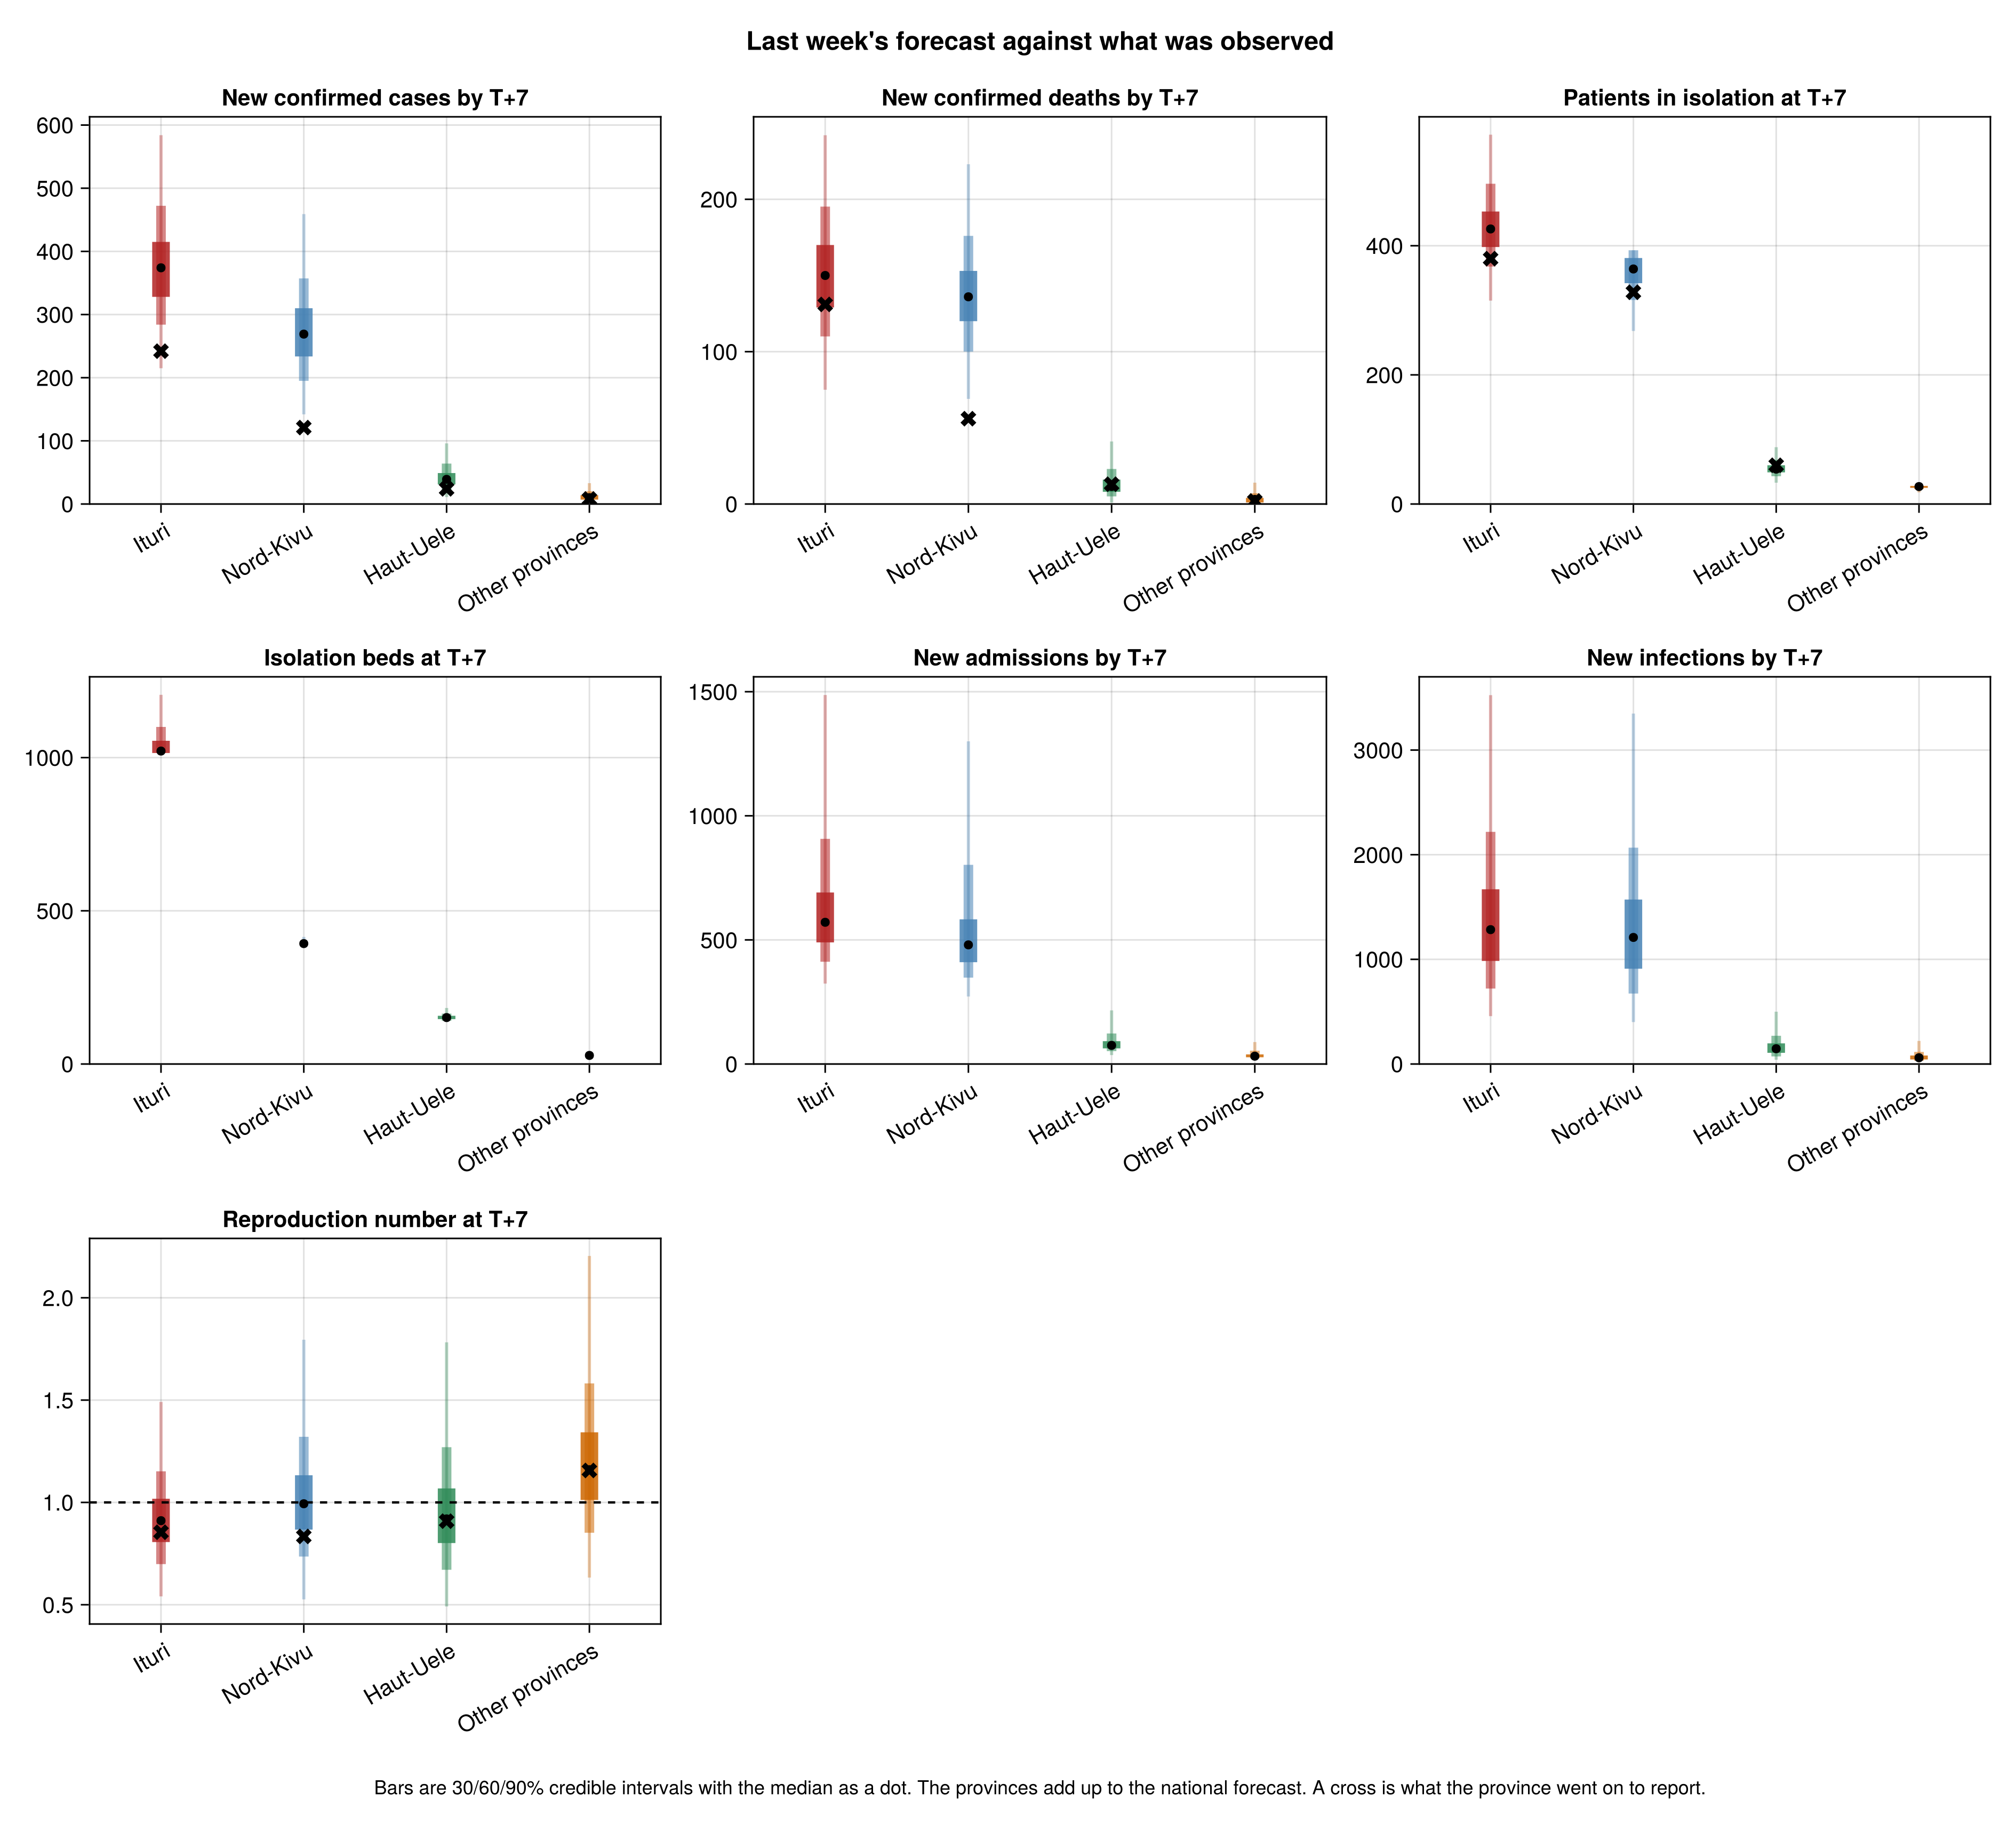
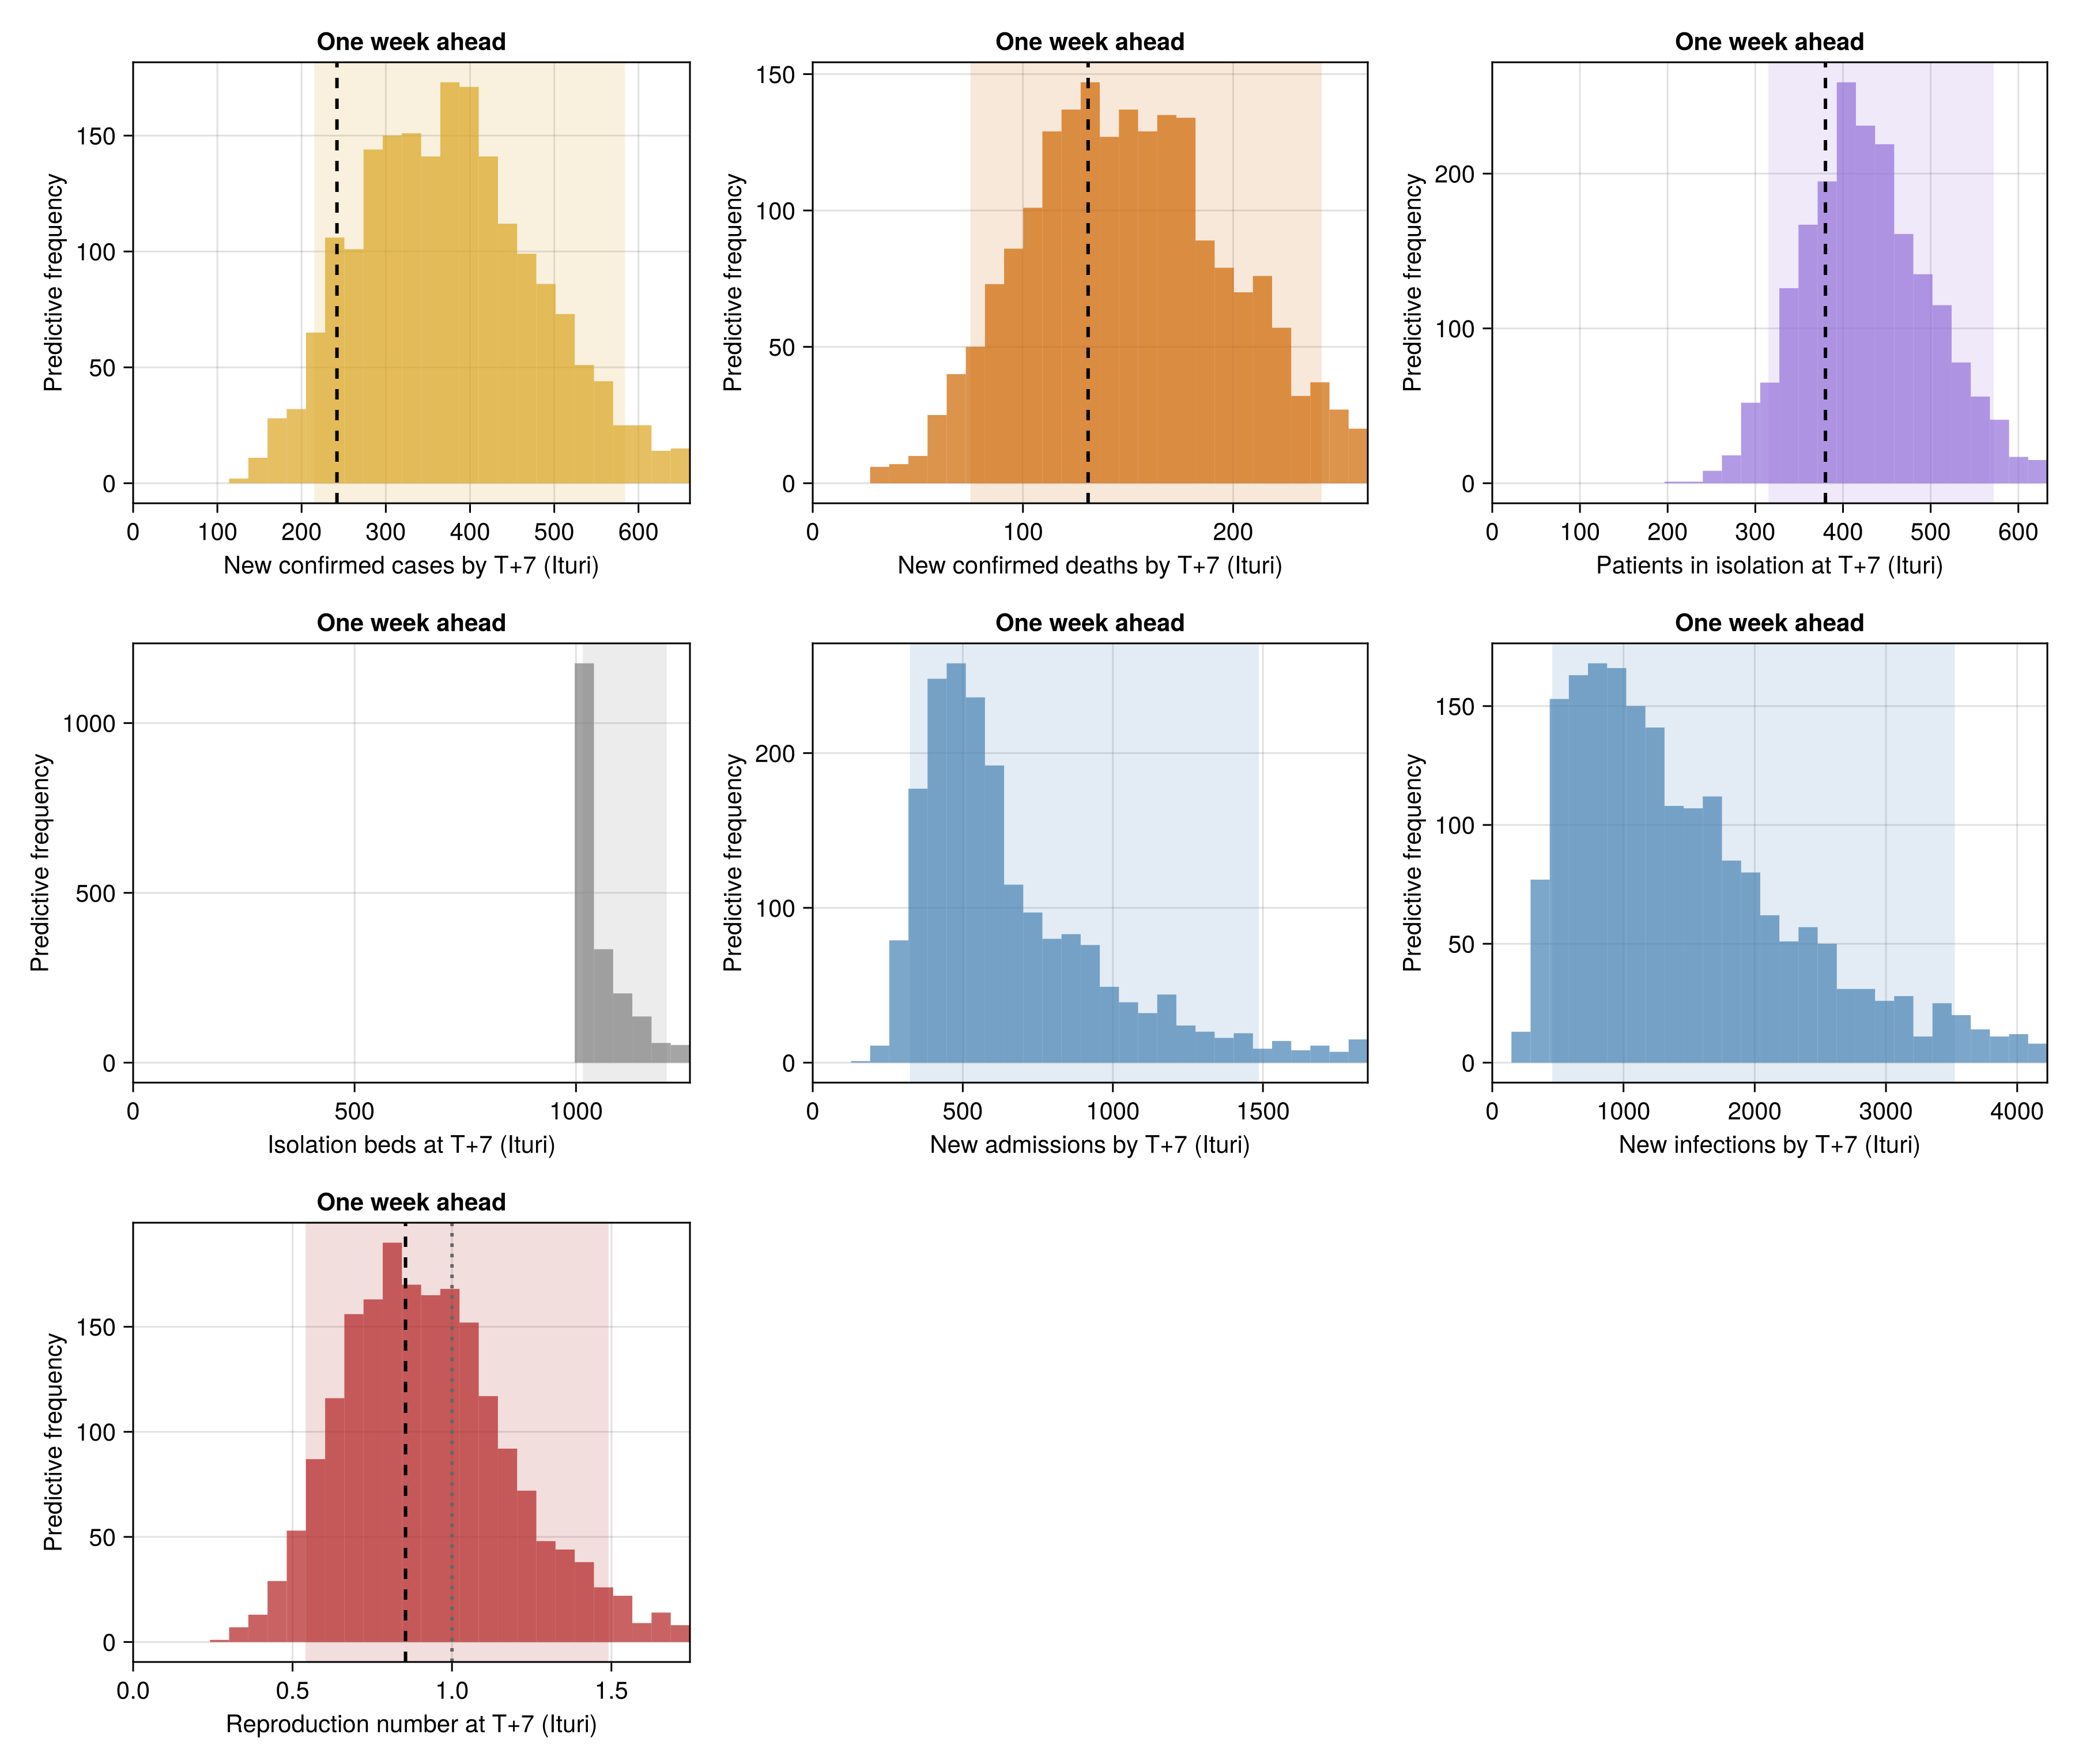
| Ituri | Confirmed cases | 215 | 584 | 242 | true |
| Ituri | Confirmed deaths | 75 | 242 | 131 | true |
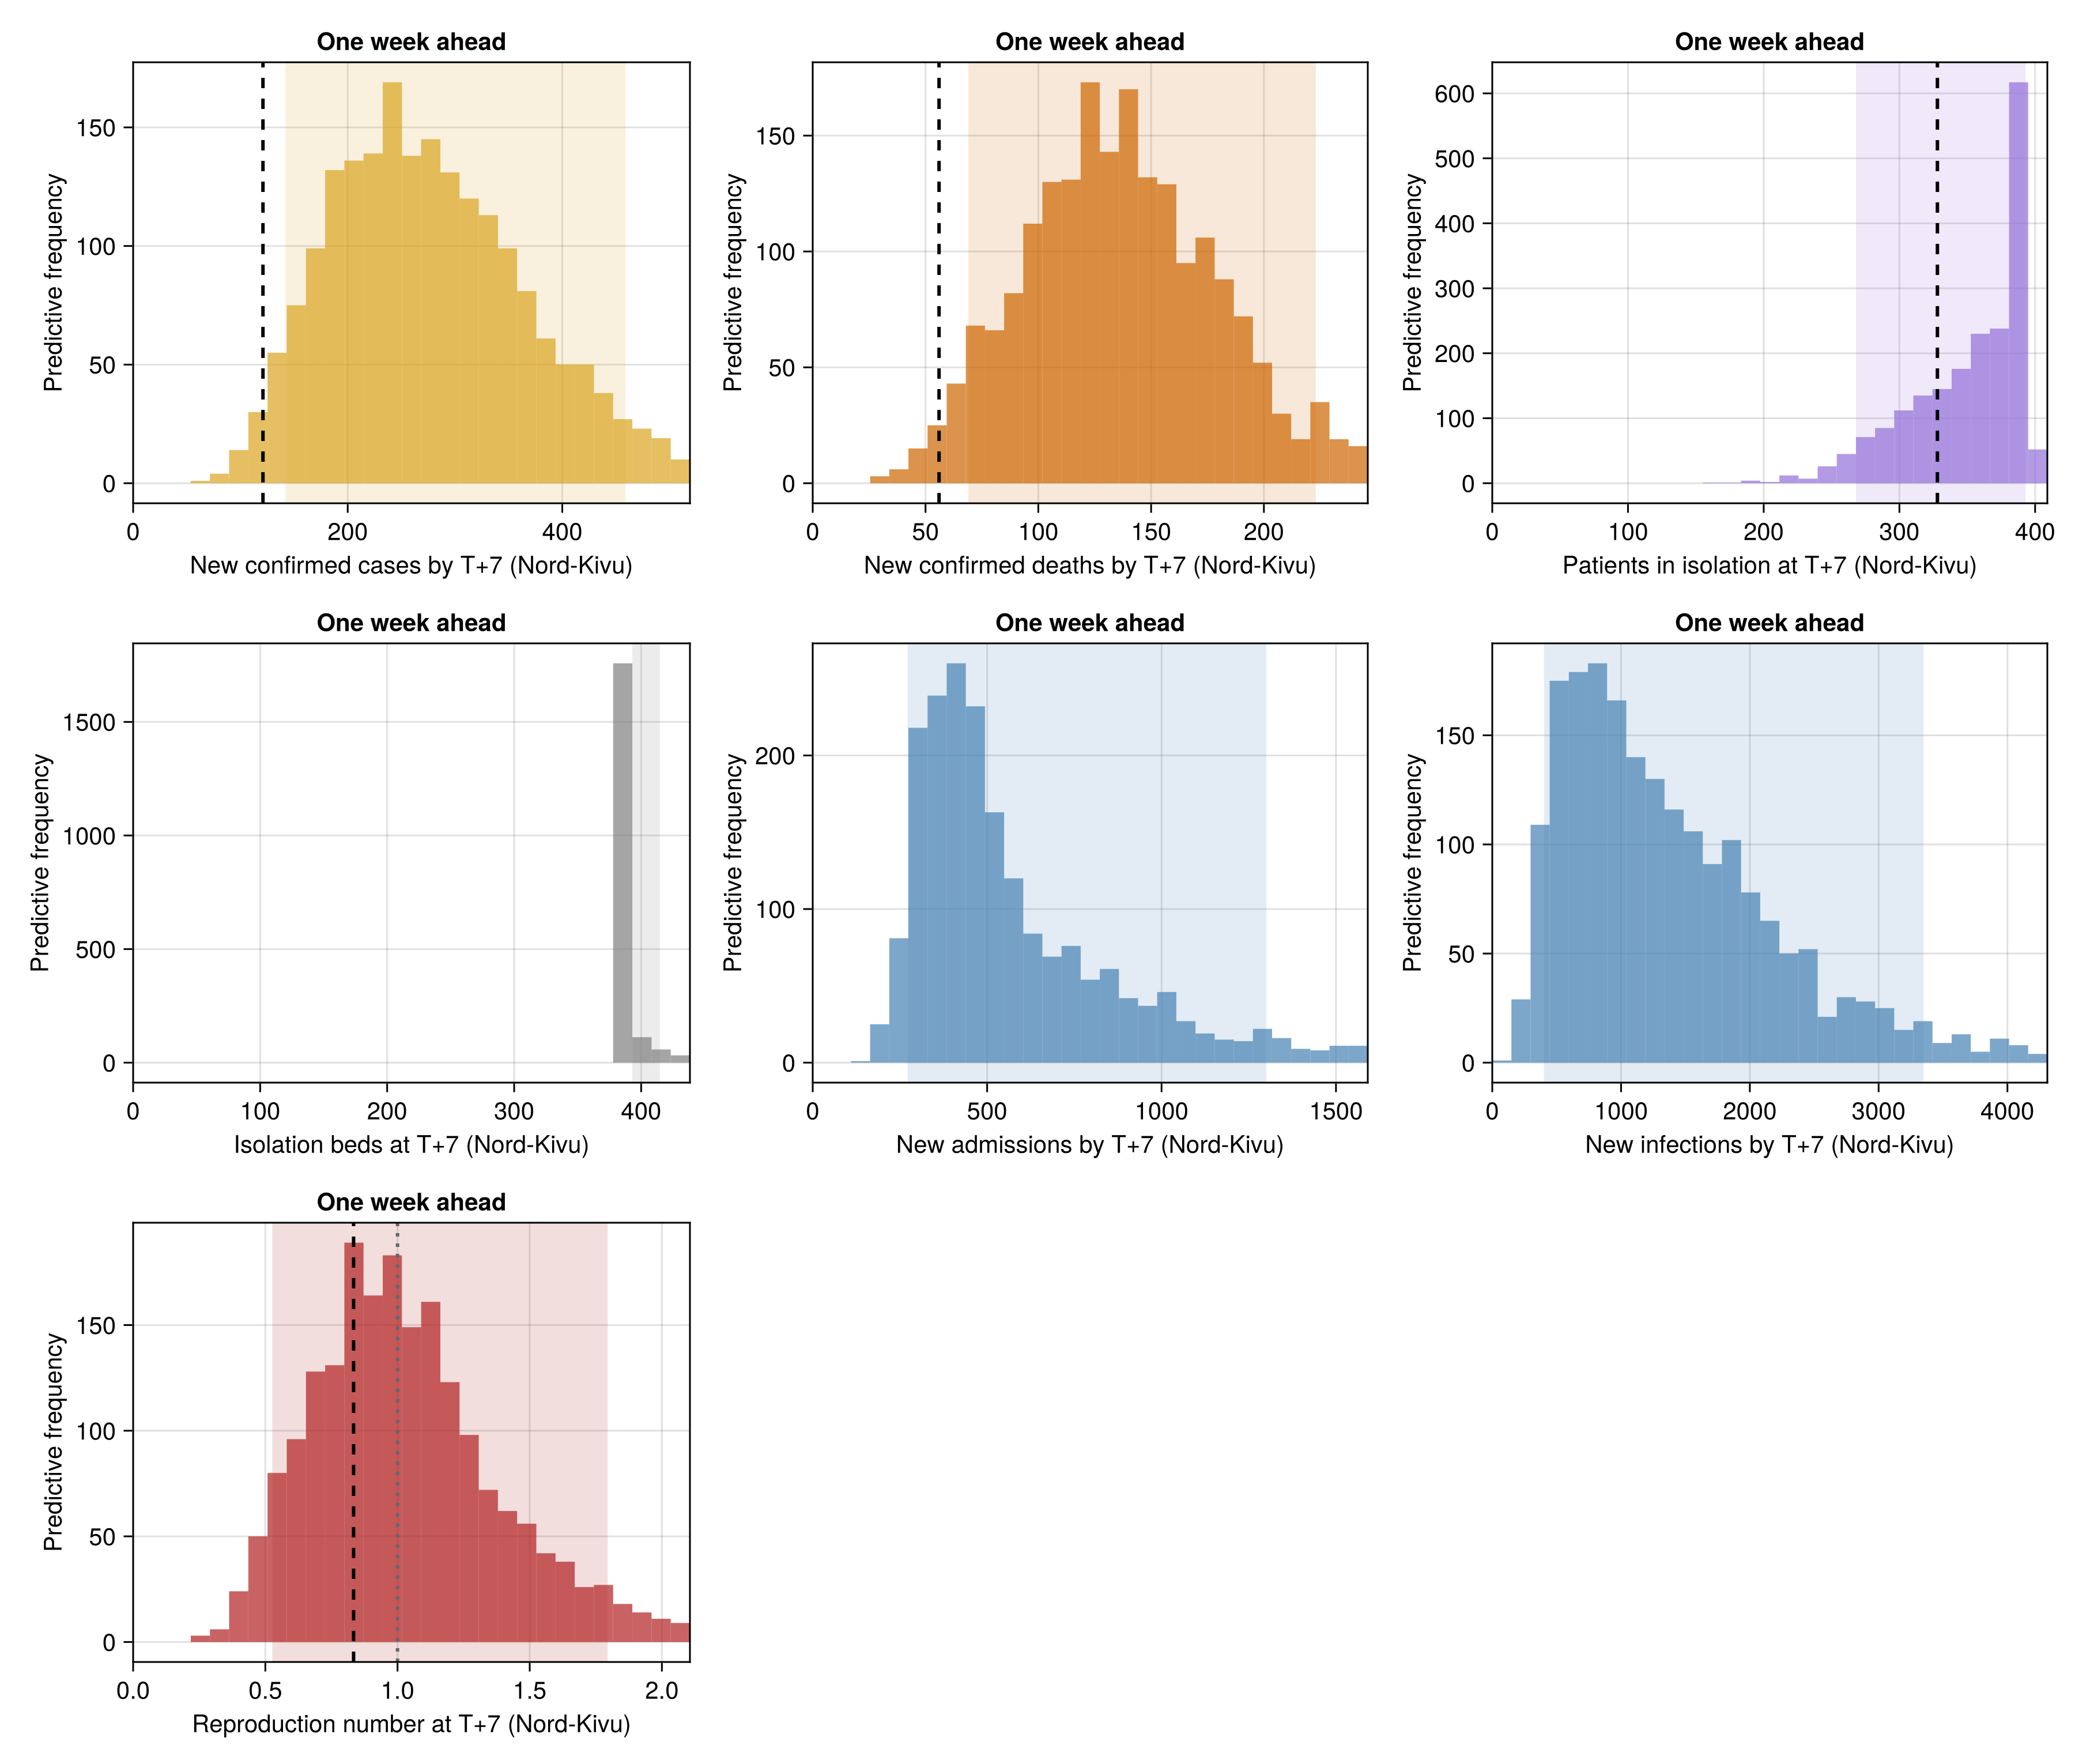
| Nord-Kivu | Confirmed cases | 142 | 459 | 121 | false |
| Nord-Kivu | Confirmed deaths | 69 | 223 | 56 | false |
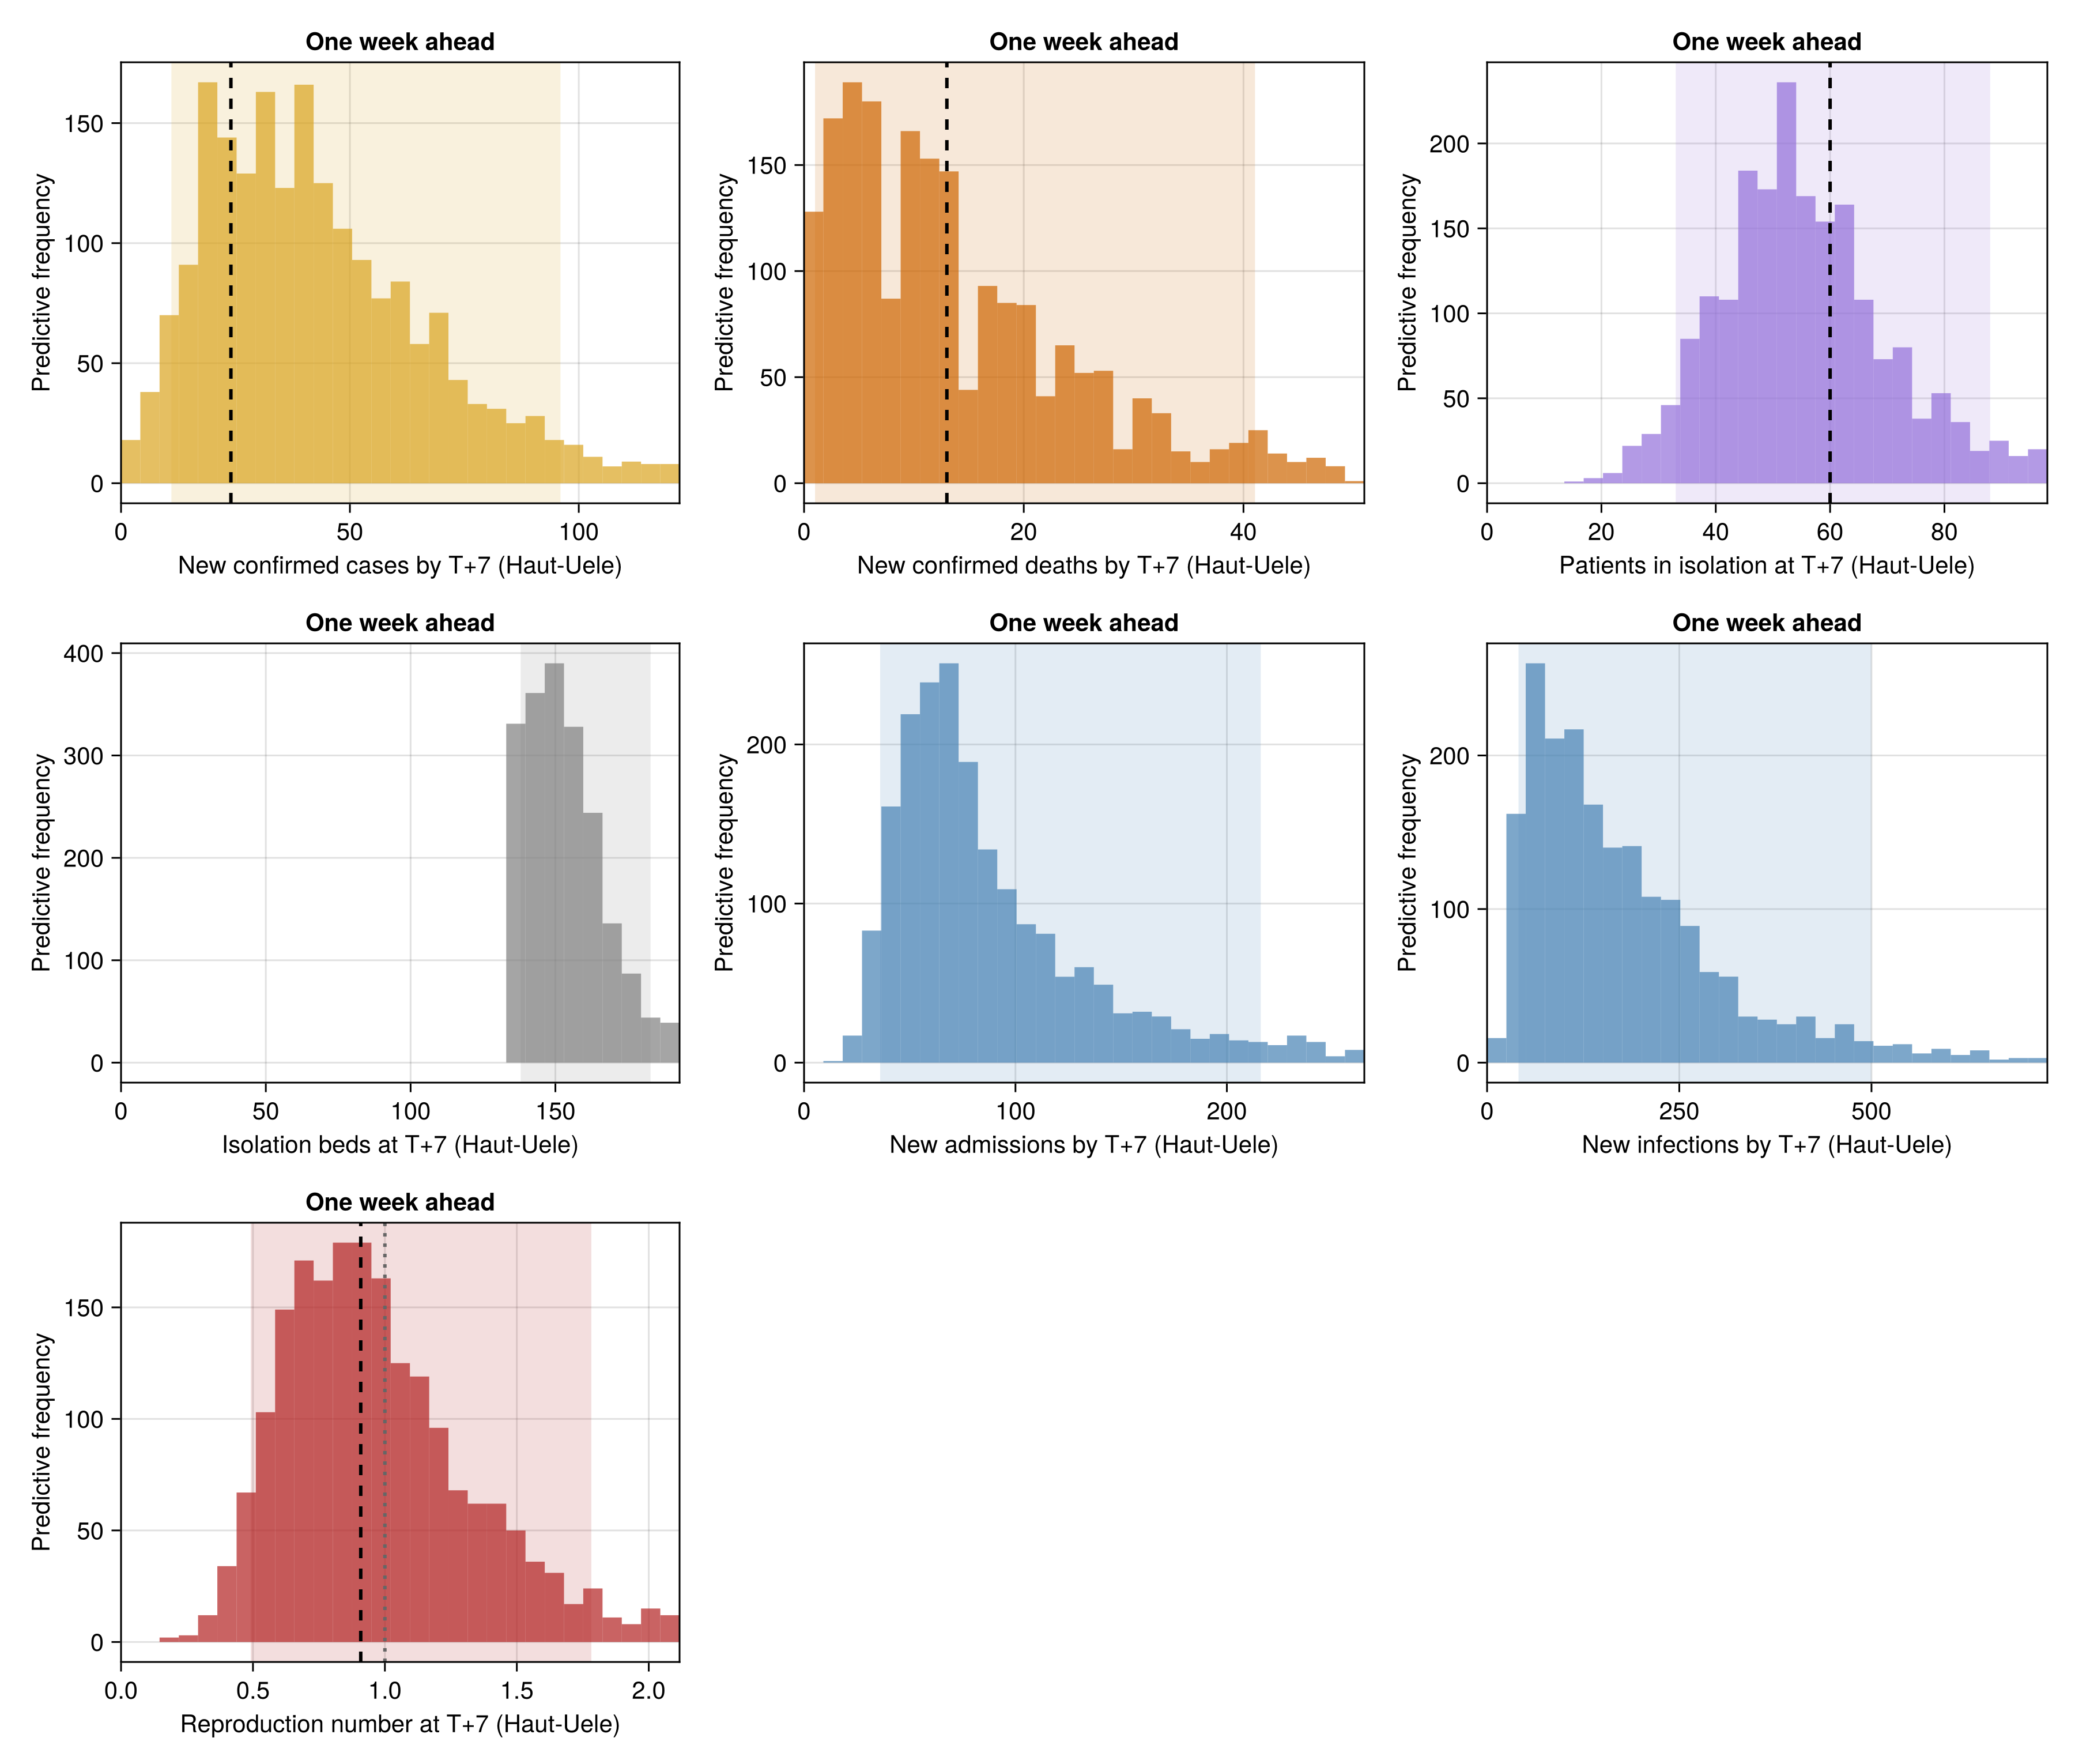
| Haut-Uele | Confirmed cases | 11 | 96 | 24 | true |
| Haut-Uele | Confirmed deaths | 1 | 41 | 13 | true |
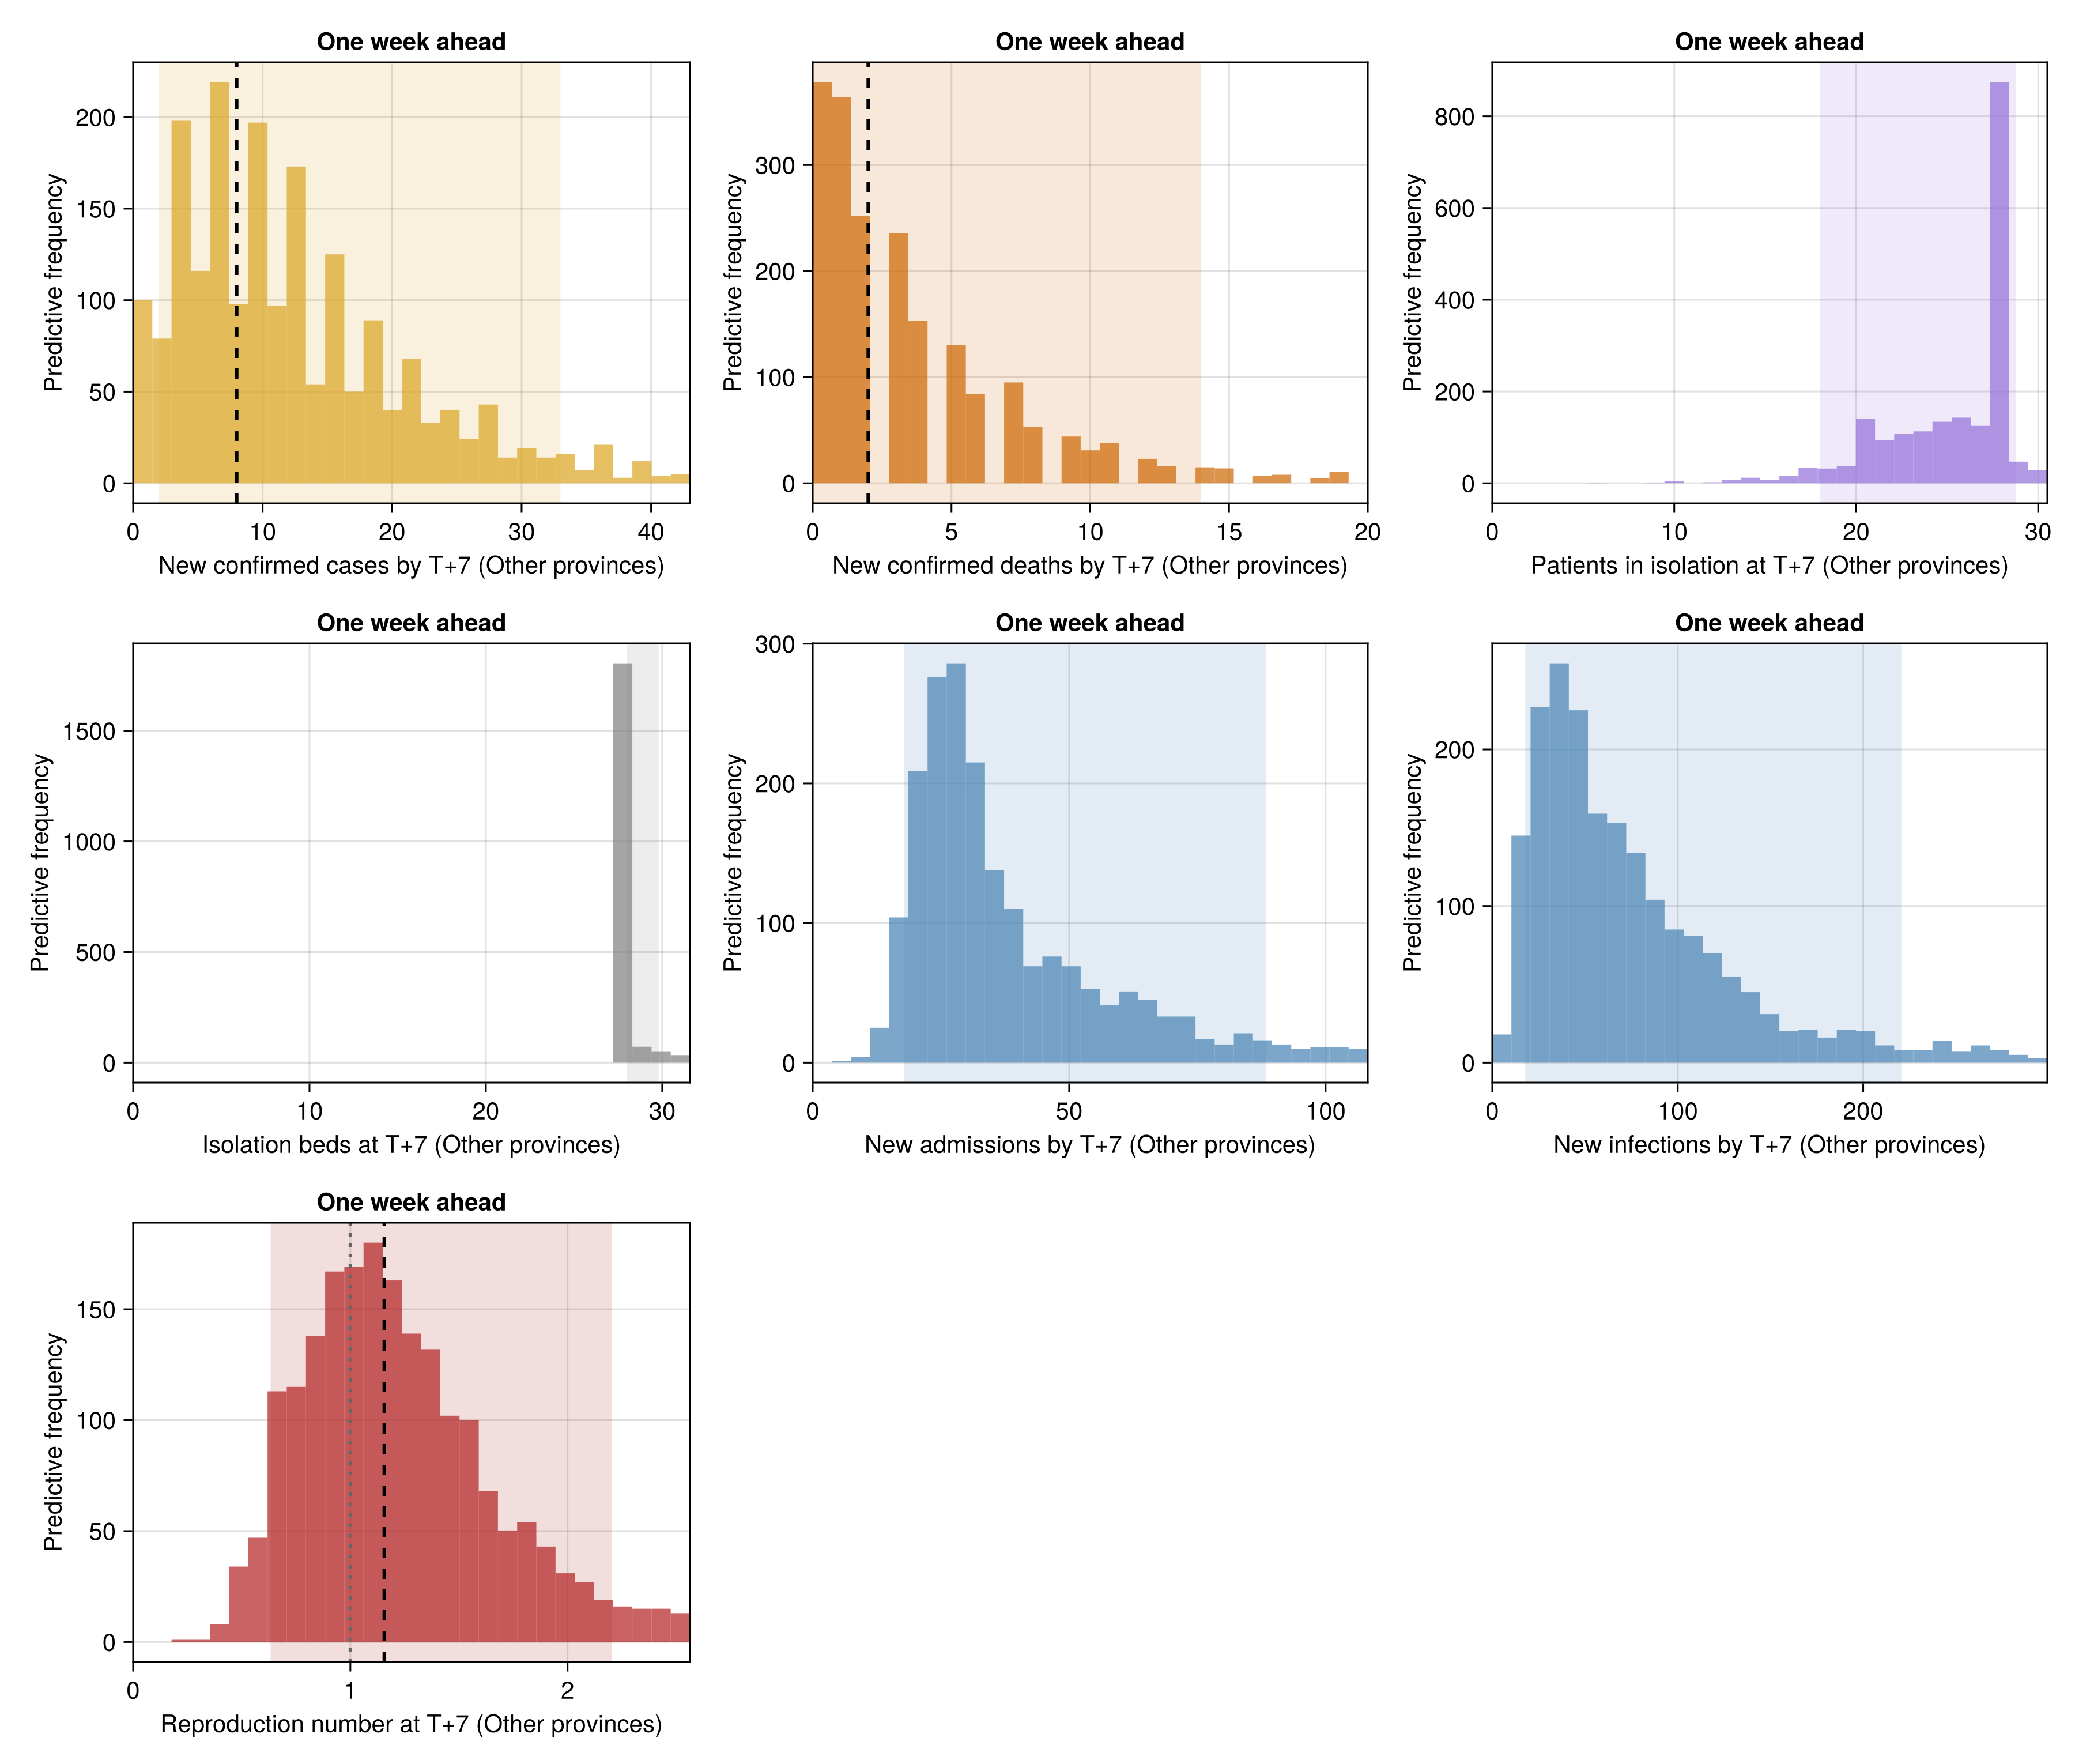
| Other provinces | Confirmed cases | 2 | 33 | 8 | true |
| Other provinces | Confirmed deaths | 0 | 14 | 2 | true |
The same forecast against what each province went on to report, one panel per target. A cross marks the observed count over the week for the cases and deaths, the patients in isolation on the target day where the province printed them, and the current fit's reproduction number at the cut-off.
Build the forecast-versus-observed figures
frozen_province_draws = fit_forecast("frozen_validation");
frozen_province_projection = forecast_provinces(
    frozen_province_draws; horizon = 7, n_patches = N_PATCHES
);
# The patients in isolation each province printed on the target day, the
# current cut-off, or `NaN` where it printed nothing that day.
province_isolation_now = let
    rows = province_care_observations(
        obs.province_isolation_history, PROVINCE_NAMES
    )
    v = fill(NaN, N_PATCHES)
    for (d, p, c) in zip(rows.days, rows.patches, rows.counts)
        d == obs.n && p <= N_PATCHES && (v[p] = c)
    end
    v
end
province_rt_now = province_map_summary(
    chn_joint, :R_T_patch, N_PATCHES
).values
province_observed = (;
    confirmed_new = province_truth.observed .- province_truth.baseline,
    confirmed_deaths_new = province_truth.death_observed .-
        province_truth.death_baseline,
    isolation_level = province_isolation_now,
    rt_forecast = province_rt_now,
)
province_vs_observed_fig = plot_province_forecast(
    frozen_province_draws, frozen_province_projection;
    n_patches = N_PATCHES, observed = province_observed,
    title = "Last week's forecast against what was observed"
);
province_vs_observed_detail(p) = plot_province_forecast_detail(
    frozen_province_draws, frozen_province_projection;
    province = p, n_patches = N_PATCHES,
    observed = NamedTuple(
        k => v[p] for (k, v) in pairs(province_observed) if isfinite(v[p])
    )
);
Each province's forecast, with the dashed rule at what it went on to report.
Ituri
Nord-Kivu
Haut-Uele
Other provinces
Forecast by province across releases
The archived province forecast of each release, scored against what each province went on to report, with a window holding a harmonisation-break day left unscored because that day's backfill is published for the country and not by province. Only province forecast projections are scored. The scores fill in as releases carrying them become old enough for their targets to have been observed. The joint patch model is the only model that forecasts the provinces, so every table here is the joint model's, one row per stream and province.
Load and summarise the province forecast scores
province_scores_df = _release_data(
    "province_forecast_scores.csv",
    (;
        release = String, made_date = Date, stream = String, horizon = Int,
        target_date = Date, fit = String, crps = Float64,
        log_crps = Float64, dispersion = Float64, overprediction = Float64,
        underprediction = Float64, coverage_50 = Float64,
        coverage_90 = Float64,
        bias = Float64, n_samples = Int,
        log_rel_to_baseline = Float64,
    )
)
# There is no individual single-stream fit to compare against, and `fit` is
# single-valued by construction once the baseline is set aside. Both are
# dropped rather than rendered as columns that cannot vary. The figures
# keep the full tables, since they compare the joint against the baseline.
province_score_by_horizon_table = forecast_score_by_horizon(
    province_scores_df
)
province_score_by_release_table = forecast_score_by_release(
    province_scores_df
)
_province_display(tbl) = drop_degenerate_fit_column(
    drop_individual_fit_columns(tbl)
)
province_score_overview_display = _province_display(
    forecast_score_overview(province_scores_df)
)
province_score_by_horizon_display = _province_display(
    province_score_by_horizon_table
)
# See the comment on `joint_score_by_release_table` on the forecast
# evaluation page for why this setup chunk's last statement needs a
# trailing `;`.
province_score_by_release_display = _province_display(
    province_score_by_release_table
);

_province_empty = "No scored province forecasts yet. This fills in as " *
    "releases carrying the per-province projection accumulate.";
# A plain statement above the tables when nothing is scored yet, and
# nothing otherwise.
province_scores_note = size(province_scores_df, 1) == 0 ?
    Markdown.parse(
        "No province forecast has been scored yet. This section fills in " *
        "as releases carrying the per-province projection accumulate."
    ) : nothing;
No province forecast has been scored yet. This section fills in as releases carrying the per-province projection accumulate.
| stream | fit | n | crps | rel_to_baseline | log_crps | log_rel_to_baseline | dispersion | overprediction | underprediction | coverage_50 | coverage_90 | bias | | — | — | —: | —: | —: | —: | —: | —: | —: | —: | —: | —: | —: |
The relative skill against the baseline by horizon, one panel per stream and province, on a log-scaled skill axis with the reference line at one.
province_relative_skill_fig = plot_forecast_relative_skill(
    province_score_by_horizon_table; empty_message = _province_empty
);
What that error is made of, by horizon: the mean CRPS split into its width, its overprediction and its underprediction.
province_crps_by_horizon_fig = plot_forecast_crps_by_horizon(
    province_score_by_horizon_table;
    title = "CRPS decomposition by horizon, by province",
    empty_message = _province_empty
);
Province scores by horizon
| stream | horizon | fit | n | crps | rel_to_baseline | log_crps | log_rel_to_baseline | dispersion | overprediction | underprediction | coverage_50 | coverage_90 | bias | | — | —: | — | —: | —: | —: | —: | —: | —: | —: | —: | —: | —: | —: |
The same relative skill release by release, so a run of releases that lost to the baseline reads as a run rather than as an average.
province_skill_by_cutoff_fig = plot_forecast_skill_by_cutoff(
    province_score_by_release_table;
    title = "Relative skill against the baseline by release, by province",
    empty_message = _province_empty
);
Province scores by release
| made_date | stream | fit | n | crps | rel_to_baseline | log_crps | log_rel_to_baseline | dispersion | overprediction | underprediction | coverage_50 | coverage_90 | bias | | — | — | — | —: | —: | —: | —: | —: | —: | —: | —: | —: | —: | —: |
Each release's province forecasts against what each province went on to report, one panel per province stream and horizon. The x-axis is the cut-off each forecast was made from. Each forecast shows its median and 90% predictive interval, beside the persistence baseline and the observed count.
Load the archived province forecasts and their outcomes
# Written by `scripts/score_releases.jl` from each release's
# `province_forecast.csv`, projection rows only, in the national overlay's
# schema. A missing file reads as an empty table.
evaluation_province_overlay_df = _release_data(
    joinpath("province", "forecast_overlay.csv"),
    (;
        release = String, made_date = Date, stream = String, horizon = Int,
        target_date = Date, fit = String, observed = Float64,
        median = Float64, lo30 = Float64, hi30 = Float64, lo60 = Float64,
        hi60 = Float64, lo90 = Float64, hi90 = Float64,
    )
)
evaluation_province_overlay_fig = plot_forecast_overlay(
    scored_overlay(evaluation_province_overlay_df);
    empty_message = _province_empty
);
Saving province forecast outputs
Write the summary bullets
# The bullets under the summary heading at the top of the page. They read
# tables built further down, so they are written here and read back when
# the site is assembled.
evaluation_forecast_province_summary = let
    fmt(x) = ismissing(x) || !isfinite(x) ? "n/a" :
        string(round(x; digits = 2))
    overview = forecast_score_overview(province_scores_df)
    # The archive labels each province stream `<stream> [<province name>]`.
    function scored(p)
        tag = string(" [", PROVINCE_NAMES[p], "]")
        rows = filter(
            r -> endswith(r.stream, tag) && !ismissing(r.rel_to_baseline),
            overview
        )
        return (; tag, rows)
    end
    with_scores = [p for p in 1:N_PATCHES if size(scored(p).rows, 1) > 0]
    all_rows = filter(r -> !ismissing(r.rel_to_baseline), overview)
    n_beat = count(
        p -> all(<(1), scored(p).rows.rel_to_baseline), with_scores
    )
    overall = if isempty(with_scores)
        [
            "- **Forecasts:** no province forecast has been scored yet. " *
                "This fills in as releases carrying the per-province " *
                "projection accumulate.",
        ]
    else
        [
            string(
                "- **Provinces:** ", n_beat, " of ", length(with_scores),
                " provinces with scored forecasts beat the baseline on ",
                "every stream scored for them."
            ),
            string(
                "- **Province streams:** ",
                count(<(1), all_rows.rel_to_baseline), " of ",
                size(all_rows, 1), " beat the baseline."
            ),
        ]
    end
    function detail(p)
        sc = scored(p)
        bullets = [
            string(
                "- ", replace(r.stream, sc.tag => ""), ": relative skill ",
                fmt(r.rel_to_baseline), ", 90% coverage ",
                fmt(r.coverage_90), " over ", r.n, " forecasts."
            )
                for r in eachrow(sc.rows)
        ]
        isempty(bullets) && (bullets = ["- No scored forecast yet."])
        return join(
            vcat([string("**", PROVINCE_LABELS[p], "**"), ""], bullets), "\n"
        )
    end
    join(
        vcat([join(overall, "\n")], [detail(p) for p in 1:N_PATCHES]),
        "\n\n"
    )
end
dashboard_dir = joinpath(
    pkgdir(BVDOutbreakSize), "docs", "src", "summary_assets"
)
mkpath(dashboard_dir)
write(
    joinpath(dashboard_dir, "evaluation_forecast_province.md"),
    evaluation_forecast_province_summary
);