Province in-sample checks
Whether the fitted joint model reproduces the per-province data it was fitted to. The national checks are on the national in-sample checks page.
Load packages, data and fitted chains
# Shared setup: packages, observations and the fit registry. See
# `docs/pages/_setup.jl`.
using BVDOutbreakSize
include(joinpath(pkgdir(BVDOutbreakSize), "docs", "pages", "_setup.jl"))
validation_forecast_from (generic function with 1 method)# The fits this page reads, loaded from the cache here.
chn_joint = load_fit("joint");Summary
Whether each province's cases and deaths are reproduced, from the checks further down this page. Bias runs from −1 to 1 and is negative when the model under-predicts, and coverage is the fraction of vintages inside the 90% predictive interval.
Least well reproduced: Analysed specimens, Haut-Uele (bias 0.33, 90% coverage 0.88); Analysed specimens, Other provinces (bias 0.28, 90% coverage 0.88); Analysed specimens, Nord-Kivu (bias -0.17, 90% coverage 1.0).
Coverage: 12 of 12 province streams have 90% coverage of at least 0.8; the lowest is Analysed specimens, Haut-Uele at 0.88.
Count-scale coverage: 8 of 8 province streams have 90% coverage of at least 0.8; the lowest is Confirmed deaths, Ituri at 0.93.
Ituri
Confirmed cases: bias -0.04 and 90% coverage 0.94 over 98 vintages.
Confirmed deaths: bias 0.03 and 90% coverage 0.92 over 98 vintages.
Confirmed cases as counts: bias 0.04 and 90% coverage 0.96 over 98 vintages.
Confirmed deaths as counts: bias -0.06 and 90% coverage 0.93 over 98 vintages.
Nord-Kivu
Confirmed cases: bias 0.03 and 90% coverage 0.94 over 98 vintages.
Confirmed deaths: bias -0.04 and 90% coverage 0.92 over 98 vintages.
Confirmed cases as counts: bias 0.05 and 90% coverage 0.99 over 98 vintages.
Confirmed deaths as counts: bias -0.09 and 90% coverage 0.95 over 98 vintages.
Haut-Uele
Confirmed cases: bias 0.09 and 90% coverage 0.94 over 98 vintages.
Confirmed deaths: bias 0.02 and 90% coverage 0.98 over 98 vintages.
Confirmed cases as counts: bias 0.1 and 90% coverage 0.95 over 98 vintages.
Confirmed deaths as counts: bias -0.01 and 90% coverage 0.97 over 98 vintages.
Other provinces
Confirmed cases: bias 0.02 and 90% coverage 0.98 over 98 vintages.
Confirmed deaths: bias -0.01 and 90% coverage 0.98 over 98 vintages.
Confirmed cases as counts: bias 0.03 and 90% coverage 0.98 over 98 vintages.
Confirmed deaths as counts: bias -0.01 and 90% coverage 0.98 over 98 vintages.
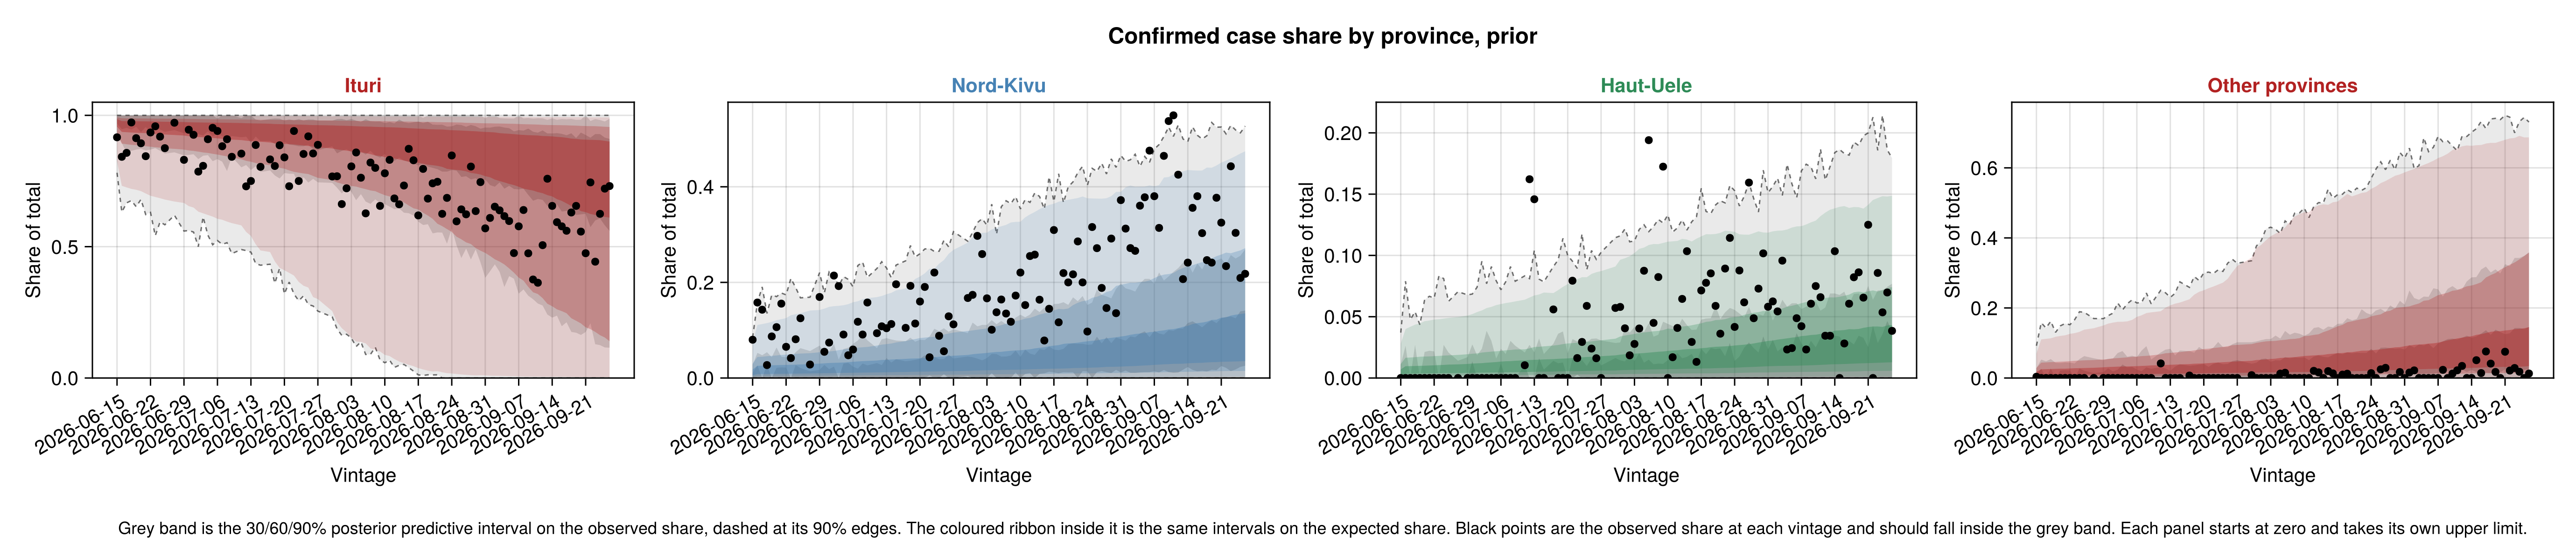
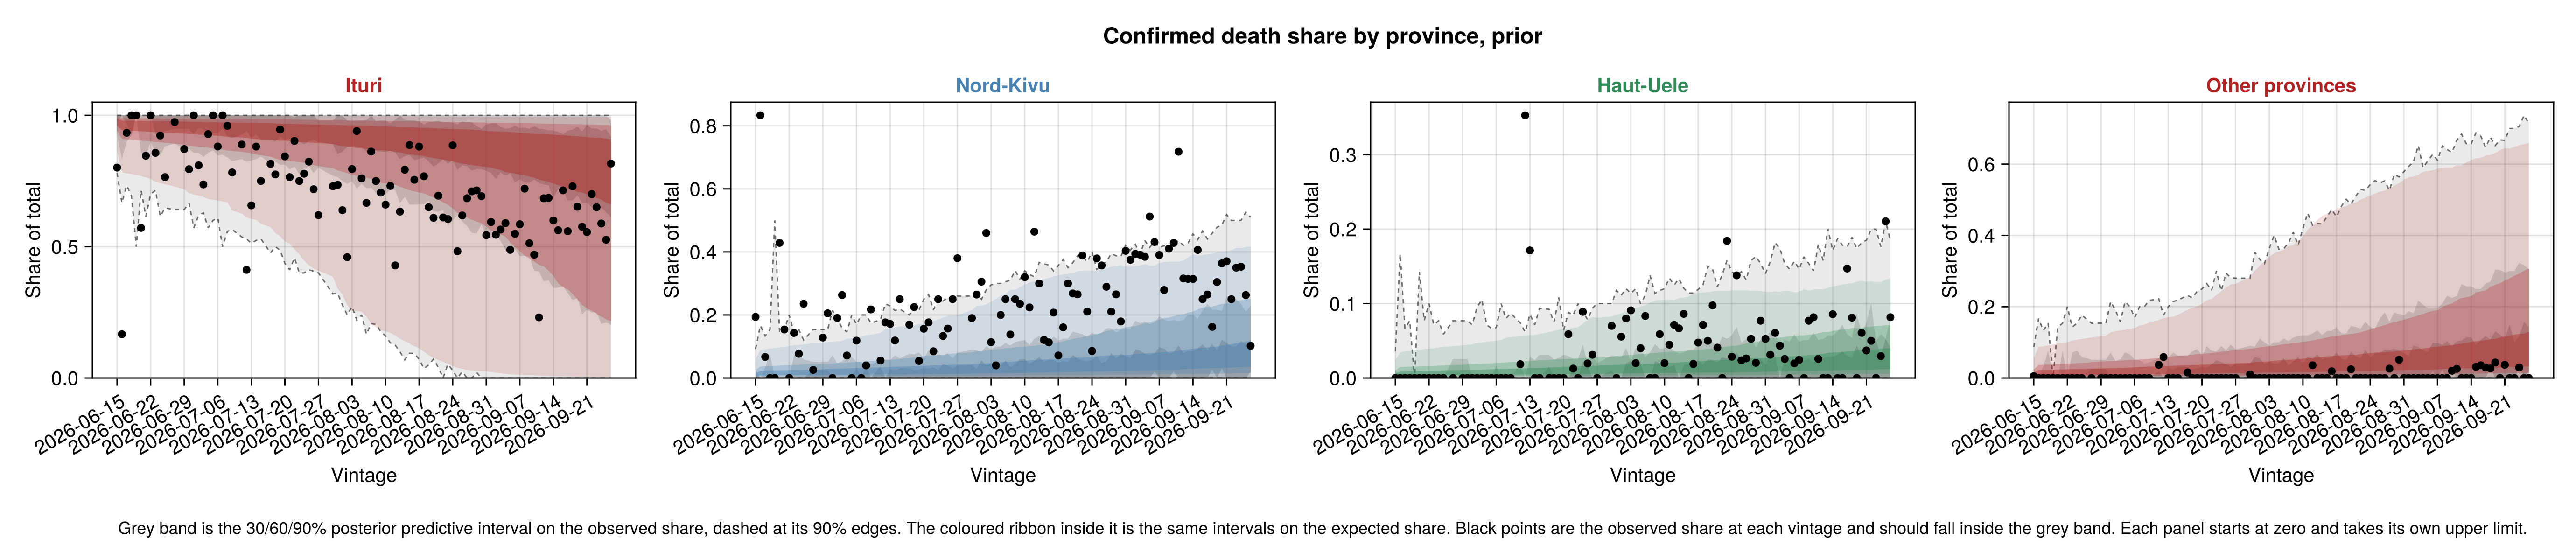
Province prior predictive check
Whether the four-patch prior, before any data are fitted, brackets each province's observed share of the confirmed cases and deaths.
Draw from the four-patch prior
prior_patch_chn = patch_prior_draws(obs);

prior_province_table = patch_overview_table(prior_patch_chn, N_PATCHES);
Show prior province summary table
| Province | Reproduction number | Cumulative infections | Share of infections (%) | Relative ascertainment |
|---|---|---|---|---|
| Ituri | 0.97 (0.08–1.82) | 356767 (1406–3911650) | 85.9 (15.0–99.4) | 1.01 (0.68–1.54) |
| Nord-Kivu | 1.32 (0.18–2.56) | 13907 (13–7130044) | 5.3 (0.2–29.9) | 1.0 (0.66–1.54) |
| Haut-Uele | 1.3 (0.13–2.52) | 5127 (6–1970675) | 2.0 (0.1–9.4) | 1.0 (0.64–1.46) |
| Other provinces | 1.34 (0.16–2.59) | 13209 (13–12461759) | 5.3 (0.2–49.1) | 0.99 (0.66–1.45) |
Province composition prior predictive checks
prior_case_ppc_fig = plot_province_composition_ppc(
    prior_patch_chn;
    share_key = :province_shares,
    obs_increments = province_cases.increments,
    days = province_cases.days, seeding = obs.seeding, n_patches = N_PATCHES,
    title = "Confirmed case share by province, prior"
);

prior_death_ppc_fig = plot_province_composition_ppc(
    prior_patch_chn;
    share_key = :province_death_shares,
    obs_increments = province_deaths.increments,
    days = province_deaths.days, seeding = obs.seeding, n_patches = N_PATCHES,
    title = "Confirmed death share by province, prior"
);
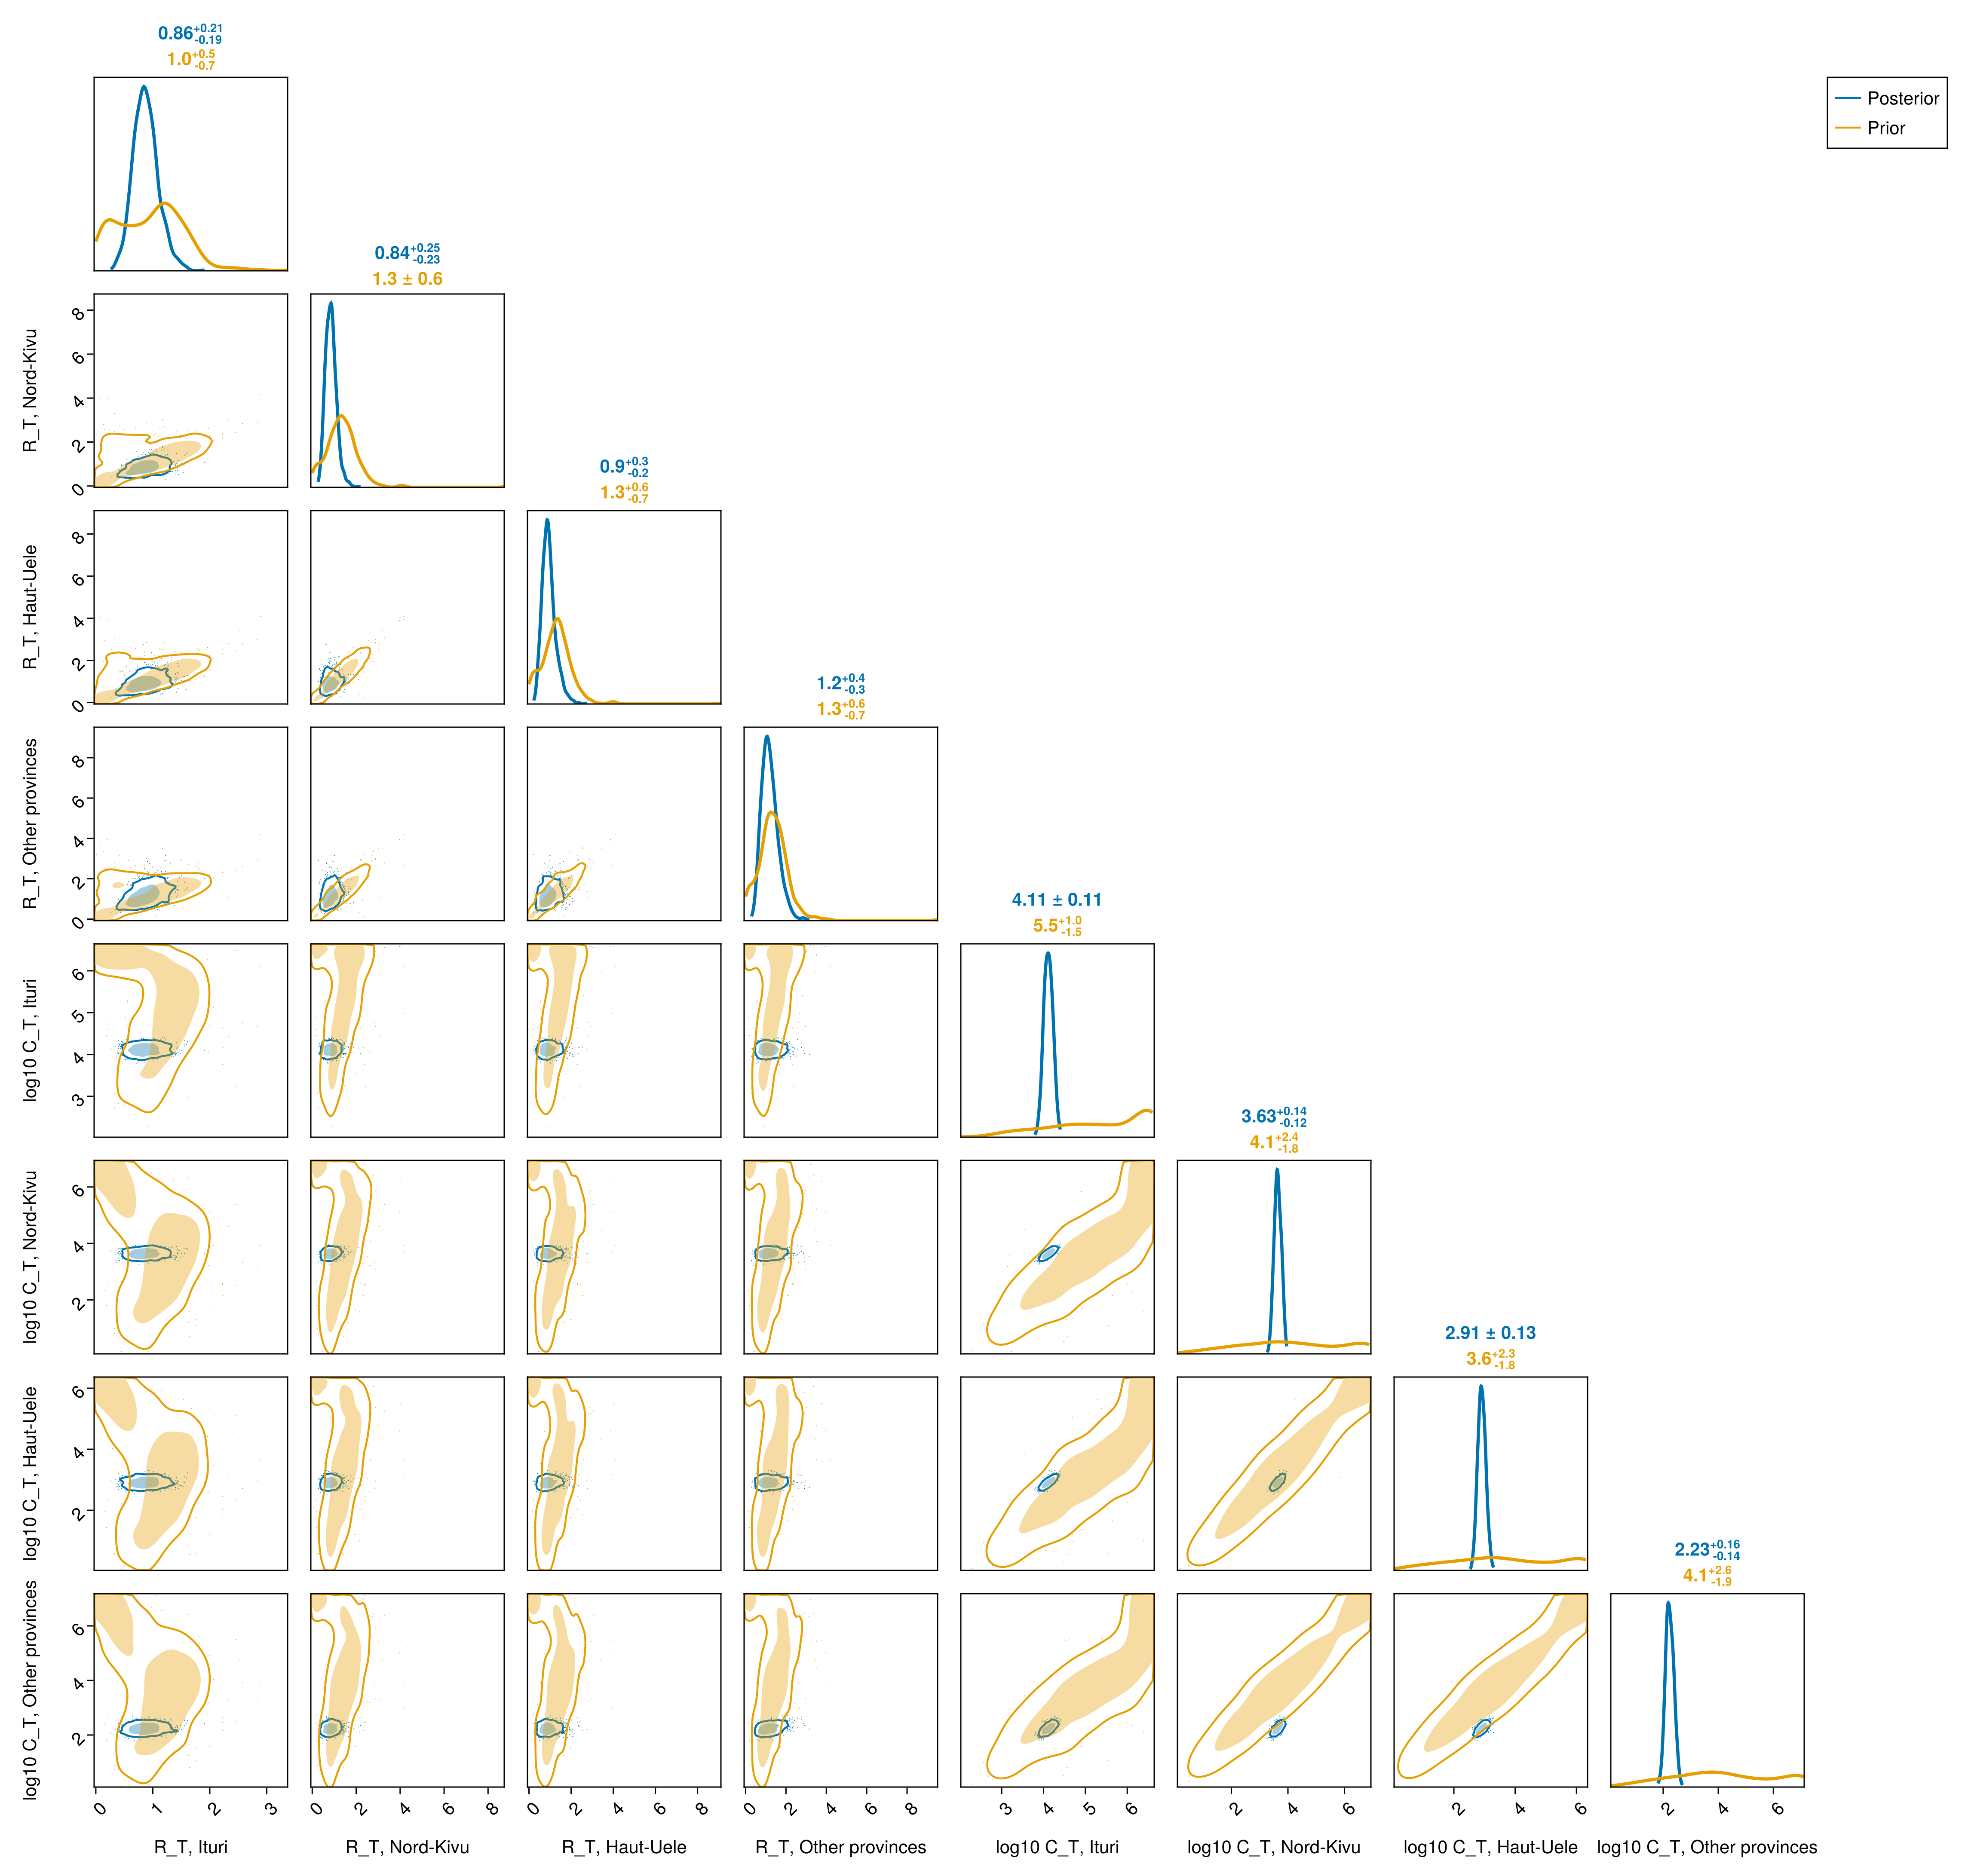
Province prior and posterior pair plot
# Per-province entries of a vector deterministic, one draw vector each,
# keyed `<name>_<patch>` so they can sit side by side in one table.
function _patch_columns(chn, key::Symbol, name::AbstractString; f = identity)
    draws = [collect(v) for v in vec(collect(chn[key]))]
    return [
        Symbol(name, "_", p) => Float64[f(d[p]) for d in draws]
            for p in 1:N_PATCHES
    ]
end
_province_pair_draws(chn) = NamedTuple(
    vcat(
        _patch_columns(chn, :R_T_patch, "R_T"),
        _patch_columns(chn, :C_T_patch, "log10_C_T"; f = x -> log10(x + 1))
    )
)
_province_pair_labels = Dict(
    Symbol(name, "_", p) => string(label, ", ", PROVINCE_LABELS[p])
        for p in 1:N_PATCHES
        for (name, label) in (("R_T", "R_T"), ("log10_C_T", "log10 C_T"))
)
province_pair_fig = plot_pair(
    _province_pair_draws(chn_joint);
    prior = _province_pair_draws(prior_patch_chn),
    labels = _province_pair_labels
);
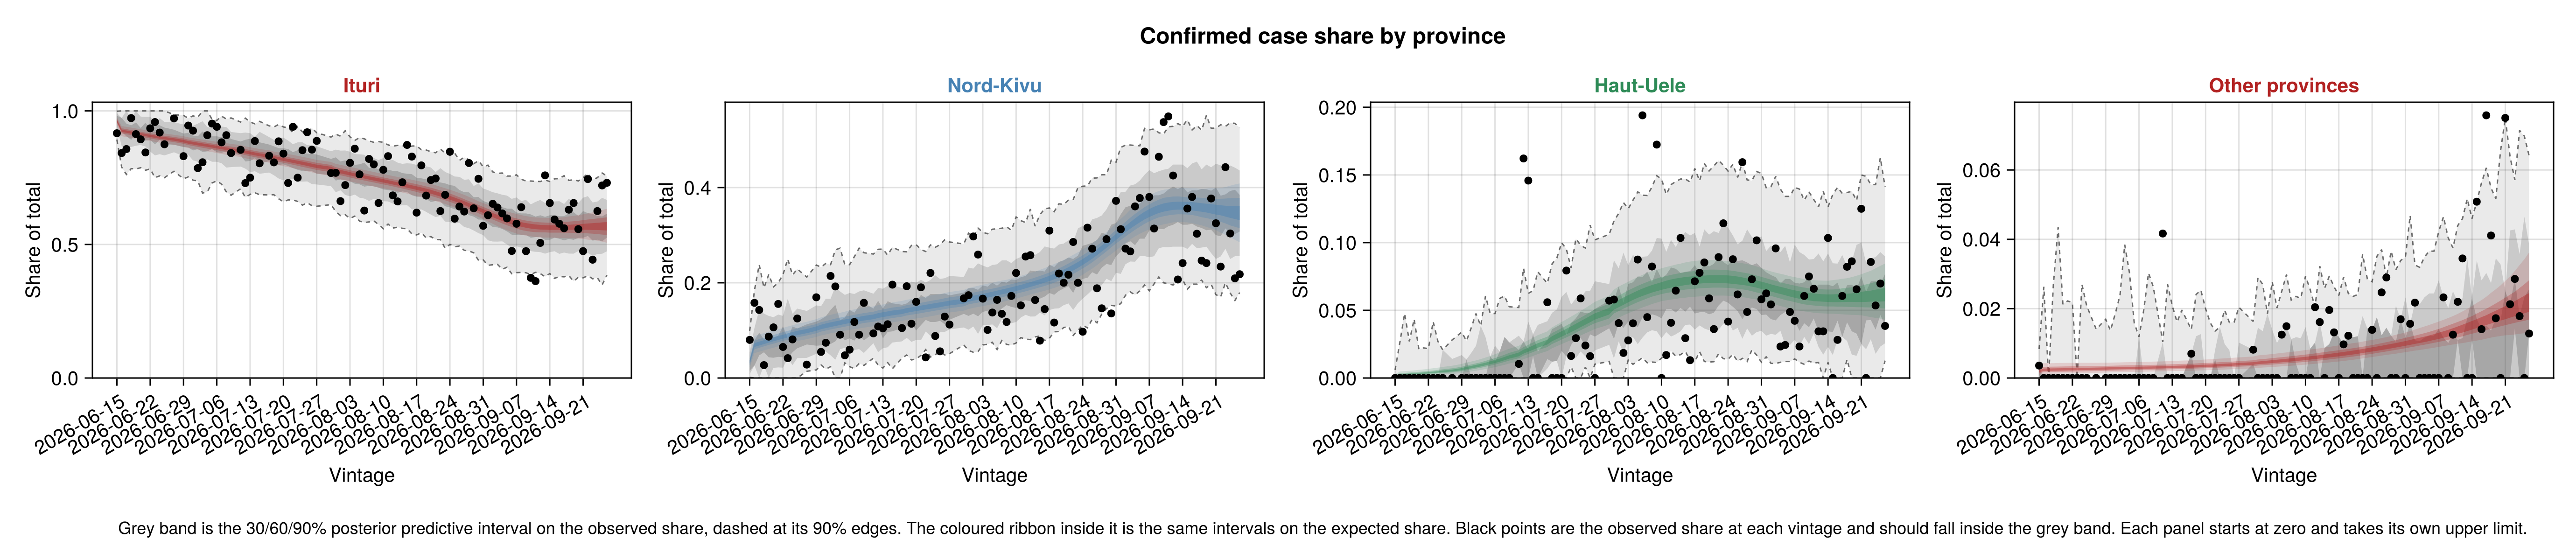
Province compositions
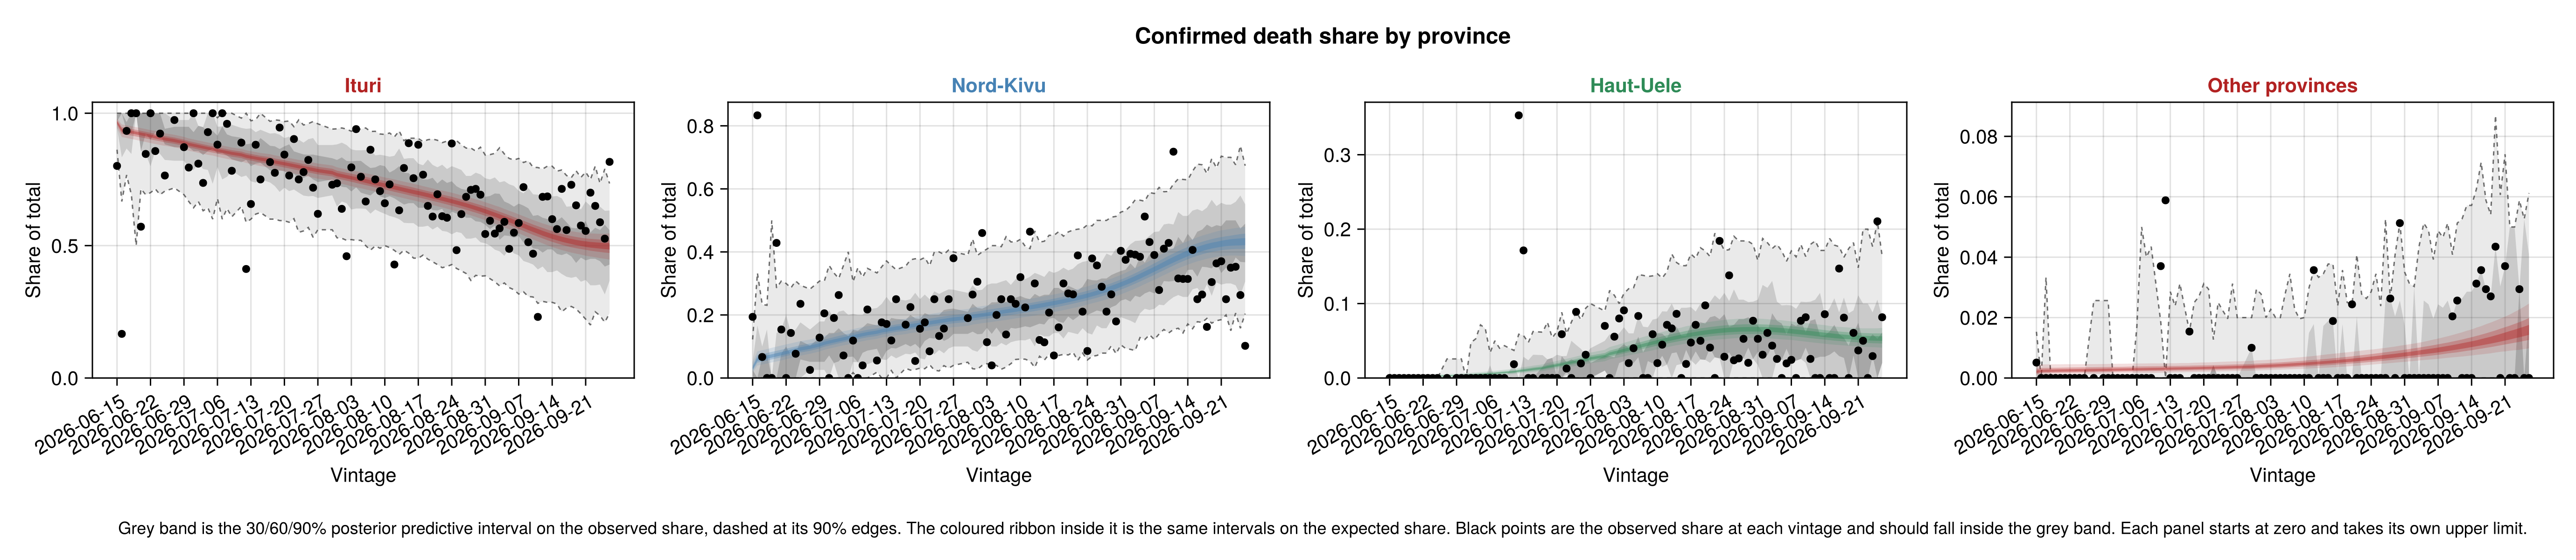
Whether each province's modelled share of the national confirmed cases and deaths reproduces the observed share at every spatial vintage (see the province compositions Methods section).
Province composition posterior predictive checks
province_case_ppc_fig = plot_province_composition_ppc(
    chn_joint;
    share_key = :province_shares,
    obs_increments = province_cases.increments,
    days = province_cases.days, seeding = obs.seeding, n_patches = N_PATCHES,
    title = "Confirmed case share by province"
);

province_death_ppc_fig = plot_province_composition_ppc(
    chn_joint;
    share_key = :province_death_shares,
    obs_increments = province_deaths.increments,
    days = province_deaths.days, seeding = obs.seeding, n_patches = N_PATCHES,
    title = "Confirmed death share by province"
);
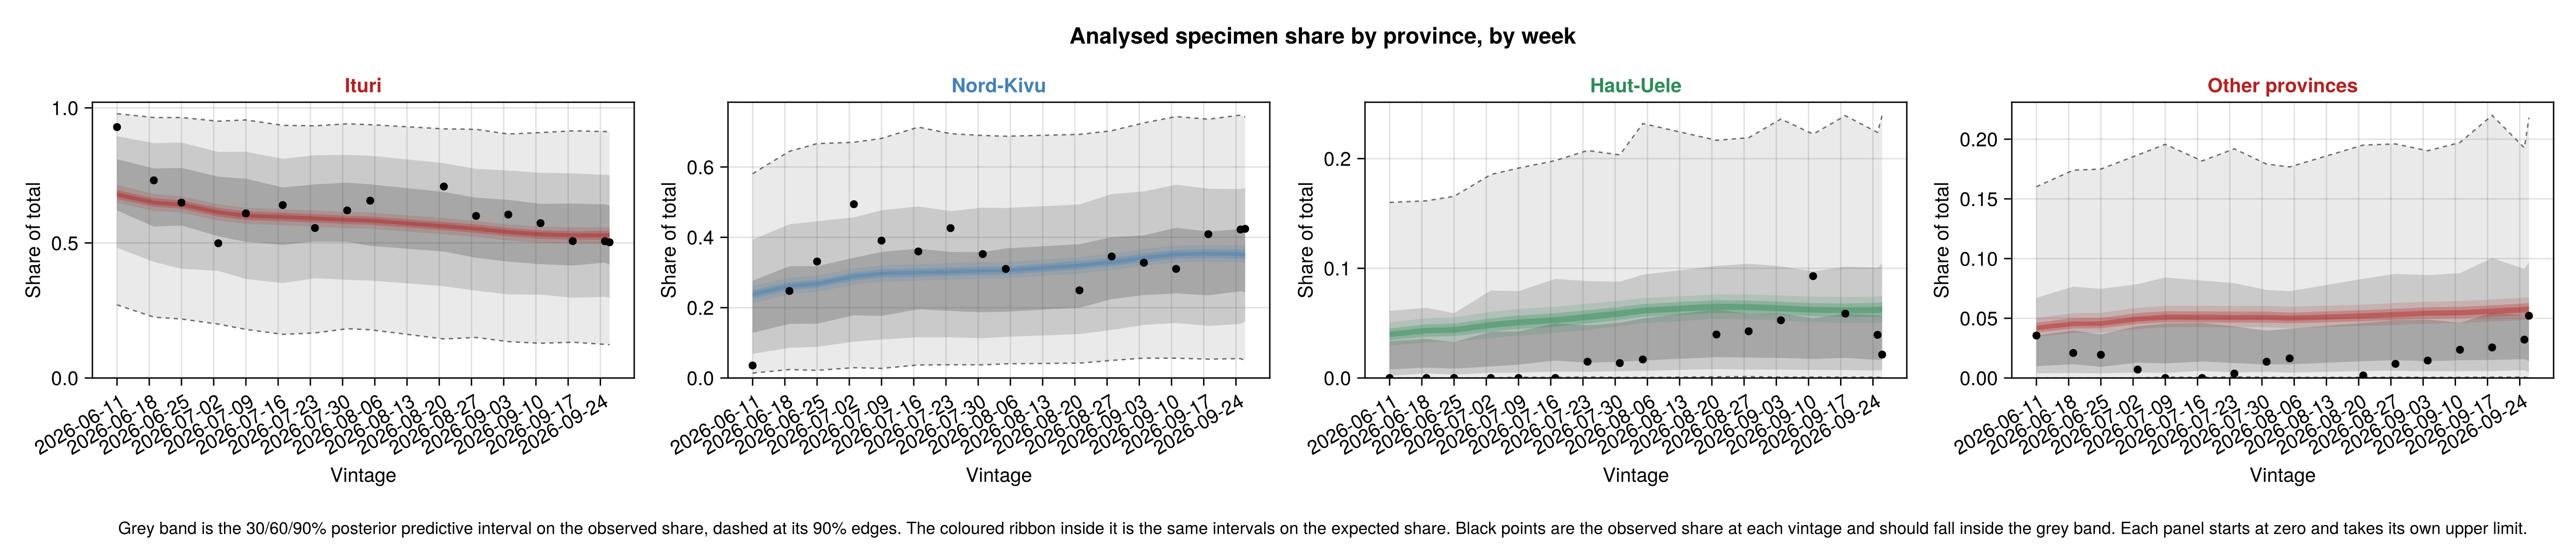
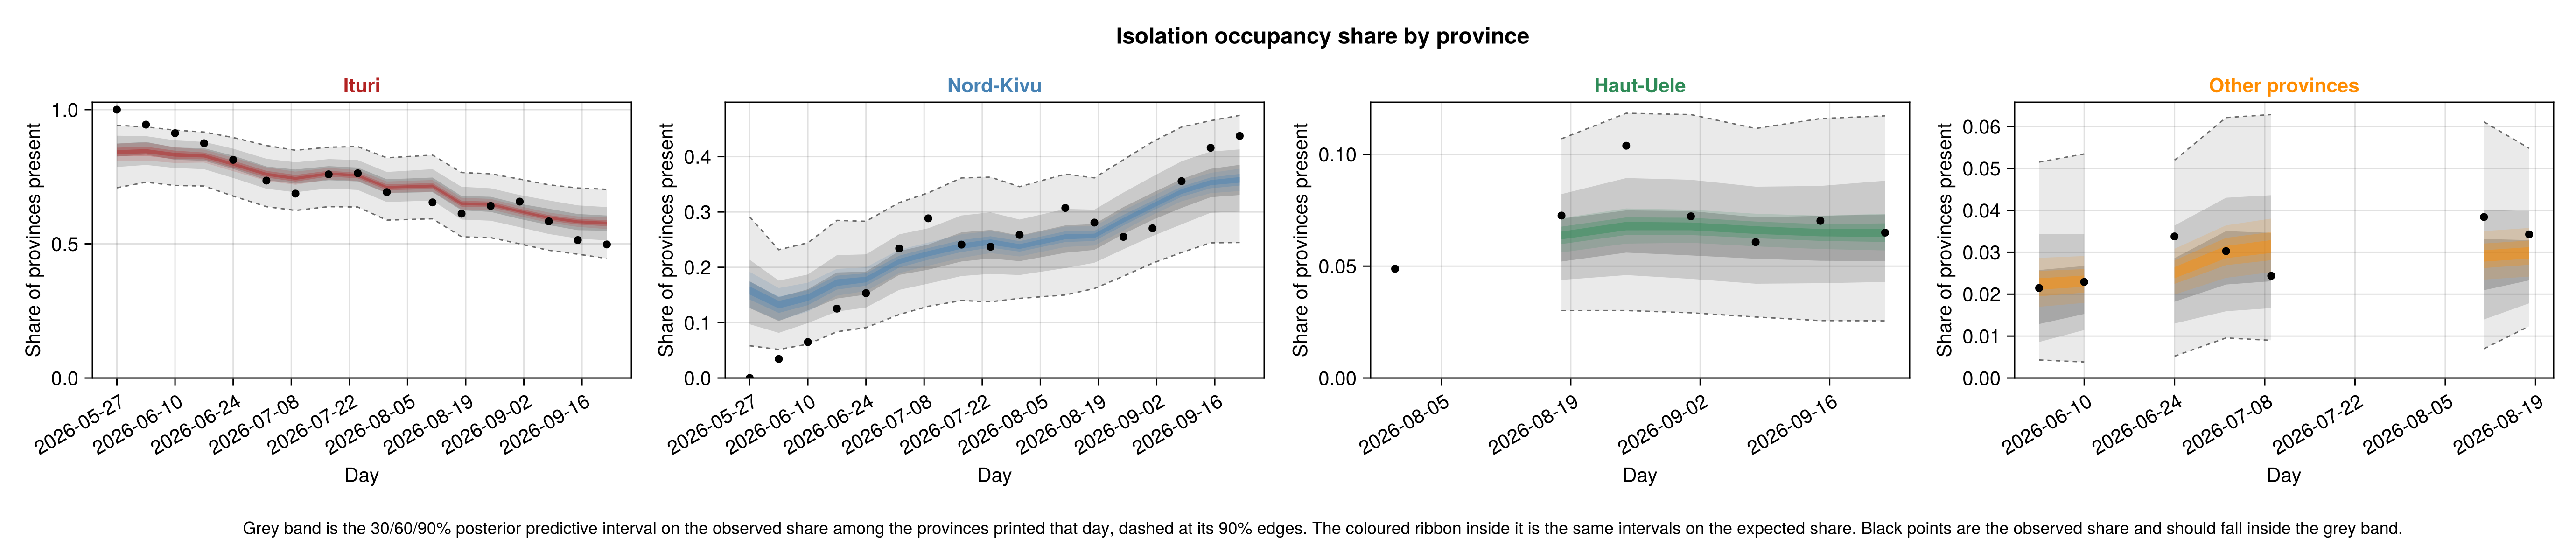
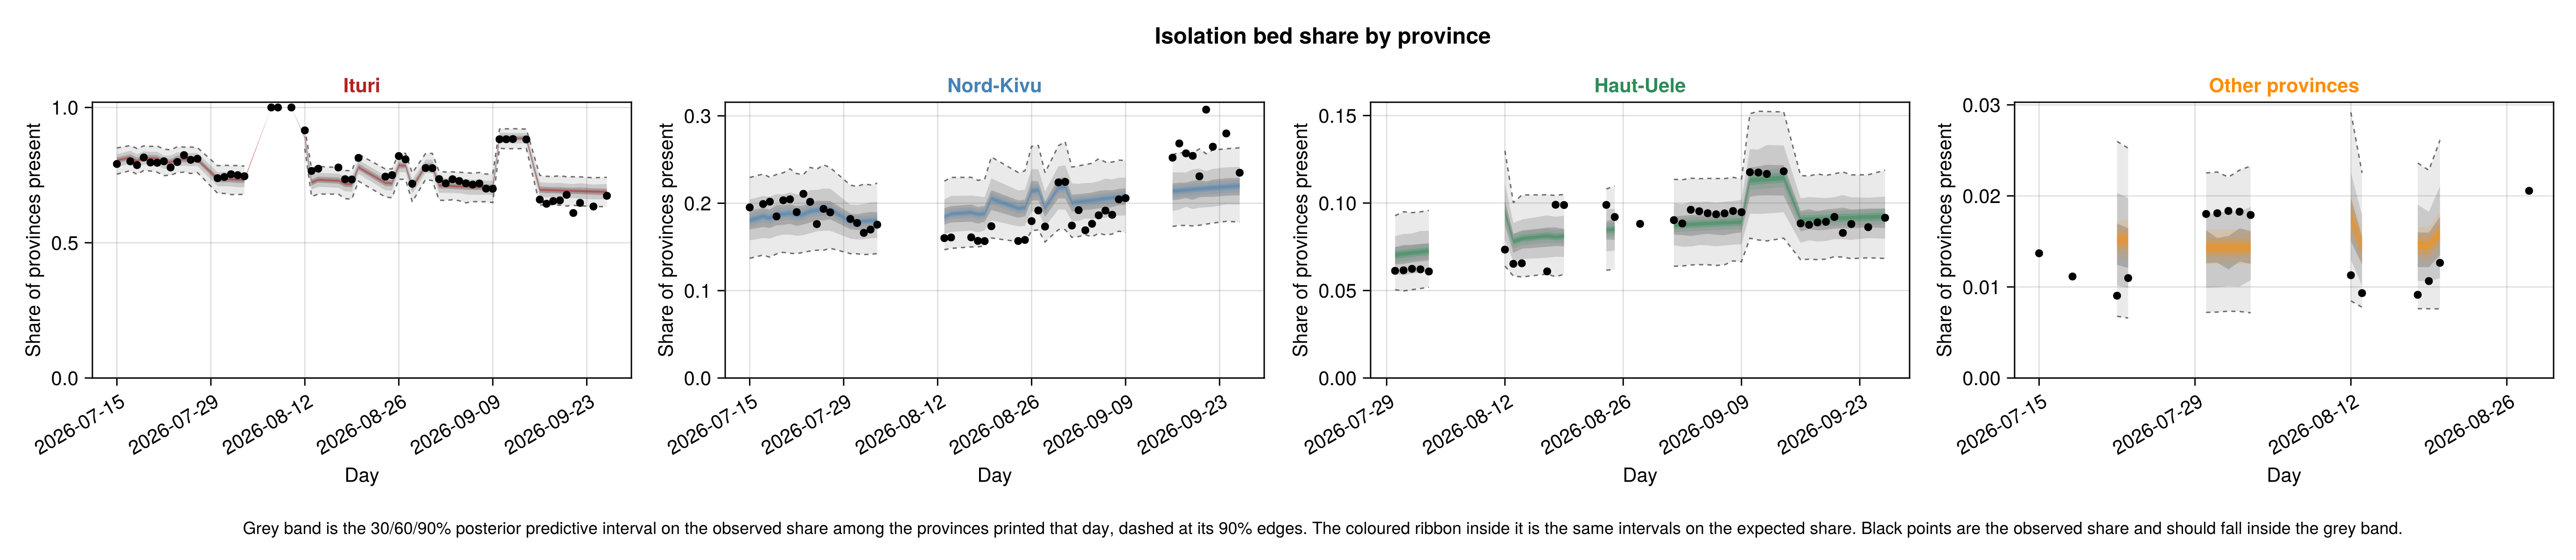
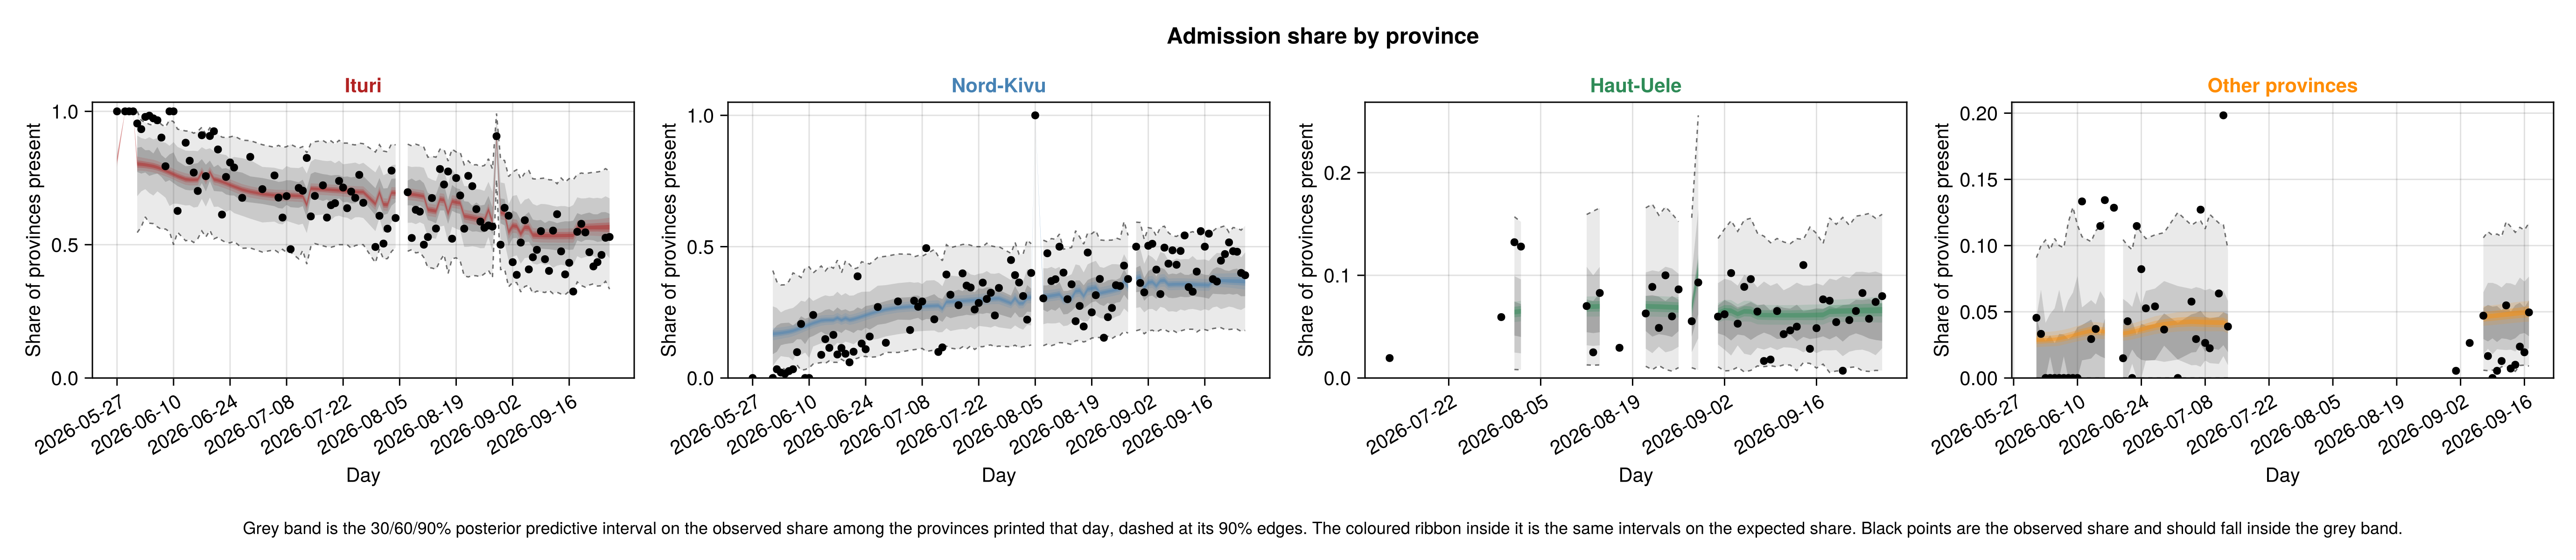
The four province terms for the isolation and laboratory data are checked the same way. The laboratory panel is the split of each calendar week's analysed specimens, which identifies the background split. The occupancy panel is the split of the patients in isolation among the provinces printed that day, on the weekly days the fit scores, over the per-patch bed demand. The bed panel is the split of the beds among the provinces printed that day, on the days a count changed, over each patch's modelled share of the national capacity. The admission panel is the split of each day's 24h admissions among the provinces printed that day, over each patch's modelled admissions. A gap in a panel is a day on which that province printed nothing.
Province laboratory, occupancy, bed and admission split posterior predictive checks
province_lab_bin_days = [
    maximum(province_lab.days[province_lab.bins .== b])
        for b in 1:maximum(province_lab.bins)
];

province_lab_ppc_fig = plot_province_composition_ppc(
    chn_joint;
    share_key = :province_lab_shares,
    obs_increments = province_lab.increments,
    days = province_lab_bin_days, seeding = obs.seeding, n_patches = N_PATCHES,
    title = "Analysed specimen share by province, by week"
);

province_occupancy_ppc_fig = plot_province_split_ppc(
    chn_joint;
    share_key = :province_occupancy_share, rows = province_isolation,
    seeding = obs.seeding, n_patches = N_PATCHES,
    title = "Isolation occupancy share by province"
);

province_beds_ppc_fig = plot_province_split_ppc(
    chn_joint;
    share_key = :province_capacity_share, rows = province_capacity,
    seeding = obs.seeding, n_patches = N_PATCHES,
    title = "Isolation bed share by province"
);

province_admissions_ppc_fig = plot_province_split_ppc(
    chn_joint;
    share_key = :province_admissions_share, rows = province_admissions,
    seeding = obs.seeding, n_patches = N_PATCHES,
    title = "Admission share by province"
);
Province stream calibration
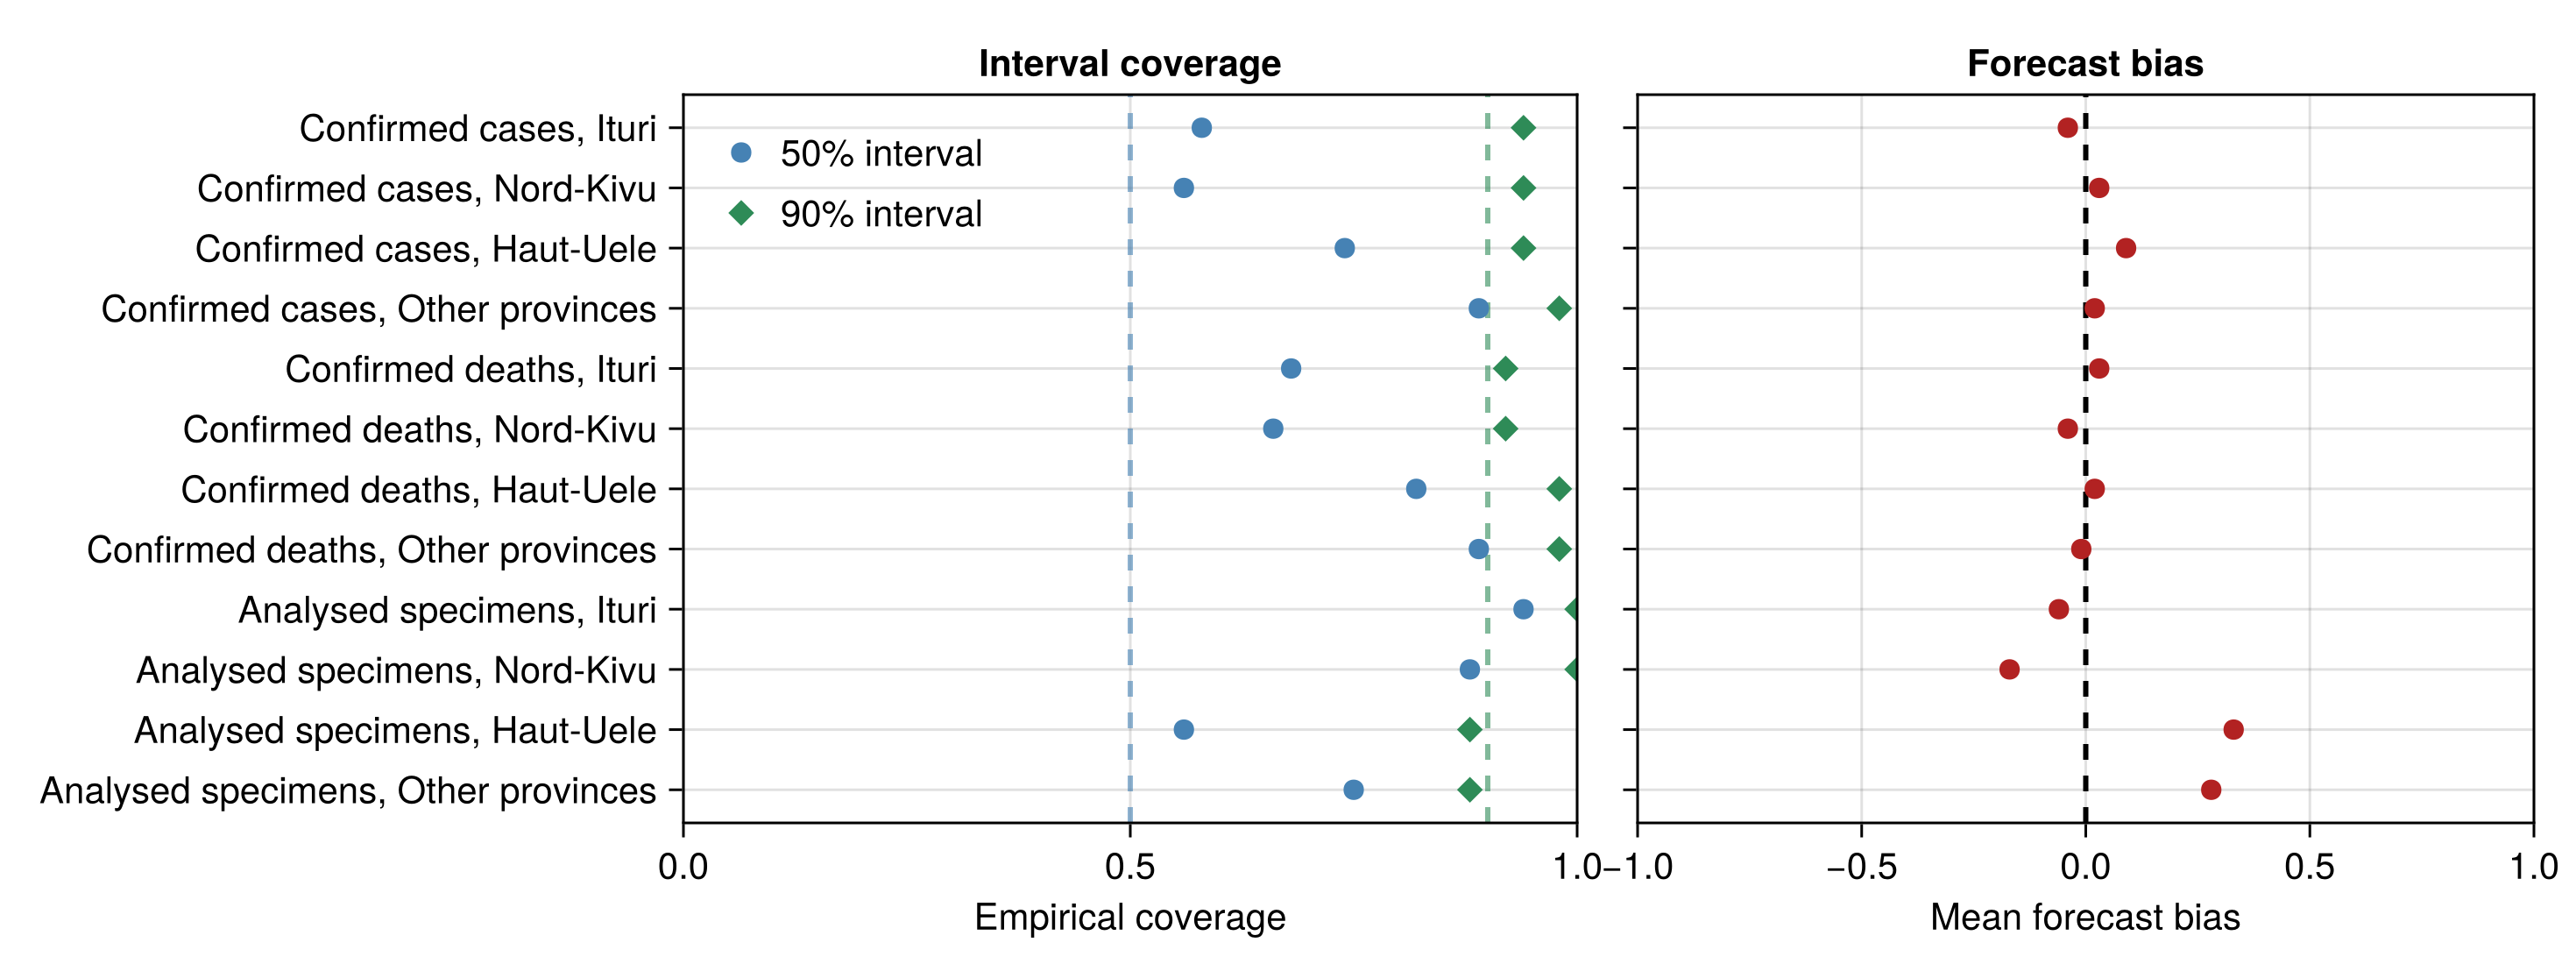
Whether each province's share predictions are calibrated at the observed national total, scored as in the national stream calibration. The analysed-specimen rows score the weekly laboratory split the same way, at each week's observed national analysed total.
Build the province calibration panels
province_case_panels = province_composition_panels(
    chn_joint;
    share_key = :province_shares,
    obs_increments = province_cases.increments,
    stream = "Confirmed cases", n_patches = N_PATCHES
);
province_death_panels = province_composition_panels(
    chn_joint;
    share_key = :province_death_shares,
    obs_increments = province_deaths.increments,
    stream = "Confirmed deaths", n_patches = N_PATCHES
);
province_lab_panels = province_composition_panels(
    chn_joint;
    share_key = :province_lab_shares,
    obs_increments = province_lab.increments,
    stream = "Analysed specimens", n_patches = N_PATCHES
);
province_panels = vcat(
    province_case_panels, province_death_panels, province_lab_panels
);
province_calibration_table = stream_calibration(province_panels);
province_calibration_fig = plot_stream_calibration(
    province_calibration_table
);
Province calibration table
| Stream | Vintages | Bias | 50% coverage | 90% coverage |
|---|---|---|---|---|
| Confirmed cases, Ituri | 98 | -0.04 | 0.58 | 0.94 |
| Confirmed cases, Nord-Kivu | 98 | 0.03 | 0.56 | 0.94 |
| Confirmed cases, Haut-Uele | 98 | 0.09 | 0.74 | 0.94 |
| Confirmed cases, Other provinces | 98 | 0.02 | 0.89 | 0.98 |
| Confirmed deaths, Ituri | 98 | 0.03 | 0.68 | 0.92 |
| Confirmed deaths, Nord-Kivu | 98 | -0.04 | 0.66 | 0.92 |
| Confirmed deaths, Haut-Uele | 98 | 0.02 | 0.82 | 0.98 |
| Confirmed deaths, Other provinces | 98 | -0.01 | 0.89 | 0.98 |
| Analysed specimens, Ituri | 16 | -0.06 | 0.94 | 1 |
| Analysed specimens, Nord-Kivu | 16 | -0.17 | 0.88 | 1 |
| Analysed specimens, Haut-Uele | 16 | 0.33 | 0.56 | 0.88 |
| Analysed specimens, Other provinces | 16 | 0.28 | 0.75 | 0.88 |
Province counts
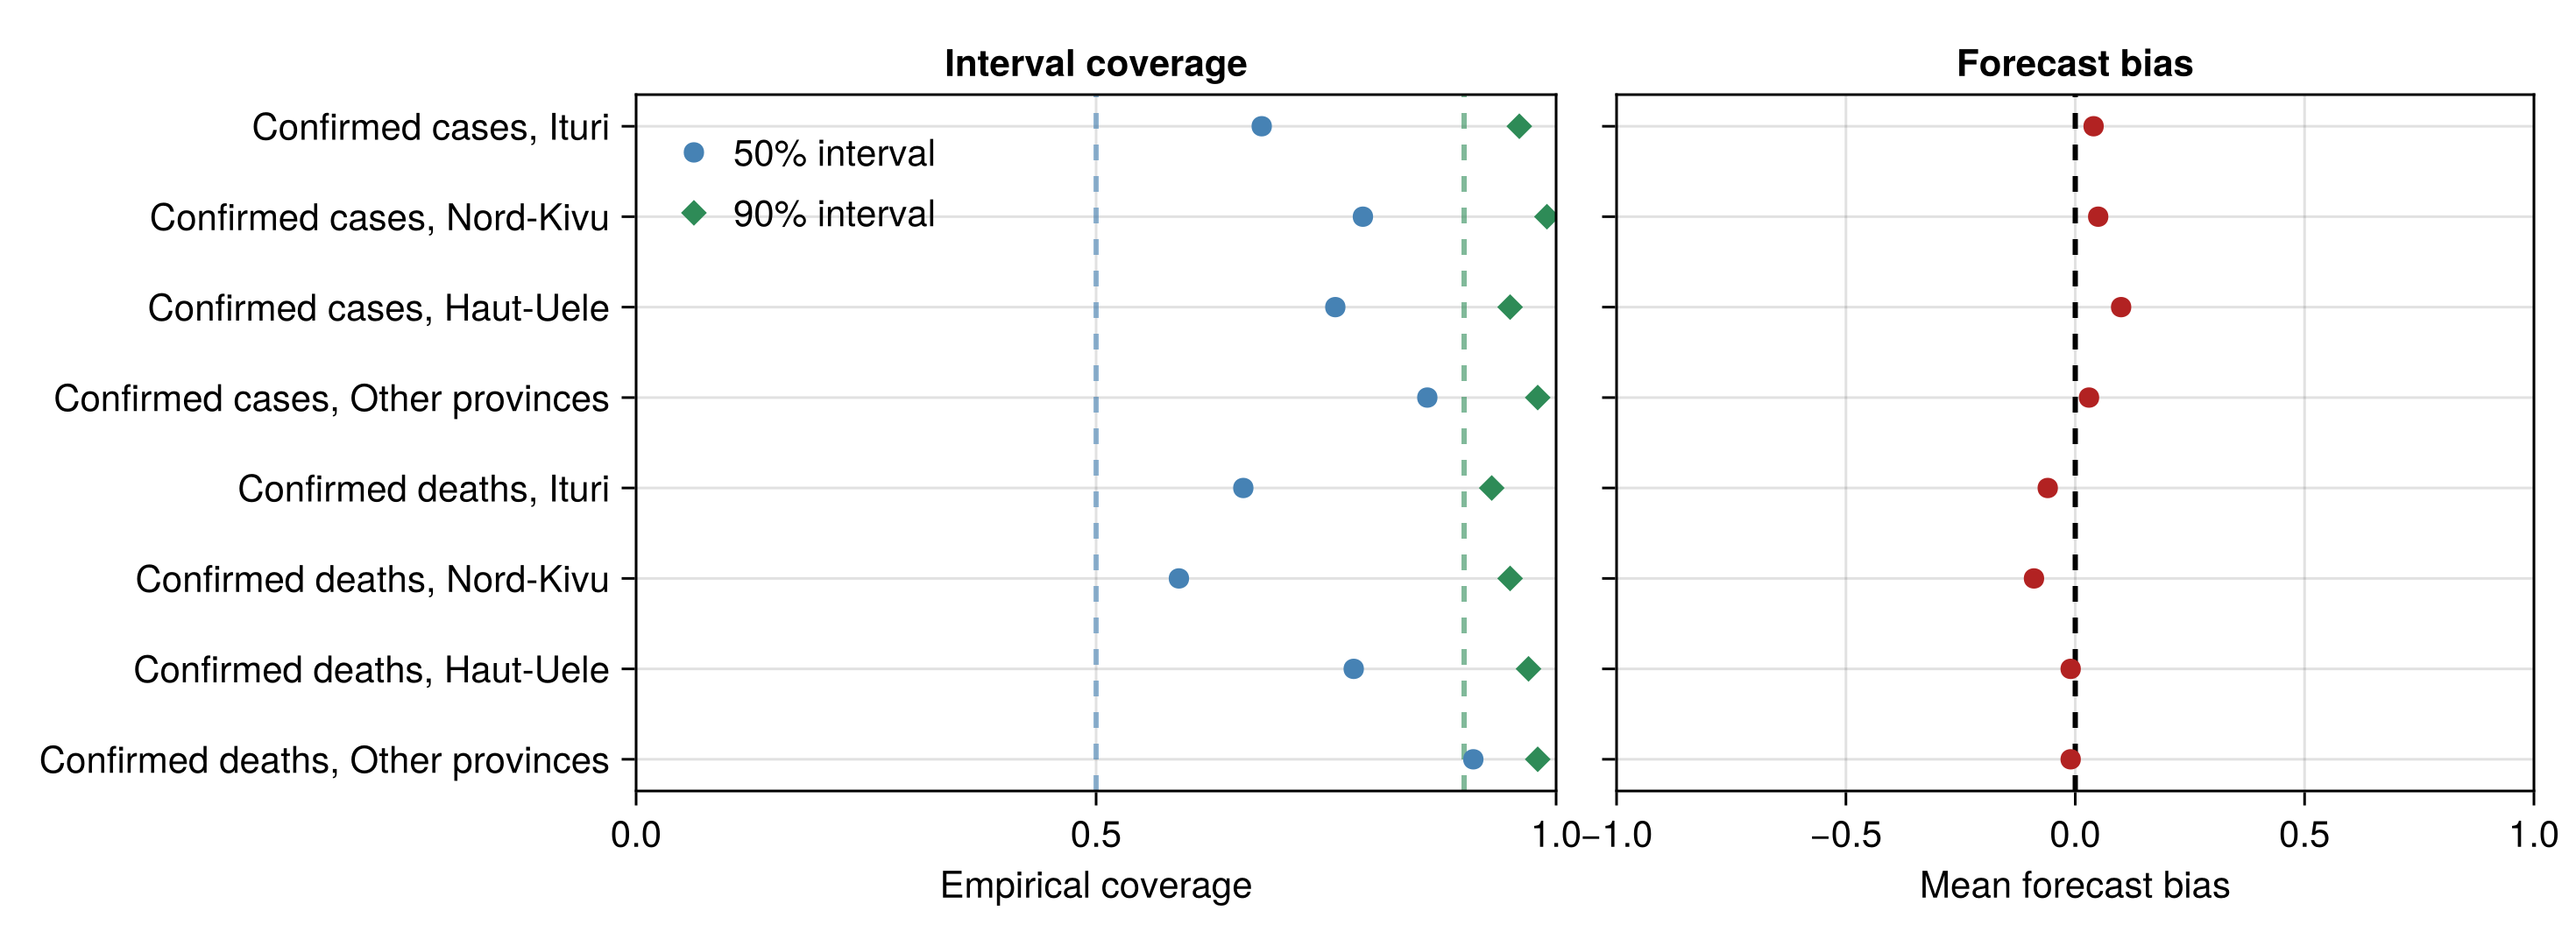
Whether each province's cases and deaths are reproduced as counts once the national total is predicted as well.
Build the province count panels
# The joint posterior predictive, shared with the national page (see
# `joint_posterior_predictive` in `docs/pages/_setup.jl`). Its draws pair
# one to one with `chn_joint`, whose shares split them.
pp_joint = joint_posterior_predictive();
_pp_draws(vn) = collect(pp_joint[BVDOutbreakSize.FlexiChains.Prefixed(vn)]);

# The national confirmed cases are replicated per laboratory window, oldest
# first, as on the national page. The first confirmed vintage is an
# unreplicated baseline.
_conf_windows = BVDOutbreakSize.confirmed_positivity_windows(
    obs.confirmed_history, obs.lab_history, obs.lab_daily_history
);
_conf_obs = collect(
    first(
        pp_joint[k] for k in keys(pp_joint)
            if occursin(
                "confirmed_state.confirmed_positives.positives", string(k)
            )
    )
);
_conf_replicates = [
    vcat(collect(e), collect(p), collect(l))
        for (e, p, l) in zip(
            vec(_pp_draws(@varname(early_increments.increments))),
            vec(_conf_obs),
            vec(_pp_draws(@varname(late_increments.increments)))
        )
];
province_case_count_panels = province_count_panels(
    chn_joint;
    share_key = :province_shares,
    obs_increments = province_cases.increments,
    province_days = province_cases.days,
    national_days = vcat(
        _conf_windows.early_days, _conf_windows.obs_days,
        _conf_windows.late_days
    ),
    national_replicates = _conf_replicates,
    baseline = Int(first(obs.confirmed_history.counts)),
    stream = "Confirmed cases", n_patches = N_PATCHES
);
# The national confirmed deaths are replicated from zero at every vintage.
province_death_count_panels = province_count_panels(
    chn_joint;
    share_key = :province_death_shares,
    obs_increments = province_deaths.increments,
    province_days = province_deaths.days,
    national_days = obs.confirmed_deaths_history.days,
    national_replicates = _pp_draws(@varname(cdeath_increments.increments)),
    stream = "Confirmed deaths", n_patches = N_PATCHES
);
province_count_calibration_table = stream_calibration(
    vcat(province_case_count_panels, province_death_count_panels)
);
province_count_calibration_fig = plot_stream_calibration(
    province_count_calibration_table
);
Province count calibration plot
Province count calibration table
| Stream | Vintages | Bias | 50% coverage | 90% coverage |
|---|---|---|---|---|
| Confirmed cases, Ituri | 98 | 0.04 | 0.68 | 0.96 |
| Confirmed cases, Nord-Kivu | 98 | 0.05 | 0.79 | 0.99 |
| Confirmed cases, Haut-Uele | 98 | 0.1 | 0.76 | 0.95 |
| Confirmed cases, Other provinces | 98 | 0.03 | 0.86 | 0.98 |
| Confirmed deaths, Ituri | 98 | -0.06 | 0.66 | 0.93 |
| Confirmed deaths, Nord-Kivu | 98 | -0.09 | 0.59 | 0.95 |
| Confirmed deaths, Haut-Uele | 98 | -0.01 | 0.78 | 0.97 |
| Confirmed deaths, Other provinces | 98 | -0.01 | 0.91 | 0.98 |
Province correlations and totals
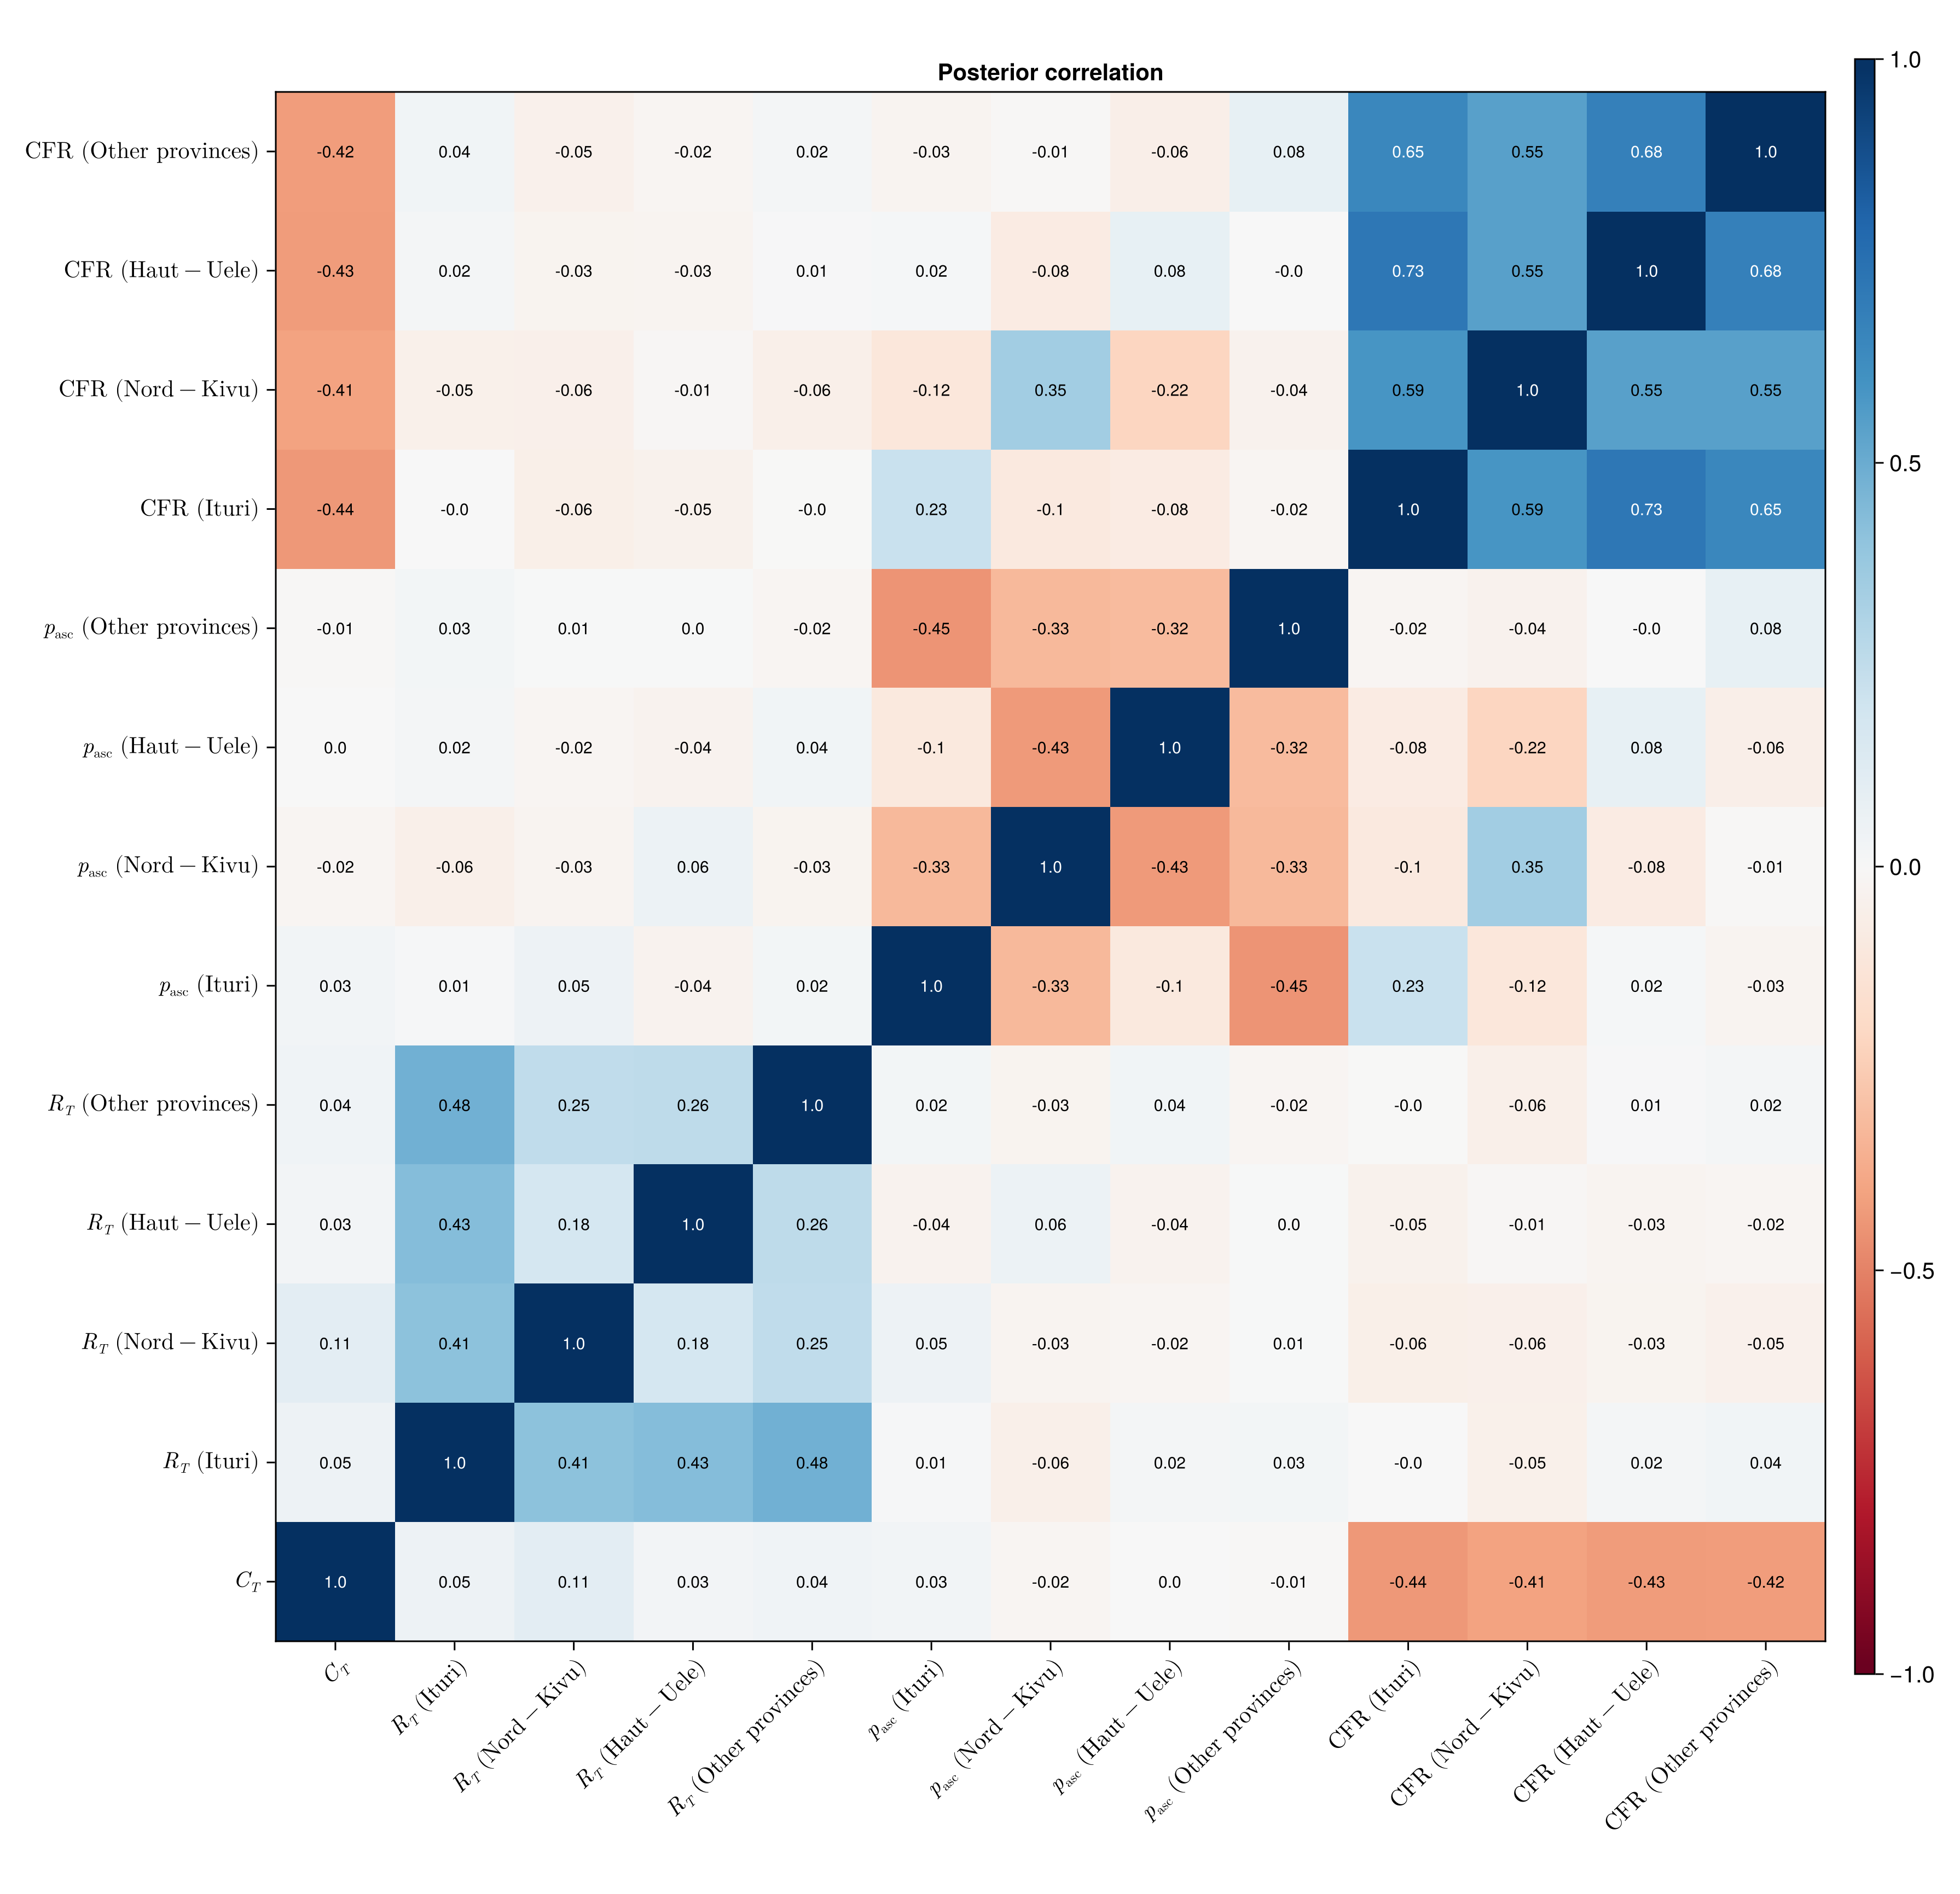
Which province quantities trade off against each other, and whether each province's case and death totals agree with the observed ones.
Province posterior correlation heatmap
# LaTeX label for one province's entry of a quantity. Spaces in a province
# name need escaping inside `\mathrm`.
_province_tex(sym, p) = string(
    sym, raw"\ (\mathrm{", replace(PROVINCE_LABELS[p], " " => raw"\ "), "})"
)
province_correlation_draws = NamedTuple(
    vcat(
        [:C_T => vec(Array(chn_joint[:C_T]))],
        _patch_columns(chn_joint, :R_T_patch, "R_T"),
        _patch_columns(chn_joint, :province_ascertainment, "asc"),
        _patch_columns(chn_joint, :CFR_patch, "CFR")
    )
);
province_correlation_labels = merge(
    Dict(:C_T => raw"C_T"),
    Dict(
        Symbol(name, "_", p) => _province_tex(tex, p)
            for p in 1:N_PATCHES
            for (name, tex) in (
                ("R_T", raw"R_T"), ("asc", raw"p_\mathrm{asc}"),
                ("CFR", raw"\mathrm{CFR}"),
            )
    )
);
province_correlation_fig = plot_correlation_heatmap(
    province_correlation_draws; labels = province_correlation_labels
);
Province totals against observed
# Keyed by panel title, which names the stream and the province. A total
# that is the same in every draw (a patch with no deaths at any vintage) has
# no spread to plot and gives the corner plot a zero-width axis, so it is
# left out.
_varying_panels = filter(
    p -> length(unique(sum(r) for r in p.replicates)) > 1, province_panels
);
province_totals = NamedTuple(
    Symbol(p.title) => [sum(Float64.(r)) for r in p.replicates]
        for p in _varying_panels
);
province_observed = NamedTuple(
    Symbol(p.title) => Float64(sum(p.observed)) for p in _varying_panels
);
province_pairs_fig = plot_stream_pairs(province_totals, province_observed);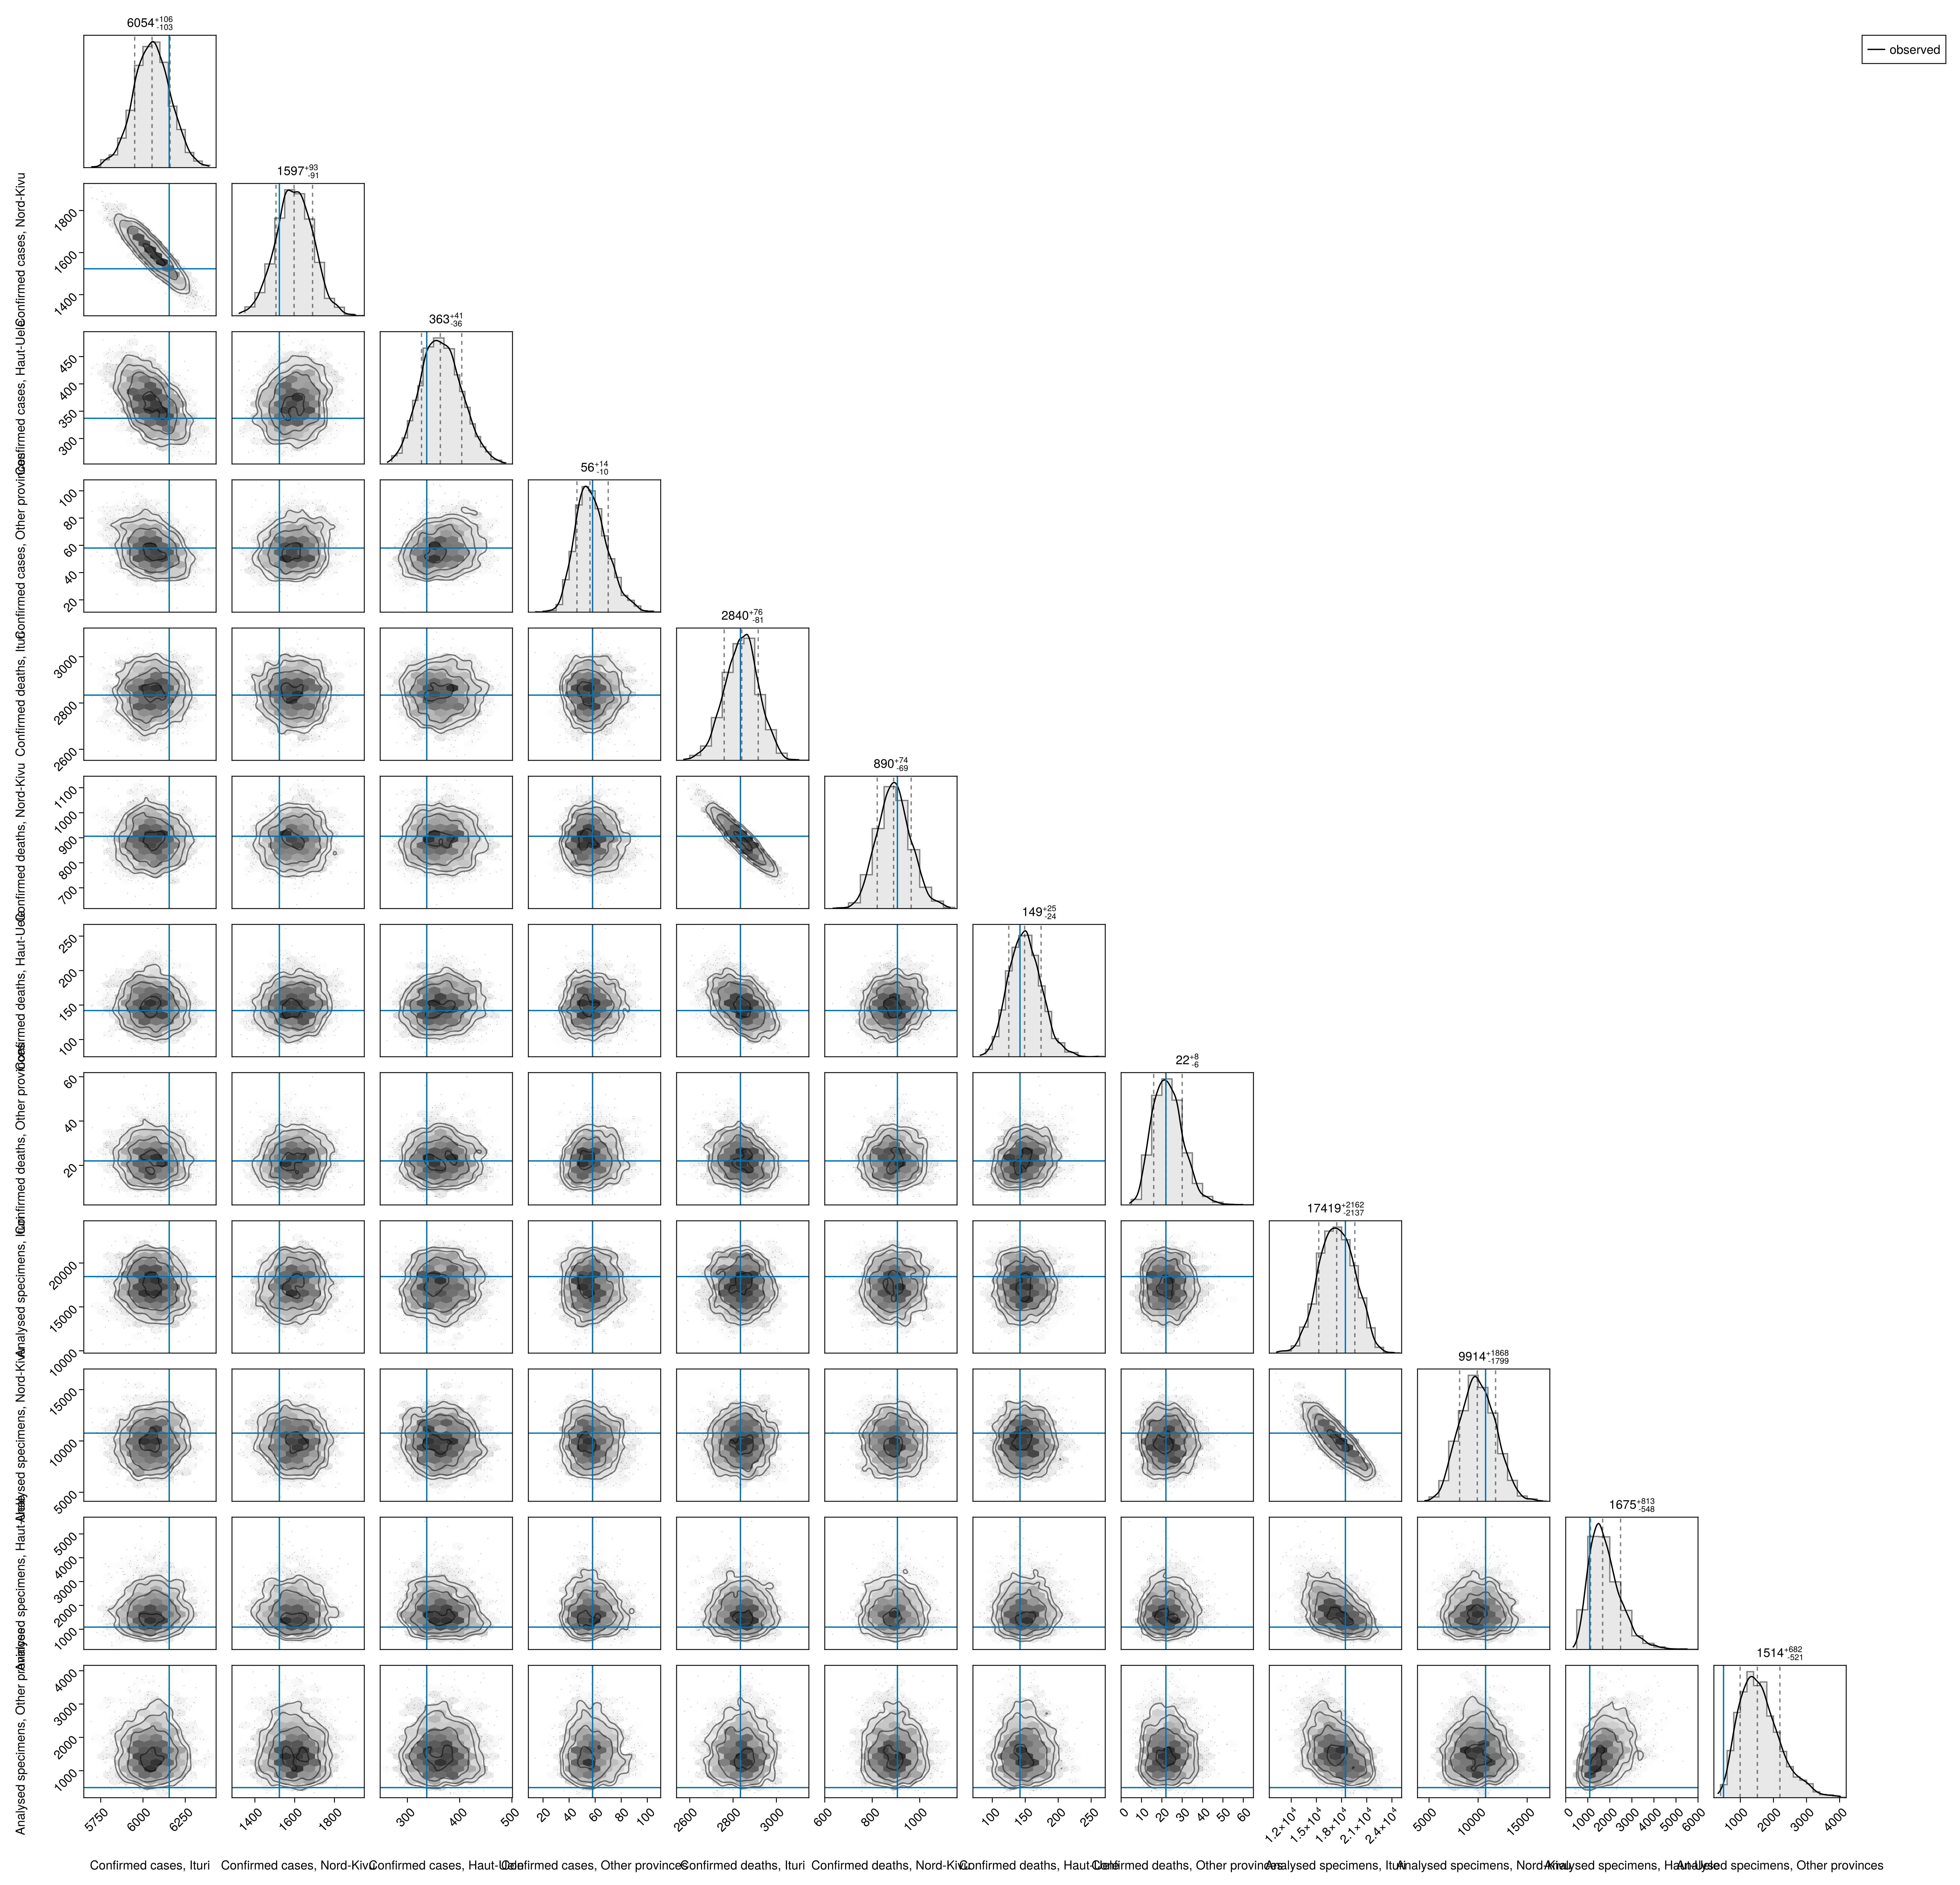
Province parameter recovery
Whether the model recovers each province's values when fitted to data it simulated itself, from the same runs as the national parameter recovery. The top panel shows each seed's posterior median with its 50% and 90% intervals divided by that seed's true value. Below, each quantity by province is on its own scale with the prior in grey, each seed's posterior in its colour and its true value as a dashed line.
Recovery figure
province_recovery_results = recovery_results()
_recovery_short = [
    "C_T_patch" => "C_T", "R_T_patch" => "R_T", "CFR_patch" => "CFR",
    "province_ascertainment" => "ascertainment",
    "region_drift_sd" => "drift SD",
]
province_recovery_quantities = [
    "$(k)[$(p)]" for (k, _) in _recovery_short for p in PROVINCE_LABELS
]
province_recovery_fig = isempty(province_recovery_results.params) ? nothing :
    plot_recovery(
        province_recovery_results.params, province_recovery_results.draws,
        province_recovery_results.prior;
        quantities = province_recovery_quantities,
        labels = Dict(
            "$(k)[$(p)]" => "$(v), $(p)" for (k, v) in _recovery_short
            for p in PROVINCE_LABELS
        ),
        panel_labels = Dict(
            "$(k)[$(p)]" => p for (k, _) in _recovery_short for p in PROVINCE_LABELS
        ),
        row_labels = last.(_recovery_short),
        log_x = ["C_T_patch[$(p)]" for p in PROVINCE_LABELS]
    );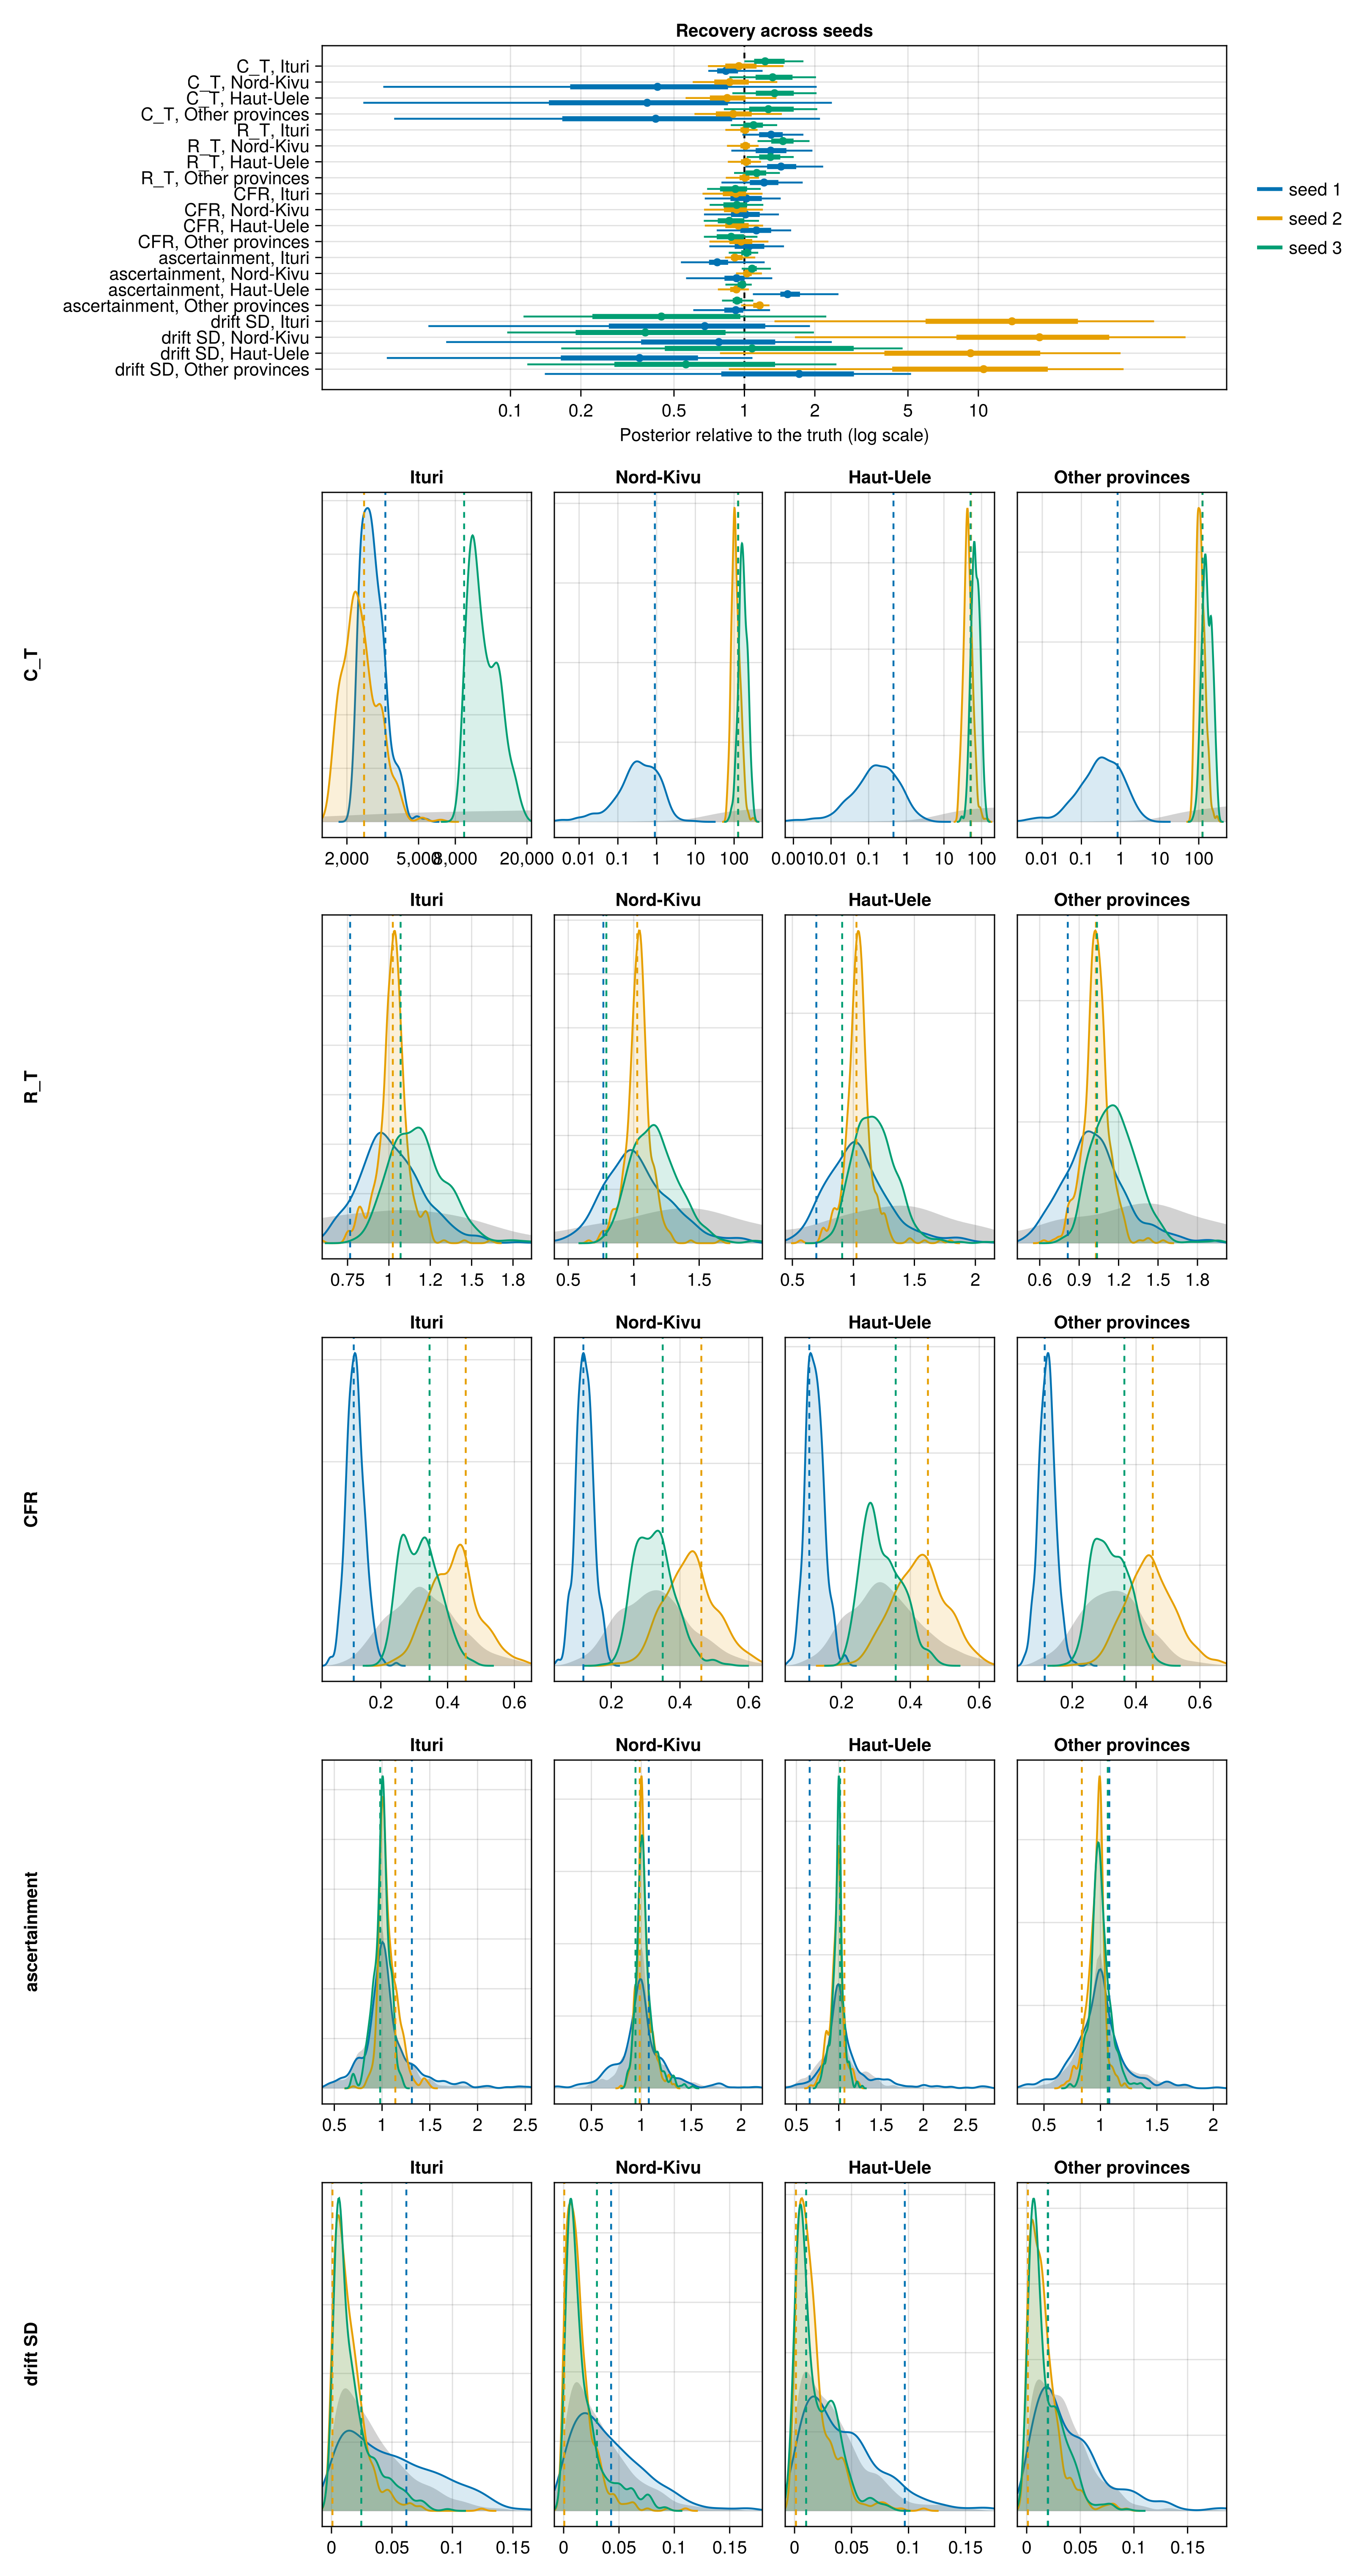
The error of each seed's posterior median relative to the truth, and the z-score of the truth, summarised across seeds.
Summary table across seeds
province_recovery_summary = isempty(province_recovery_results.params) ?
    DataFrame() :
    recovery_summary_table(province_recovery_results.params; province = true);

province_recovery_summary_display = isempty(province_recovery_summary) ?
    Markdown.parse("No parameter-recovery run is available for this build.") :
MarkdownTable(province_recovery_summary);| Quantity | Truth, lowest | Truth, highest | Relative error, median | Relative error, range | z, median | Truth in 90% | Outside 99% |
|---|---|---|---|---|---|---|---|
| CFR_patch[Haut-Uele] | 0.107 | 0.451 | -0.06 | -0.14 to 0.13 | -0.37 | 3/3 | 0 |
| CFR_patch[Ituri] | 0.119 | 0.454 | -0.08 | -0.08 to 0.02 | -0.52 | 3/3 | 0 |
| CFR_patch[Nord-Kivu] | 0.119 | 0.462 | -0.07 | -0.07 to 0.01 | -0.44 | 3/3 | 0 |
| CFR_patch[Other provinces] | 0.114 | 0.452 | -0.03 | -0.12 to 0.05 | -0.14 | 3/3 | 0 |
| C_T_patch[Haut-Uele] | 0.456 | 52.4 | -0.16 | -0.62 to 0.35 | -0.36 | 3/3 | 0 |
| C_T_patch[Ituri] | 2490 | 8950 | -0.05 | -0.17 to 0.23 | 0 | 3/3 | 0 |
| C_T_patch[Nord-Kivu] | 0.902 | 128 | -0.13 | -0.57 to 0.32 | -0.34 | 3/3 | 0 |
| C_T_patch[Other provinces] | 0.843 | 125 | -0.1 | -0.58 to 0.27 | -0.23 | 3/3 | 0 |
| R_T_patch[Haut-Uele] | 0.696 | 1.03 | 0.29 | 0.02 to 0.43 | 1.29 | 1/3 | 0 |
| R_T_patch[Ituri] | 0.766 | 1.07 | 0.09 | 0.01 to 0.3 | 0.64 | 3/3 | 0 |
| R_T_patch[Nord-Kivu] | 0.768 | 1.03 | 0.29 | 0.01 to 0.46 | 0.99 | 2/3 | 0 |
| R_T_patch[Other provinces] | 0.813 | 1.04 | 0.13 | 0.01 to 0.21 | 0.78 | 3/3 | 0 |
| province_ascertainment[Haut-Uele] | 0.657 | 1.07 | -0.02 | -0.08 to 0.53 | -0.41 | 2/3 | 0 |
| province_ascertainment[Ituri] | 0.98 | 1.31 | -0.09 | -0.23 to 0.02 | -0.7 | 3/3 | 0 |
| province_ascertainment[Nord-Kivu] | 0.942 | 1.08 | 0.03 | -0.07 to 0.08 | 0.48 | 3/3 | 0 |
| province_ascertainment[Other provinces] | 0.835 | 1.08 | -0.07 | -0.08 to 0.16 | -0.35 | 3/3 | 0 |
| region_drift_sd[Haut-Uele] | 0.00124 | 0.0967 | 0.08 | -0.64 to 8.26 | 0.47 | 3/3 | 0 |
| region_drift_sd[Ituri] | 0.000798 | 0.0619 | -0.32 | -0.56 to 12.93 | -0.34 | 2/3 | 0 |
| region_drift_sd[Nord-Kivu] | 0.000575 | 0.0429 | -0.22 | -0.62 to 17.26 | -0.08 | 2/3 | 0 |
| region_drift_sd[Other provinces] | 0.00114 | 0.0199 | 0.71 | -0.44 to 9.53 | 0.66 | 3/3 | 0 |
Each seed's recovered province values
province_recovery = let r = province_recovery_results.params
    isempty(r) ? DataFrame() :
        r[
            occursin.("[", r.quantity), [
                :seed, :quantity, :truth, :median, :lower_90, :upper_90,
                :covered_90,
            ],
        ]
end;

province_recovery_display = isempty(province_recovery) ?
Markdown.parse("No parameter-recovery run is available for this build.") : MarkdownTable(province_recovery);| seed | quantity | truth | median | lower_90 | upper_90 | covered_90 |
|---|---|---|---|---|---|---|
| 1 | CFR_patch[Haut-Uele] | 0.107 | 0.12 | 0.0813 | 0.169 | true |
| 1 | CFR_patch[Ituri] | 0.119 | 0.121 | 0.0805 | 0.17 | true |
| 1 | CFR_patch[Nord-Kivu] | 0.119 | 0.12 | 0.08 | 0.167 | true |
| 1 | CFR_patch[Other provinces] | 0.114 | 0.119 | 0.0806 | 0.168 | true |
| 1 | C_T_patch[Haut-Uele] | 0.456 | 0.175 | 0.0107 | 1.079 | true |
| 1 | C_T_patch[Ituri] | 3270.351 | 2726.407 | 2292.053 | 3911.026 | true |
| 1 | C_T_patch[Nord-Kivu] | 0.902 | 0.384 | 0.0258 | 1.837 | true |
| 1 | C_T_patch[Other provinces] | 0.843 | 0.352 | 0.0268 | 1.773 | true |
| 1 | R_T_patch[Haut-Uele] | 0.696 | 0.999 | 0.703 | 1.512 | false |
| 1 | R_T_patch[Ituri] | 0.766 | 0.995 | 0.75 | 1.368 | true |
| 1 | R_T_patch[Nord-Kivu] | 0.768 | 0.995 | 0.675 | 1.5 | true |
| 1 | R_T_patch[Other provinces] | 0.813 | 0.987 | 0.649 | 1.444 | true |
| 1 | province_ascertainment[Haut-Uele] | 0.657 | 1.005 | 0.714 | 1.658 | false |
| 1 | province_ascertainment[Ituri] | 1.312 | 1.005 | 0.702 | 1.602 | true |
| 1 | province_ascertainment[Nord-Kivu] | 1.075 | 0.995 | 0.606 | 1.415 | true |
| 1 | province_ascertainment[Other provinces] | 1.079 | 0.991 | 0.652 | 1.389 | true |
| 1 | region_drift_sd[Haut-Uele] | 0.0967 | 0.0345 | 0.00286 | 0.105 | true |
| 1 | region_drift_sd[Ituri] | 0.0619 | 0.0419 | 0.00276 | 0.118 | true |
| 1 | region_drift_sd[Nord-Kivu] | 0.0429 | 0.0333 | 0.00228 | 0.101 | true |
| 1 | region_drift_sd[Other provinces] | 0.0199 | 0.0342 | 0.00279 | 0.103 | true |
| 2 | CFR_patch[Haut-Uele] | 0.451 | 0.425 | 0.306 | 0.542 | true |
| 2 | CFR_patch[Ituri] | 0.454 | 0.418 | 0.301 | 0.543 | true |
| 2 | CFR_patch[Nord-Kivu] | 0.462 | 0.428 | 0.311 | 0.554 | true |
| 2 | CFR_patch[Other provinces] | 0.452 | 0.438 | 0.321 | 0.573 | true |
| 2 | C_T_patch[Haut-Uele] | 52.357 | 44.217 | 29.348 | 71.755 | true |
| 2 | C_T_patch[Ituri] | 2490.948 | 2359.933 | 1740.259 | 3659.305 | true |
| 2 | C_T_patch[Nord-Kivu] | 127.97 | 110.794 | 76.937 | 176.854 | true |
| 2 | C_T_patch[Other provinces] | 124.486 | 111.481 | 76.154 | 179.947 | true |
| 2 | R_T_patch[Haut-Uele] | 1.025 | 1.043 | 0.871 | 1.207 | true |
| 2 | R_T_patch[Ituri] | 1.024 | 1.03 | 0.848 | 1.165 | true |
| 2 | R_T_patch[Nord-Kivu] | 1.027 | 1.038 | 0.865 | 1.181 | true |
| 2 | R_T_patch[Other provinces] | 1.028 | 1.034 | 0.856 | 1.186 | true |
| 2 | province_ascertainment[Haut-Uele] | 1.067 | 0.987 | 0.822 | 1.115 | true |
| 2 | province_ascertainment[Ituri] | 1.139 | 1.037 | 0.941 | 1.268 | true |
| 2 | province_ascertainment[Nord-Kivu] | 0.985 | 1.009 | 0.907 | 1.17 | true |
| 2 | province_ascertainment[Other provinces] | 0.835 | 0.971 | 0.809 | 1.069 | true |
| 2 | region_drift_sd[Haut-Uele] | 0.00124 | 0.0115 | 0.000975 | 0.0503 | true |
| 2 | region_drift_sd[Ituri] | 0.000798 | 0.0111 | 0.00107 | 0.045 | false |
| 2 | region_drift_sd[Nord-Kivu] | 0.000575 | 0.0105 | 0.000945 | 0.0441 | false |
| 2 | region_drift_sd[Other provinces] | 0.00114 | 0.012 | 0.000981 | 0.0477 | true |
| 3 | CFR_patch[Haut-Uele] | 0.358 | 0.308 | 0.24 | 0.413 | true |
| 3 | CFR_patch[Ituri] | 0.346 | 0.317 | 0.24 | 0.406 | true |
| 3 | CFR_patch[Nord-Kivu] | 0.35 | 0.325 | 0.248 | 0.421 | true |
| 3 | CFR_patch[Other provinces] | 0.363 | 0.319 | 0.244 | 0.413 | true |
| 3 | C_T_patch[Haut-Uele] | 51.006 | 68.639 | 45.308 | 103.721 | true |
| 3 | C_T_patch[Ituri] | 8953.443 | 10979.543 | 8953.004 | 16006.663 | true |
| 3 | C_T_patch[Nord-Kivu] | 126.739 | 167.399 | 109.392 | 256.411 | true |
| 3 | C_T_patch[Other provinces] | 124.946 | 158.174 | 102.151 | 255.902 | true |
| 3 | R_T_patch[Haut-Uele] | 0.908 | 1.174 | 0.928 | 1.475 | false |
| 3 | R_T_patch[Ituri] | 1.071 | 1.172 | 0.936 | 1.478 | true |
| 3 | R_T_patch[Nord-Kivu] | 0.791 | 1.156 | 0.9 | 1.501 | false |
| 3 | R_T_patch[Other provinces] | 1.035 | 1.169 | 0.935 | 1.468 | true |
| 3 | province_ascertainment[Haut-Uele] | 1.017 | 0.996 | 0.843 | 1.093 | true |
| 3 | province_ascertainment[Ituri] | 0.98 | 1.003 | 0.84 | 1.123 | true |
| 3 | province_ascertainment[Nord-Kivu] | 0.942 | 1.016 | 0.917 | 1.222 | true |
| 3 | province_ascertainment[Other provinces] | 1.065 | 0.991 | 0.854 | 1.163 | true |
| 3 | region_drift_sd[Haut-Uele] | 0.0102 | 0.011 | 0.00168 | 0.0482 | true |
| 3 | region_drift_sd[Ituri] | 0.0246 | 0.0109 | 0.0028 | 0.0552 | true |
| 3 | region_drift_sd[Nord-Kivu] | 0.0301 | 0.0113 | 0.00291 | 0.0596 | true |
| 3 | region_drift_sd[Other provinces] | 0.0197 | 0.0111 | 0.00232 | 0.0486 | true |
Saving province in-sample outputs
Write the summary bullets
# The bullets under the summary heading at the top of the page. They read
# tables built further down, so they are written here and read back when
# the site is assembled.
evaluation_insample_province_summary = let
    fmt(x) = ismissing(x) || !isfinite(x) ? "n/a" :
        string(round(x; digits = 2))
    fitted = filter(r -> isfinite(r["Bias"]), province_calibration_table)
    worst = first(
        sort(fitted, "Bias"; by = abs, rev = true), min(3, size(fitted, 1))
    )
    function coverage_bullet(heading, tbl, scale)
        low = first(sort(tbl, "90% coverage"), min(1, size(tbl, 1)))
        return string(
            "- **", heading, ":** ", count(>=(0.8), tbl[!, "90% coverage"]),
            " of ", size(tbl, 1), " province streams have 90% coverage of ",
            "at least 0.8", scale,
            size(low, 1) == 0 ? "." :
                string(
                    "; the lowest is ", low[1, "Stream"], " at ",
                    fmt(low[1, "90% coverage"]), "."
                )
        )
    end
    overall = [
        string(
            "- **Least well reproduced:** ",
            join(
                [
                    string(
                        r["Stream"], " (bias ", fmt(r["Bias"]),
                        ", 90% coverage ", fmt(r["90% coverage"]), ")"
                    )
                        for r in eachrow(worst)
                ], "; "
            ), "."
        ),
        coverage_bullet("Coverage", fitted, ""),
        coverage_bullet(
            "Count-scale coverage",
            filter(
                r -> isfinite(r["Bias"]), province_count_calibration_table
            ),
            ""
        ),
    ]
    rows(tbl) = Dict(r["Stream"] => r for r in eachrow(tbl))
    cal = rows(province_calibration_table)
    count_cal = rows(province_count_calibration_table)
    function calibration(tbl, kind, p, label)
        r = get(tbl, string(kind, ", ", PROVINCE_LABELS[p]), nothing)
        r === nothing && return string("- ", label, ": not scored.")
        return string(
            "- ", label, ": bias ", fmt(r["Bias"]), " and 90% coverage ",
            fmt(r["90% coverage"]), " over ", r["Vintages"], " vintages."
        )
    end
    detail = [
        join(
            [
                string("**", PROVINCE_LABELS[p], "**"), "",
                calibration(cal, "Confirmed cases", p, "Confirmed cases"),
                calibration(cal, "Confirmed deaths", p, "Confirmed deaths"),
                calibration(
                    count_cal, "Confirmed cases", p,
                    "Confirmed cases as counts"
                ),
                calibration(
                    count_cal, "Confirmed deaths", p,
                    "Confirmed deaths as counts"
                ),
            ], "\n"
        )
            for p in 1:N_PATCHES
    ]
    join(vcat([join(overall, "\n")], detail), "\n\n")
end
dashboard_dir = joinpath(
    pkgdir(BVDOutbreakSize), "docs", "src", "summary_assets"
)
mkpath(dashboard_dir)
write(
    joinpath(dashboard_dir, "evaluation_insample_province.md"),
    evaluation_insample_province_summary
);