Health-zone forecasts
This page splits the one-week-ahead confirmed-case forecast across the health zones. The split is defined in the health-zone model Methods section. The national forecast is on the forecasts page and the split by province on the province forecasts page. How these forecasts have scored against what each zone went on to report is in the forecast by health zone evaluation. The zone estimates behind the split are on the health-zone estimates page.
Load packages, data and fitted chains
# Shared setup: packages, observations and the fit registry. See
# `docs/pages/_setup.jl`.
using BVDOutbreakSize
include(joinpath(pkgdir(BVDOutbreakSize), "docs", "pages", "_setup.jl"))
validation_forecast_from (generic function with 1 method)# The zone fit this page reads, loaded from the cache here.
chn_local = load_fit("local");Summary
The overall bullets rank the zones. The table and figure below give each zone's own projection.
Split the one-week-ahead forecast across the zones
# `zone_stage_inputs` is defined in the shared setup, so the zone
# estimates page draws the same forecast from the same fixed inputs.
zone_inputs = zone_stage_inputs(; forecast = true);
zone_patch = zone_inputs.patch_of_zone;
zone_week_end = obs.cutoff + Day(7);
ZONE_THRESHOLDS = (1, 5, 10, 20)
zone_fc = zone_forecast(chn_local, zone_inputs);
zone_fc_draws = zone_forecast_draws(zone_fc, zone_inputs);
zone_fc_probs = zone_forecast_probabilities(
    zone_fc, zone_inputs; thresholds = ZONE_THRESHOLDS, draws = zone_fc_draws
);
zone_forecast_summary = zone_forecast_table(
    zone_fc, zone_inputs; thresholds = ZONE_THRESHOLDS
);
# Cases allocated to each zone over the past one, two and four weeks, and
# the last vintage on which each zone's count rose.
zone_recent = Dict(
    w => zone_recent_cases(zone_inputs; window = w) for w in (7, 14, 28)
);
zone_last_case = zone_last_case_dates(zone_inputs);
zone_forecast_bullets = let n_zones = length(zone_inputs.zone_labels)
    pct(x) = string(round(Int, 100 * x), "%")
    lead = first(
        sortperm([median(v) for v in zone_fc_draws.zones]; rev = true), 3
    )
    ranked = join(
        [
            "$(zone_inputs.zone_labels[z]) " *
                "$(median_interval_text(zone_fc_draws.zones[z]))"
                for z in lead
        ], "; "
    )
    quiet = findall(iszero, zone_recent[14])
    quiet_text = isempty(quiet) ?
        "every zone has had a case allocated over the past two weeks." :
        let z = quiet[argmax(zone_fc_probs[quiet, 1])]
            "$(length(quiet)) zones have had no case allocated over the " *
            "past two weeks. $(zone_inputs.zone_labels[z]) is the " *
            "most likely of them to report one, at " *
            "$(pct(zone_fc_probs[z, 1]))."
    end
    join(
        [
            "Projected counts are for the week to $(zone_week_end).", "",
            "- **Most new confirmed cases:** $(ranked).",
            "- **Chance of a case:** " *
                "$(count(>=(0.5), zone_fc_probs[:, 1])) of $(n_zones) " *
                "zones have at least an even chance of reporting a " *
                "confirmed case, and " *
                "$(count(>=(0.5), zone_fc_probs[:, 3])) of reporting at " *
                "least ten.",
            "- **Quiet zones:** $(quiet_text)",
        ], "\n"
    )
end;
Projected counts are for the week to 2026-10-03.
Most new confirmed cases: Beni about 82 (90% credible interval 37 to 155); Mandima about 77 (90% credible interval 29 to 164); Bunia about 43 (90% credible interval 14 to 94).
Chance of a case: 29 of 63 zones have at least an even chance of reporting a confirmed case, and 11 of reporting at least ten.
Quiet zones: 21 zones have had no case allocated over the past two weeks. Bafwasende is the most likely of them to report one, at 51%.
One-week-ahead forecast by health zone
The figure and table below give the fifteen zones with the largest forecasts. The patch totals in the table are the projections on the province forecasts page. Each zone's count is drawn from the zone model run a week past the cut-off, splitting a draw of its province's forecast total over the province's zones. The last four columns are the probability that the zone reports at least 1, 5, 10 and 20 confirmed cases over the week (Equation (71)).
One-week-ahead zone forecast
zone_forecast_fig = plot_zone_forecast(
    zone_fc_draws.zones,
    zone_inputs.zone_labels, zone_patch;
    patch_labels = zone_inputs.patch_labels, top = 15
);
# The fifteen largest zone forecasts, then every patch total.
zone_forecast_display = let t = zone_forecast_summary
    zones = sort(t[t.zone .!= "Patch total", :], :median; rev = true)
    vcat(first(zones, 15), t[t.zone .== "Patch total", :])
end;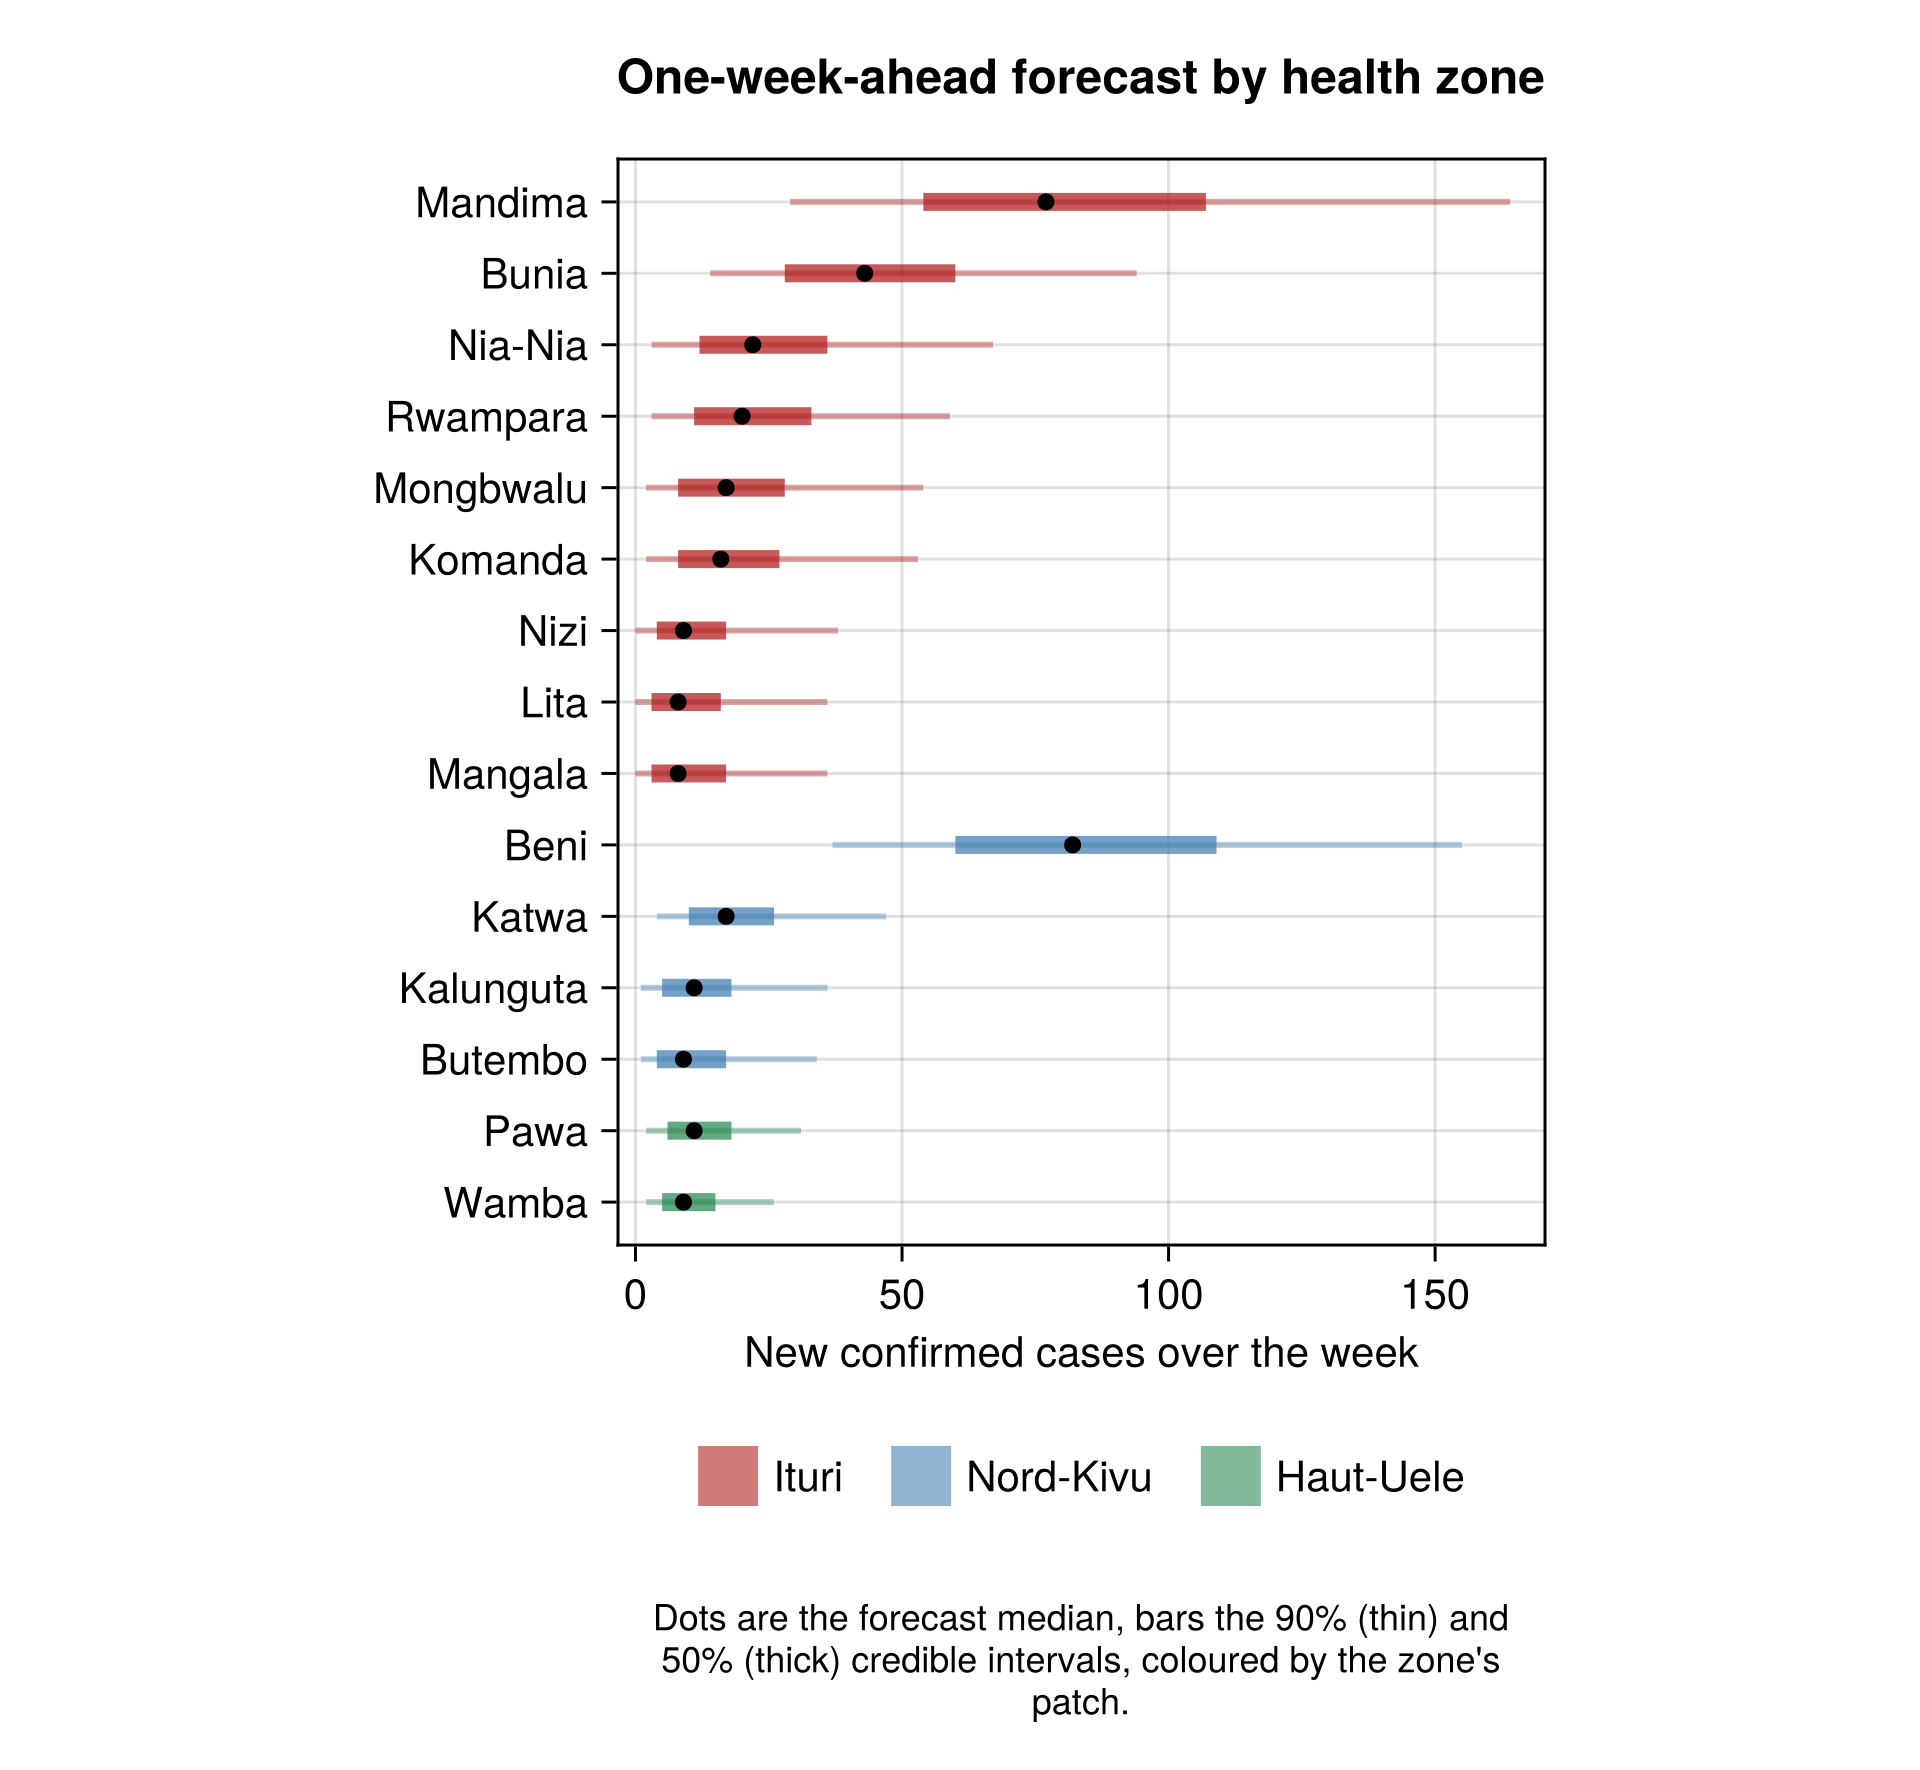
| zone | patch | median | lower_90 | lower_60 | lower_30 | upper_30 | upper_60 | upper_90 | p_ge_1 | p_ge_5 | p_ge_10 | p_ge_20 |
|---|---|---|---|---|---|---|---|---|---|---|---|---|
| Beni | Nord-Kivu | 82 | 37 | 55 | 70 | 96 | 116 | 155 | 1 | 1 | 1 | 1 |
| Mandima | Ituri | 77 | 29 | 50 | 64 | 95 | 116 | 164 | 1 | 1 | 1 | 0.98 |
| Bunia | Ituri | 43 | 14 | 25 | 34 | 53 | 65 | 94 | 1 | 1 | 0.98 | 0.88 |
| Nia-Nia | Ituri | 22 | 3 | 10 | 16 | 30 | 41 | 67 | 0.99 | 0.93 | 0.82 | 0.56 |
| Rwampara | Ituri | 20 | 3 | 9 | 15 | 27 | 37 | 59 | 0.99 | 0.93 | 0.8 | 0.52 |
| Mongbwalu | Ituri | 17 | 2 | 7 | 12 | 22 | 32 | 54 | 0.99 | 0.88 | 0.71 | 0.42 |
| Katwa | Nord-Kivu | 17 | 4 | 8 | 13 | 22 | 29 | 47 | 1 | 0.92 | 0.76 | 0.41 |
| Komanda | Ituri | 16 | 2 | 7 | 11 | 23 | 30 | 53 | 0.98 | 0.87 | 0.71 | 0.42 |
| Kalunguta | Nord-Kivu | 11 | 1 | 4 | 7 | 15 | 21 | 36 | 0.97 | 0.79 | 0.54 | 0.22 |
| Pawa | Haut-Uele | 11 | 2 | 6 | 8 | 15 | 20 | 31 | 0.99 | 0.86 | 0.58 | 0.21 |
| Nizi | Ituri | 9 | 0 | 3 | 6 | 13 | 20 | 38 | 0.95 | 0.72 | 0.5 | 0.22 |
| Butembo | Nord-Kivu | 9 | 1 | 3 | 6 | 13 | 19 | 34 | 0.97 | 0.76 | 0.5 | 0.19 |
| Wamba | Haut-Uele | 9 | 2 | 4 | 6 | 12 | 16 | 26 | 0.98 | 0.77 | 0.45 | 0.13 |
| Lita | Ituri | 8 | 0 | 3 | 5 | 13 | 18 | 36 | 0.93 | 0.67 | 0.45 | 0.19 |
| Mangala | Ituri | 8 | 0 | 2 | 5 | 12 | 20 | 36 | 0.92 | 0.67 | 0.45 | 0.19 |
| Patch total | Ituri | 280 | 162 | 214 | 249 | 314 | 351 | 425 | ||||
| Patch total | Nord-Kivu | 167 | 78 | 121 | 146 | 188 | 216 | 284 | ||||
| Patch total | Haut-Uele | 28 | 8 | 15 | 21 | 35 | 46 | 69 | ||||
| Patch total | Other provinces | 11 | 2 | 5 | 8 | 14 | 19 | 32 |
Zones quiet for two weeks
The table lists the zones with no allocated case over the past two weeks, ranked by the probability that they report at least one. It also gives the cases over the past four weeks and the date of the last case.
Quiet zones ranked by the chance of a case
zone_quiet_display = let
    quiet = findall(iszero, zone_recent[14])
    order = quiet[sortperm(zone_fc_probs[quiet, 1]; rev = true)]
    DataFrame(
        zone = zone_inputs.zone_labels[order],
        patch = zone_inputs.patch_labels[zone_patch[order]],
        cases = zone_inputs.cumulative[order],
        cases_past_4_weeks = zone_recent[28][order],
        last_case = [
            ismissing(d) ? "" : string(d) for d in zone_last_case[order]
        ],
        p_ge_1 = round.(zone_fc_probs[order, 1]; digits = 2),
        p_ge_5 = round.(zone_fc_probs[order, 2]; digits = 2),
    )
end;| zone | patch | cases | cases_past_4_weeks | last_case | p_ge_1 | p_ge_5 |
|---|---|---|---|---|---|---|
| Bafwasende | Other provinces | 7 | 5 | 2026-09-12 | 0.51 | 0.04 |
| Ganga | Other provinces | 3 | 2 | 2026-09-11 | 0.35 | 0.02 |
| Lubunga | Other provinces | 1 | 0 | 2026-07-11 | 0.3 | 0.01 |
| Drodro | Ituri | 15 | 2 | 2026-09-04 | 0.27 | 0.08 |
| Miti-Murhesa | Other provinces | 3 | 0 | 2026-06-01 | 0.26 | 0.01 |
| Buta | Other provinces | 1 | 0 | 2026-08-12 | 0.23 | 0 |
| Tshopo | Other provinces | 1 | 0 | 2026-08-13 | 0.23 | 0 |
| Wanie-Rukula | Other provinces | 1 | 0 | 2026-08-01 | 0.22 | 0 |
| Kayna | Nord-Kivu | 1 | 1 | 2026-09-04 | 0.18 | 0.04 |
| Gety | Ituri | 7 | 1 | 2026-09-06 | 0.18 | 0.05 |
| Logo | Ituri | 13 | 2 | 2026-09-04 | 0.17 | 0.05 |
| Rungu | Haut-Uele | 2 | 1 | 2026-09-02 | 0.17 | 0.01 |
| Aru | Ituri | 8 | 0 | 2026-08-28 | 0.15 | 0.04 |
| Aungba | Ituri | 12 | 0 | 2026-08-20 | 0.14 | 0.04 |
| Ariwara | Ituri | 8 | 0 | 2026-08-17 | 0.14 | 0.04 |
| Mahagi | Ituri | 4 | 0 | 2026-07-27 | 0.13 | 0.04 |
| Gombari | Haut-Uele | 3 | 0 | 2026-08-22 | 0.12 | 0 |
| Goma | Nord-Kivu | 1 | 0 | 2026-07-02 | 0.11 | 0.02 |
| Boga | Ituri | 2 | 0 | 2026-08-24 | 0.1 | 0.03 |
| Kambala | Ituri | 2 | 0 | 2026-06-30 | 0.1 | 0.03 |
| Adja | Ituri | 11 | 0 | 2026-07-25 | 0.07 | 0.02 |
Saving zone forecast assets
The summary dashboard shows the zone forecast figure and the summary bullets.
Write the zone forecast asset
dashboard_dir = joinpath(
    pkgdir(BVDOutbreakSize), "docs", "src", "summary_assets"
)
mkpath(dashboard_dir)
CairoMakie.save(
    joinpath(dashboard_dir, "zone_forecast.png"),
    zone_forecast_fig
)
open(joinpath(dashboard_dir, "zone_forecast.md"), "w") do io
    print(io, zone_forecast_bullets)
end
Past zone forecasts against what was observed
Each release archives its zone forecast, and later releases score it against what each zone went on to report. The figure shows the ten zones with the largest forecasts in this build, one panel per zone. The x-axis is the cut-off each forecast was made from. Each forecast shows its median and 90% predictive interval, beside the persistence baseline and the count the zone went on to report. A week is left out when the zone tables carry no vintage on its last day, when it holds a harmonisation-break day, or when its province moved unallocated cases into named zones during it. The scores are in the forecast by health zone across releases evaluation.
Load the archived zone forecasts and their outcomes
# Written by `scripts/score_releases.jl` from each release's
# `zone_forecast.csv`, in the national overlay's schema. A missing file
# reads as an empty table, which the figure reports as nothing scored.
zone_overlay_df = _release_data(
    joinpath("zone", "forecast_overlay.csv"),
    (;
        release = String, made_date = Date, stream = String, horizon = Int,
        target_date = Date, fit = String, observed = Float64,
        median = Float64, lo30 = Float64, hi30 = Float64, lo60 = Float64,
        hi60 = Float64, lo90 = Float64, hi90 = Float64,
    )
)
zone_past_keys = zone_inputs.zone_keys[
    first(sortperm([median(v) for v in zone_fc_draws.zones]; rev = true), 10),
]
zone_past_fig = plot_forecast_overlay(
    zone_score_rows(
        scored_overlay(zone_overlay_df), zone_past_keys,
        zone_inputs.zone_labels[indexin(zone_past_keys, zone_inputs.zone_keys)]
    );
    empty_message = "No zone forecast has been scored yet. Scores appear " *
        "from the first release that archives the zone forecast onwards."
);
Archiving the zone forecast
Each release carries the zone forecast draws in zone_forecast.csv, for scoring once the week has been reported.
Write the zone forecast archive
output_dir = get(
    ENV, "BVD_OUTPUT_DIR",
    joinpath(pkgdir(BVDOutbreakSize), "output")
)
mkpath(output_dir)
CSV.write(
    joinpath(output_dir, "zone_forecast.csv"),
    zone_forecast_archive(
        zone_fc, zone_inputs; made_date = zone_inputs.cutoff, thin = 5
    )
);
The full analysis code, data and model definitions are in the epiforecasts/BVDOutbreakSize repository.